Edraw Article Center
Read articles on diagram knowledge, learn how to make diagrams, find examples for reference, and check out tips about Edraw.
Top Knowledge That Everyone Need to Know


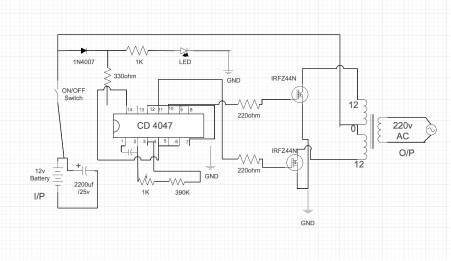
Electrical Diagram


Organizational Chart


All Knowledge Articles

Notice of Termination of Updates for EdrawMath and Edraw Office Component
The Edraw Team is stop the updates for EdrawMath and Edraw Office Component