What is a System Flowchart?
Know it All about System Flowchart
A system flowchart shows the path taken by data in a system and the decisions made during different levels. Different symbols are strung together to show data flow, including what happens to data and where it goes.
There are 4 main categories of flowcharts when we consider the user groups. Each of these flowcharts only differs in control of that exercise. The following are the types of flowcharts:
Document Flowcharts are a way of illustrating the document flow from one business unit to another. It is an essential tool for analysts to track various paperwork inside the business.
These flowcharts show the control over data flow in the system. However, charts are only concerned with the data flow and not the decisions involved in it. It includes input, output, processes, datastore, etc.
These flowcharts show physical control or resource level control. These flowcharts show data flow, but unlike data flowcharts, it also shows how decisions can control events. It shows data flow through major components like data entry, programs, storage media, and processes.
This flowchart shows control over a program in a system. A program flowchart is very important while writing code or a program. It shows how data flows while writing an algorithm.
Some people might confuse system flowcharts with data flowcharts as both show the path of data with similar symbols. However, the main point of difference is that data flowcharts only show the path, not the decisions.
Both of these charts use similar symbols that are connected through lines to show the flow of data. While the Data flowchart shows the flow of data, the system flowchart shows the decision boxes when decisions are made. These are represented with a diamond shape, with each line leaving the diamond showing a different decision.
A system flowchart is mainly used for physical modeling of the system showing inputs, outputs, and processes. Analysts frequently use them to illustrate the whole system graphically.
There are multiple symbols used in a system flowchart. All symbols are unique and represent a different process, input, output, or media item.
A system flowchart begins and ends with an oval symbol. This is also called the ‘terminator’ and indicates the start and end of the processes mentioned.
A rectangle then represents a process or an activity.
If any data is input into the computer, then a parallelogram is used. The data input can be in many forms, including keyboard, microphone, mouse, scanner, and multiple other kinds of sensors.
Then there are multiple types of output like printers, display devices, or speakers.
One of the major symbols used in system flowcharts is the decision boxes represented by a diamond shape. They represent the decisions made, and all arrows coming out of these decision boxes show alternate pathways for data.

Lastly, all these shapes are connected through arrows showing the direction of the flow and how data moves along the entire system.
However, just knowing the flowchart symbols is simply not enough for understanding a system flowchart. To understand it, you need to trace the pathway from one symbol to another. If you land on a decision symbol showing two alternate paths, you need to trace both of them to see where they end.

・ Simple alternative to Visio
・ 26k+ symbols
・ 10K+ free templates
・ 10+ AI diagram generators
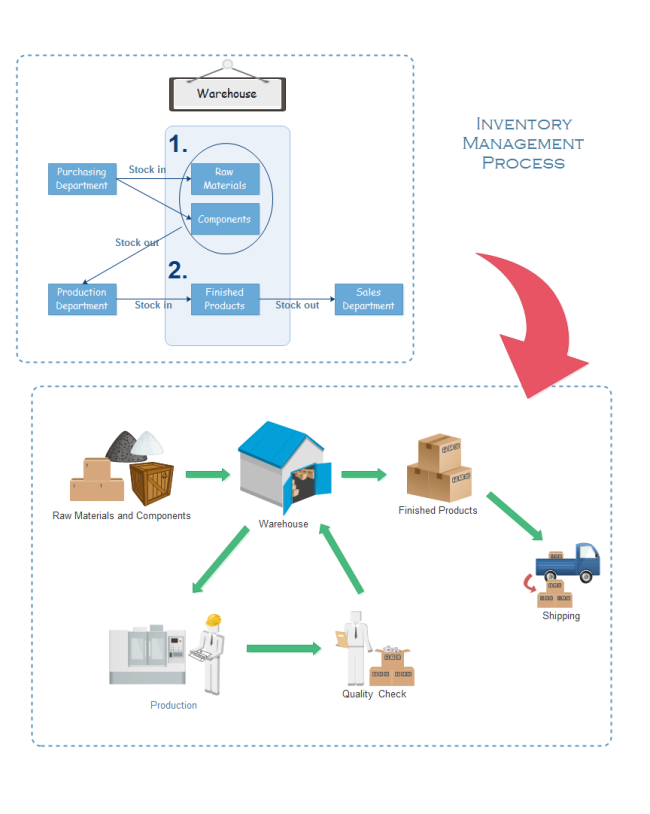
System flowcharts are helpful for showing data pathways for programming processes, but they can also be used for multiple other processes. One of the primary uses of system flowcharts is in the management processes. Processes like inventory management and supply chain management require assistance from such flowcharts to understand the movement of goods from one point to another. Let’s look at some examples for system flowcharts:
The inventory management flowchart will help you understand the path taken from raw materials to when the inventory is sold out. It will highlight all the critical processes the goods go through, including any required inputs. You have a choice of either using a simpler flowchart or use one with graphics depending on the type of audience you are addressing.
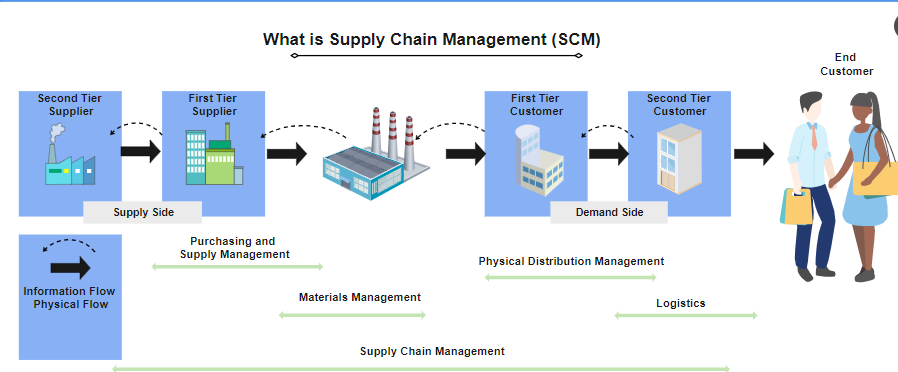
A Supply Chain Management chart is essential in tracking the goods when they leave the supplier to reach the consumer. The flowchart discusses all the processes involved and shows the role of tier 1 and tier 2 suppliers. The graphical illustrations make it extremely easy to understand and use. By connecting the demand and supply, this chart can be very efficient to show to laymen, including people not directly involved.
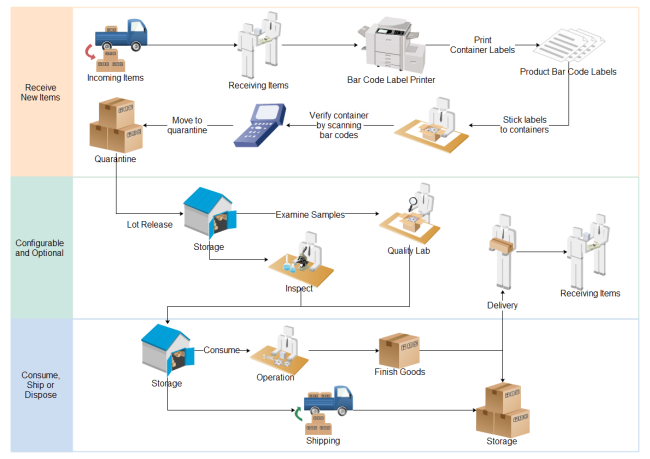
It is essential to know all the follow-up processes when inventory or goods are received. This material flow chart shows what processes should be done to ensure correct goods are received and paid for. This chart includes pictures that will make it very easy for anyone to understand the entire process and remember it.
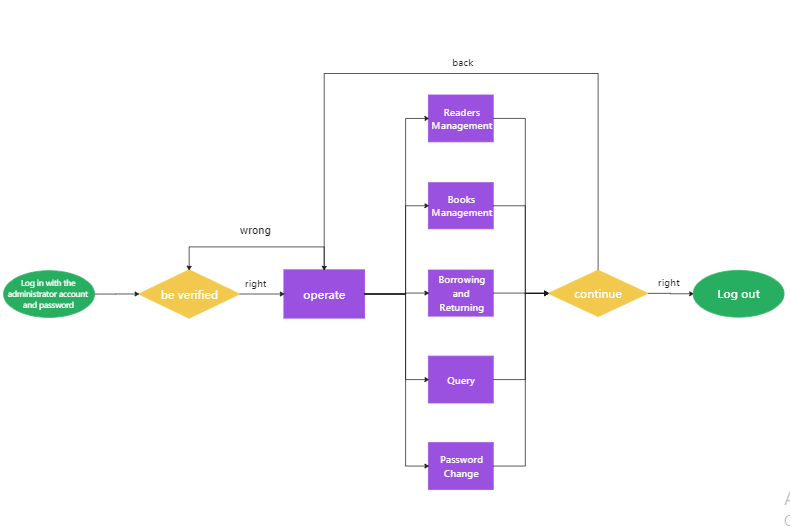
A library management system can make it very easy to borrow and return books both for the librarian and the borrower. This flowchart will readily be understood by anyone new to the library management system and unaware of the whole process. Even though this chart has no images, the flow of data is not difficult to grasp.
EdrawMax is an excellent platform if you want to create your own system flowcharts or you just want to modify a predesigned template. It is an equally efficient tool for both beginners and professionals. The experts can use multiple functions in EdrawMax to create their own designs, or if they lack time, they have ample designs to choose from the premade templates.
The symbols are available on the left side of the drawing screen, and you have the choice to personalize those symbols according to the needs of your chart or company color scheme. With EdrawMax creating your own flowcharts is much simpler and more accessible.
System flowcharts can be a handy tool for tracking information and all the controls implemented along the way. You can especially use it in inventory management or supply management systems to track goods and all the related processes. With system flowcharts, you make sure everyone is on the same page regarding procedures and steps to follow. EdrawMax helps you create flowcharts quickly and easily. With the help of such flowcharts, you can impress your audience and make sure the process runs smoothly.


