UML Timing Diagram
Know it All about UML Timing Diagram
The timing diagram is a UML behavioral diagram that reveals interactions focusing on timing and related constraints. Timing diagrams also explore the behaviors of objects throughout a timespan. A timing diagram is one of the three types of interaction diagrams and a specialized form of a sequence diagram. However, unlike sequence diagrams, in timing diagrams, the time increases from left to right, and the lifelines are depicted vertically.
You can consider a timing diagram an inverted form of sequence diagram because the time is shown on the x.axis and read from left to right while different components are shown on the y-axis. Timing diagrams are a great tool to show the time taken by each activity and help the team to identify the most time-intensive actions and a room for improvement.
When an object remains in a given state, the timeline runs parallel to that state. When a state change occurs, it is shown by the change in the vertical axis, and the object moves from one level to another. The change may occur because of a message, event, or a change of condition within the system. Thus, a timespan can also trigger a change in the timing diagram.
Timing diagrams serve many purposes in the UML modeling of a system. They are very effective in the identification and improvement of the activities that consume a lot of time from the team. Since time is a valuable asset, it is important to make an effort to save time during the project's life.
Let us see some more benefits of timing diagrams briefly.
In UML, the timing diagram has several symbols and shapes used to show the sequence of events in chronological order.
A lifeline in the timing diagram represents an individual element in the interaction. It shows a single entity that participates in an interaction. A lifeline in a Timing diagram is represented by a rectangular space within the content area of a frame. You can even stack different entities in a single frame.
A state lifeline shows the change in the state of an object over a while. The X-axis displays elapsed time, while the Y-axis is labeled with a given list of states. 】
The duration constraint is a constraint of an interval that determines if the constraint is satisfied for a duration or not.
If the system fails, the negative trace defines the violated constraints. For example, a graphical association between the duration interval and the construct represents a duration constraint.
Time constraint is a time expression that represents if the constraint is satisfied or not. The constraints dispense its time constraints semantics.
The negative trace defines the violated constraints, which means the system is failed. For example, the time constraint is represented by a graphical association between the time interval and the construct which it constrains.
The destruction occurrence is the occurrence of a message representing the destruction of an instance defined by a lifeline. It can also subsequently destroy other objects if any dependency exists. A cross represents it at the end of a timeline.
Step 1: Launch EdrawMax desktop software from your computer.
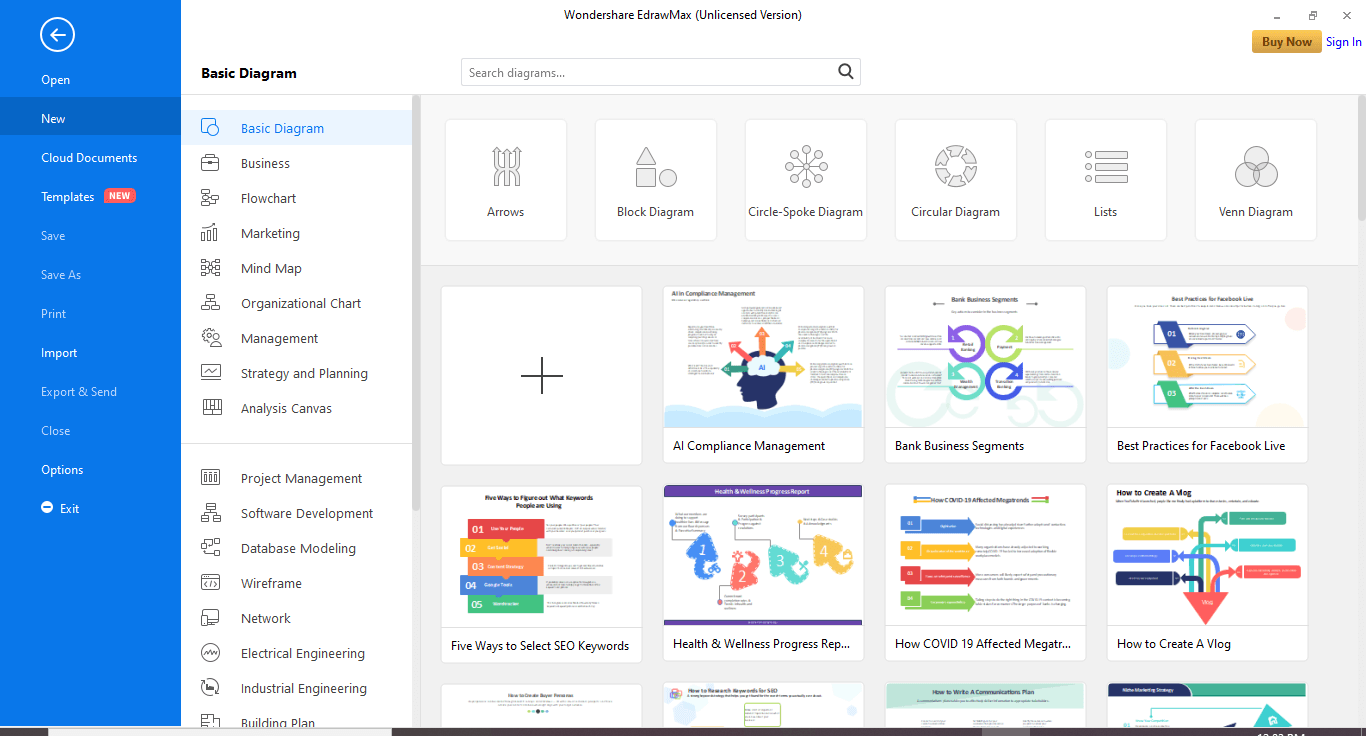
Step 2: Navigate to [New]>[Software Development]>[UML Modeling]
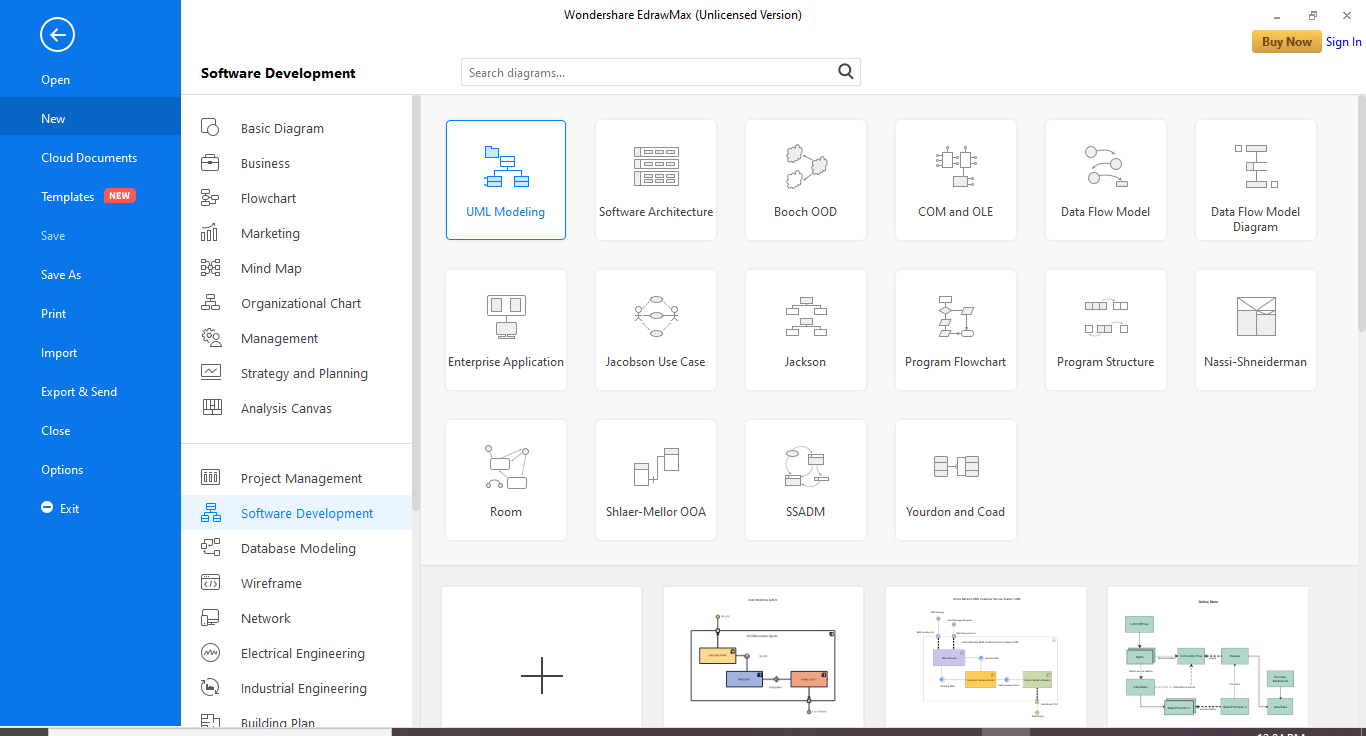
Step 3: You can select the timing diagram template if it matches your requirement. Once the template is on the canvas, you can make modifications for your needs.
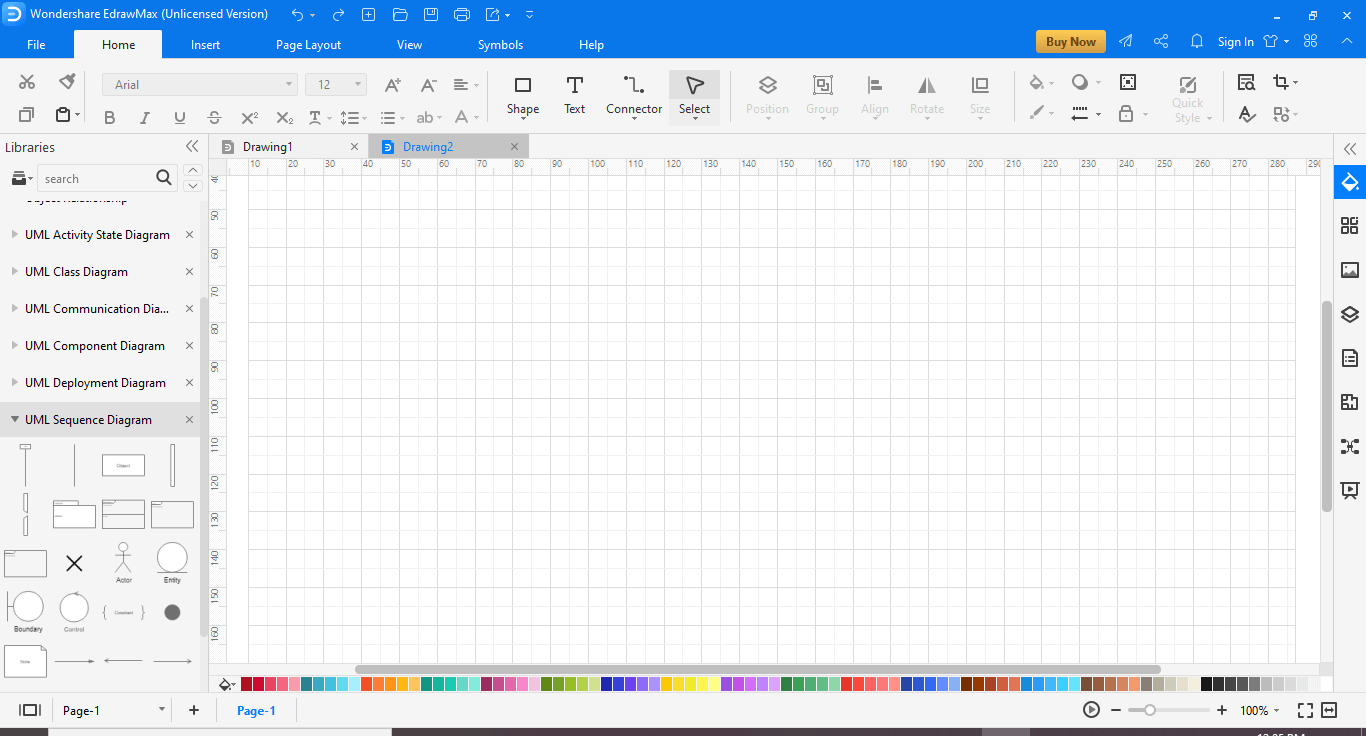
If you want to draw your diagram from scratch and go on with your own creativity, then click the [+] sign. You will see an empty canvas, and you can use the symbols and shapes available on the left-hand pane to create your timing diagram. You can even import libraries in the left menu to customize your UML timing diagram.
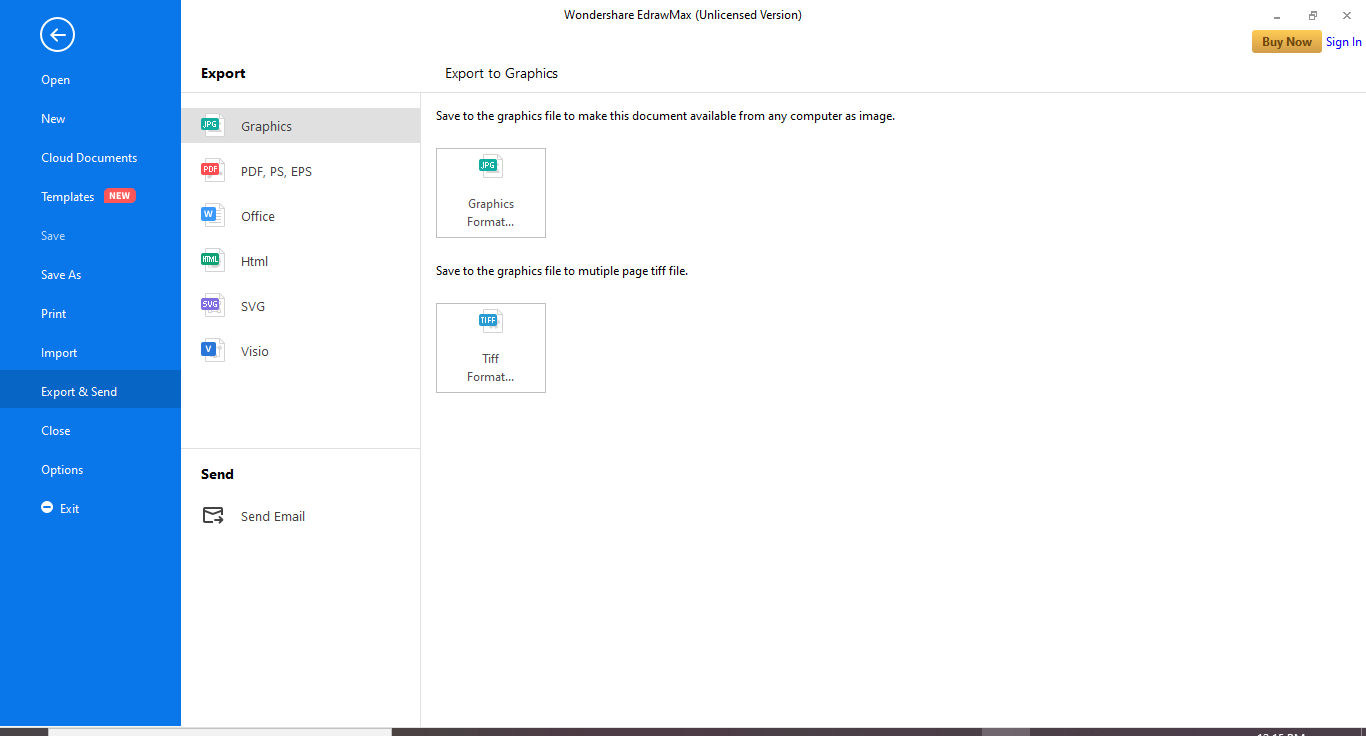
Step 4: Once finished your creation, save your diagram. You can even export the file in multiple formats, e.g., Graphics, PDF, editable MS Office file, SVG, and Visio VDX file.
Step 5: Another fantastic feature of EdrawMax is that you can also share your diagrams through social media and web pages. You can even publish your UML timing diagram in the EdrawMax template gallery to show your work to others.

・ Simple alternative to Visio
・ 26k+ symbols
・ 10K+ free templates
・ 10+ AI diagram generators
The timing diagram captures every change occurring in the system. Therefore, a detailed analysis of the system is a prerequisite for a correct and effective timing diagram. Apart from that, some tips for drawing timing diagrams are.
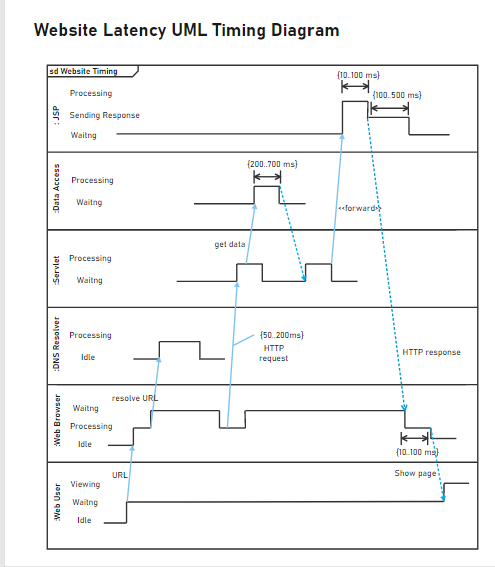
This is an example of a website latency diagram. It has different objects, including web user, web browser, DNS resolver, servlet, data access, and JSP. The detailed timing diagram shows the change in the state of different objects and clearly shows the complete life cycle of the system.