Spider Web Chart - A Dynamic Tool for Data Analysis
Part 1: What is a Spider Web Chart
1. Drag a model from the model library.
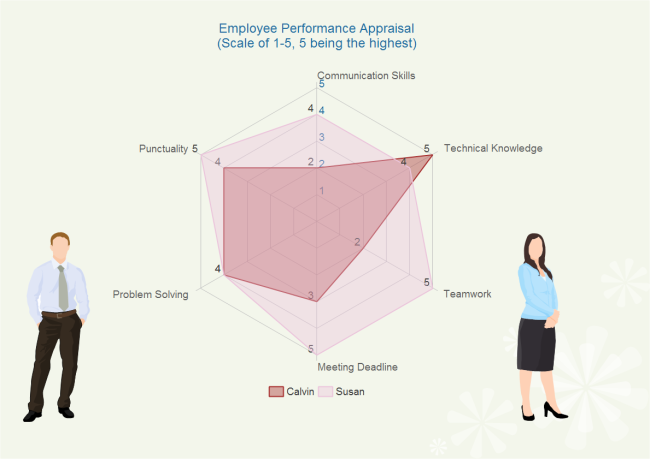
Spider Web Chart, also called radar chart, a graphical method to represent multivariate data in the form of a two-dimensional chart of three or more quantitative variables. It is useful for rating an item or items along 3 or more axes, e.g. the cost, quality of faculty, campus facilities, and student life for three different colleges.
Part 2: Benefits of Using Spider Web Charts
Following are benefinits of using spider web charts.
- Make concentrations of strengths and deficiencies visible.
- Clearly display the important categories.
- Define full performance in each category.
- Offer vivid and visual description.
Part 3: How to Create A Spider Web Chart
EdrawMax should be what you need to draw a spider web chart. Its various built-in templates and examples would help you a lot.

An all-in-one platform for 210+ diagrams.
・ Simple alternative to Visio
・ 26k+ symbols
・ 10K+ free templates
・ 10+ AI diagram generators


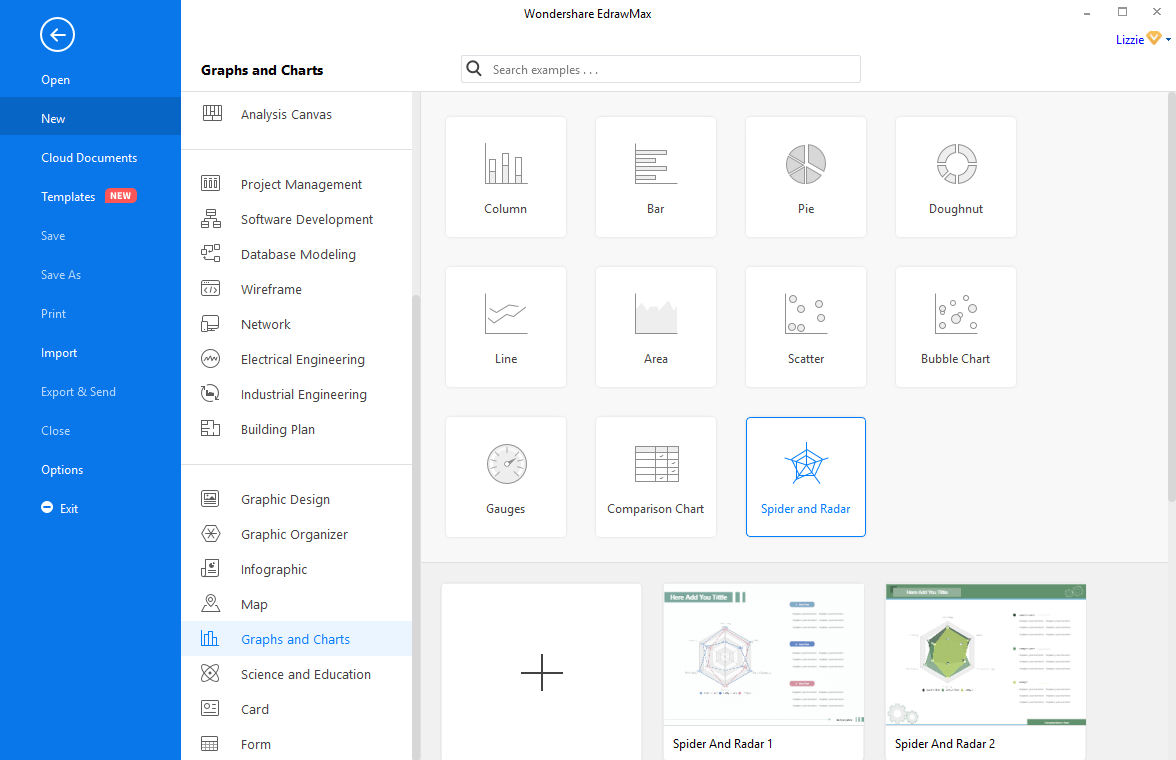
1: open a spider web chart template
Navigate to [New] > [Graphs and Charts], and then double-click the icon of Spider and Radar to open a drawing page for creating a spider web chart.
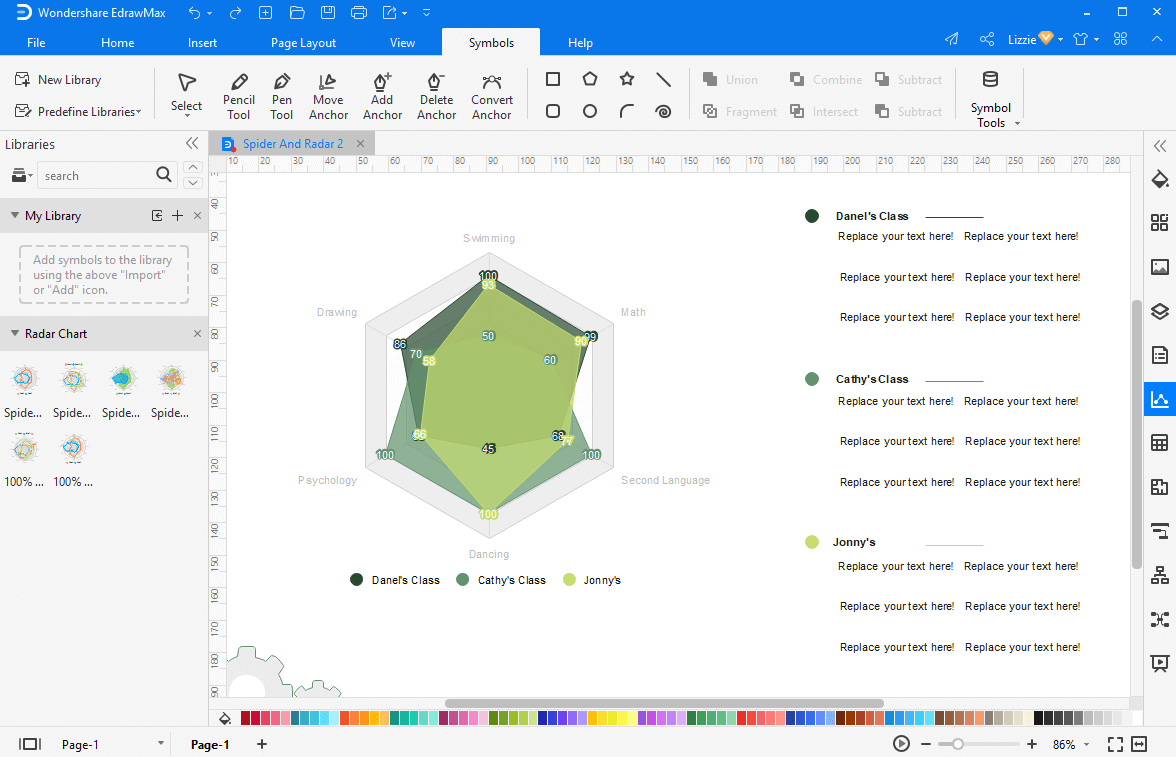
2: add chart shapes to the spider diagram
Select a spider shape you like from the symbol library. Drag and drop
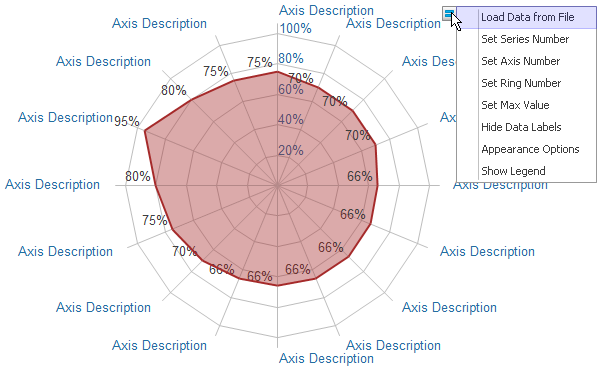
3: clicks on the floating action button and enter the data
Point to the floating button, a window will appear, just choose the item you need to add such as series number, ring number, max value and so on.
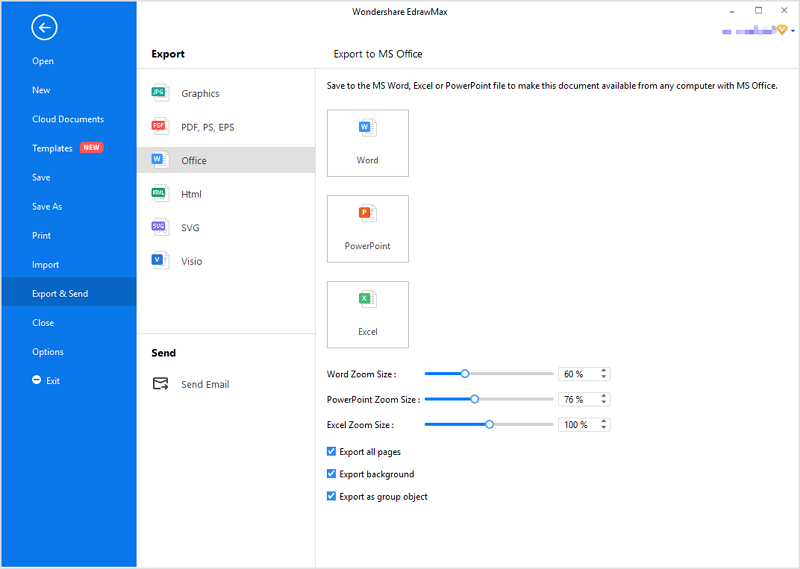
4: save or export completed spider web chart
When you finish the spider web chart, go to Export & Send under File to export the file as other formats such as ppt, word, jpg, vsdx, pdf, etc.
Related Articles


