What is a Phylogenetic Tree?
Know it All about Phylogenetic Trees
A phylogenetic tree (commonly known as an evolutionary tree or a phylogeny) is a diagram with branches that displays the evolutionary relationships between different biological species.

Source: khanacademy.org
Since a phylogenetic tree is known as the "tree of life," it's an upgraded understanding of an old conception that says that life progresses from lower to higher tiers like a ladder, referring to it be like the Great Chain of Being. Early perceptions, outlines, and sketches represent a branching phylogenetic tree comprising a paleontological chart. This primarily indicated the geological associations and correlations between plants and animals.
A simple phylogenetic tree contains several parts that are mentioned below:
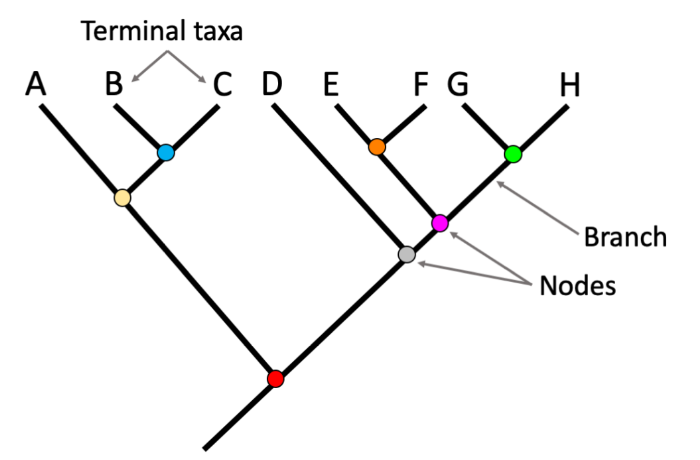
The Taxa is known as the "tips" of the tree branches or the study being conducted. You can find the “Taxa” at any systematic level indicating the species, orders, or population. In addition to this, this "Taxa" is called "OTUs," which is abbreviated as "Operational Taxonomic Units."
The systematic and/or extending lines from a tree are known as its branches representing the interconnection between one or more objects.
The tips of these branches or the point where all these branches are joined together are known as "nodes." Within the nodes, there are two types that are "Internal" and "External" nodes. Internal Nodes are supposed to connect branches, whereas the External Nodes are the angles that join the Taxa together.
Furthermore, a few trees have a basal node known as the "root" of the tree. Then here comes the "Clade," commonly known as the "ancestor" of all the species branching out.
Like every systematic model, a phylogenetic tree paradigm has some strengths and limitations which are mentioned below.
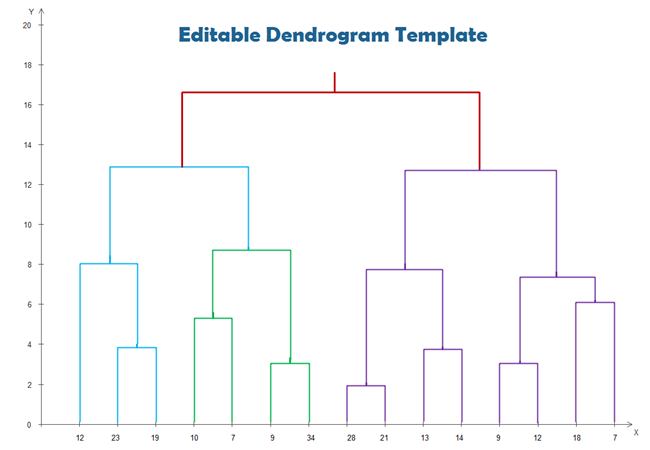
A tree is generally known as the Dendrogram. It is not necessarily a Phylogenetic tree and is used to represent and demonstrate something diagrammatically.
A Chronogram is a type of Phylogenetic tree that represents time via the length of its branches.
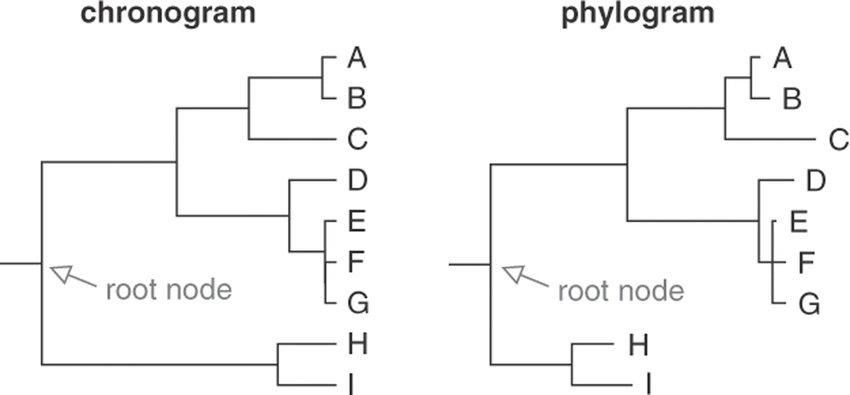
As its name implies, a Phylogram is a Phylogenetic tree whose branch length is proportional to the amount of change in the character.
This type of phylogenetic tree is known to demonstrate a branching pattern only. It means that its branches lack the representation of the time of change in character. Also, its internal nodes do not represent its ancestors.
This type of Phylogenetic tree demonstrates the cross-section.
A phylogenetic network does not look like a tree, and it is rather a generic diagram or graph. It is primarily used for overcoming the drawbacks or limitations fundamental to trees.
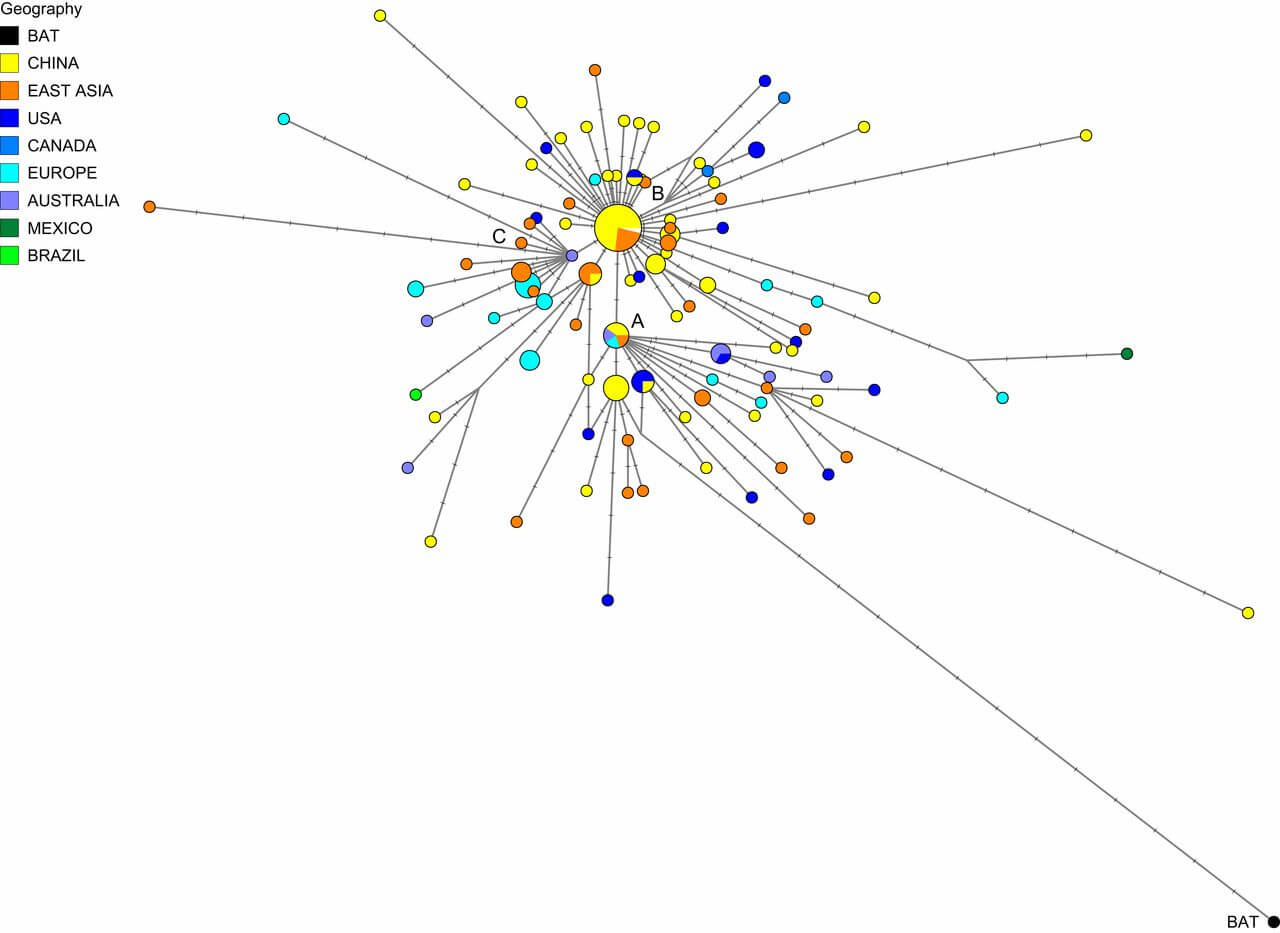
Source: pnas.org
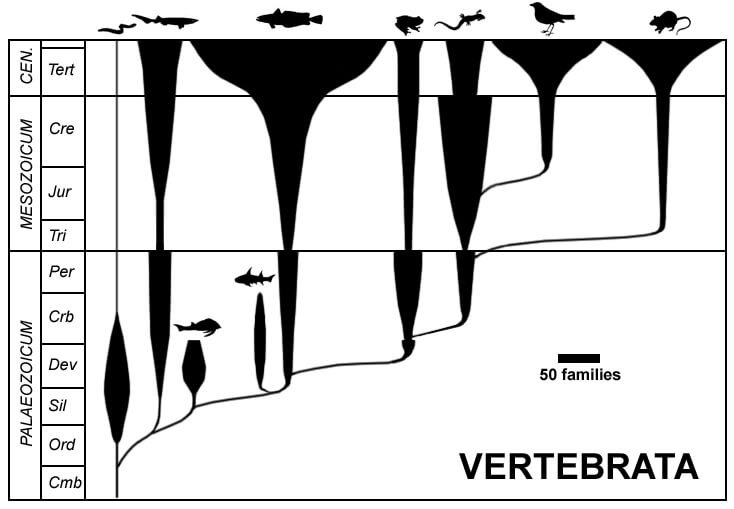
A Spindle Diagram is also known as a Bubble Diagram used to represent taxonomic diversity against geological time. This reflects the variation of the profusion of several taxonomic categories through time.
| Phylogeny | Evolutionary Tree | Phylogenetic Tree | Cladogram |
|---|---|---|---|
| A phylogeny is a branch of Biology that specially deals with Phylogenesis. | An evolutionary tree is a visual demonstration of the evolution of species from its point of origin. | A phylogenetic tree is a diagrammatic representation of the development of biological species. | It is a branching representation that portrays a cladistic relationship between all kinds of species. |
Reading a Phylogenetic tree is the same as reading some family trees. However, we will let you know how to read a Phylogenetic tree step by step.
The root of the tree means the common ancestor from which all species have been developed. And the tip means the group of species (a part of the common ancestry).
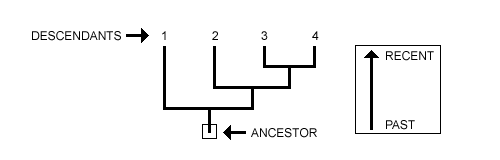
Step two is to determine the daughter lineages that come from the common ancestry. It splits up into two or more branches creating a line of distinction between one or more species.

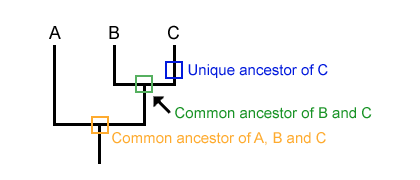
The third step is to see if there are any shared ancestry lineages between a group of species. See points B and C in the figure below. Point B and C have unique histories, unlike Point A.
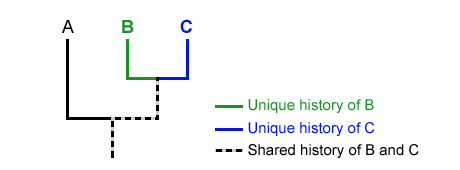
See the below figure, and now you should be able to read it as a whole. The orange color shows that there is a common ancestor of Points A, B, and C. However, the Green color shows that B and C have one different yet common ancestor, and the same goes for Point C.
You can build a Phylogenetic tree following the below-mentioned steps.
The first step is to identify the most different species. Note that it will be having the most mutational differences from other species with the highest number.
The next step is to look for the following most different species that share a common ancestor with the previous species. Let's call it A.
Start drawing a common line and extend its branches to show a possible common ancestor A of the branches B and C.
Look for the other organism’s characteristics and see the most characteristically similar organism for that specific gene.
Follow the same method and start adding remaining organisms by looking at the rows and columns and finding genetically identical organisms.
For your understanding, here we have examples of Human Phylogenetic trees and Animal Phylogenetic trees.
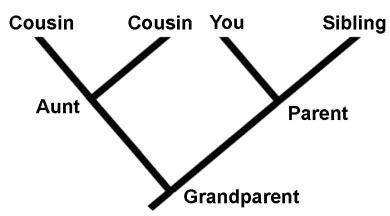
As you can see in the diagram, every species or individual (in this case) has a common ancestor, and that is your grandparent. Then it splits up into two branches: your parent and your aunt (sibling of your parent). And then you, your sibling, and your cousins have a unique history because you were born from different parents yet have the same and common ancestor as your grandparent.
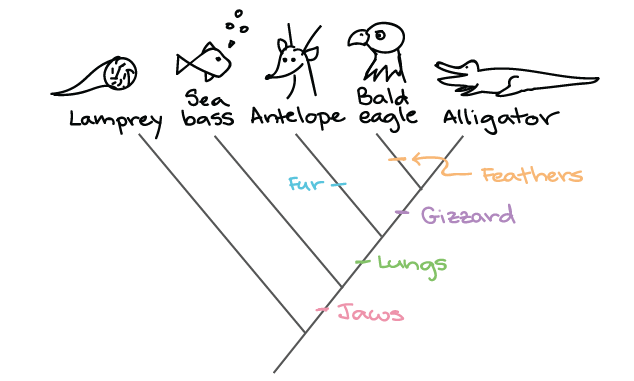
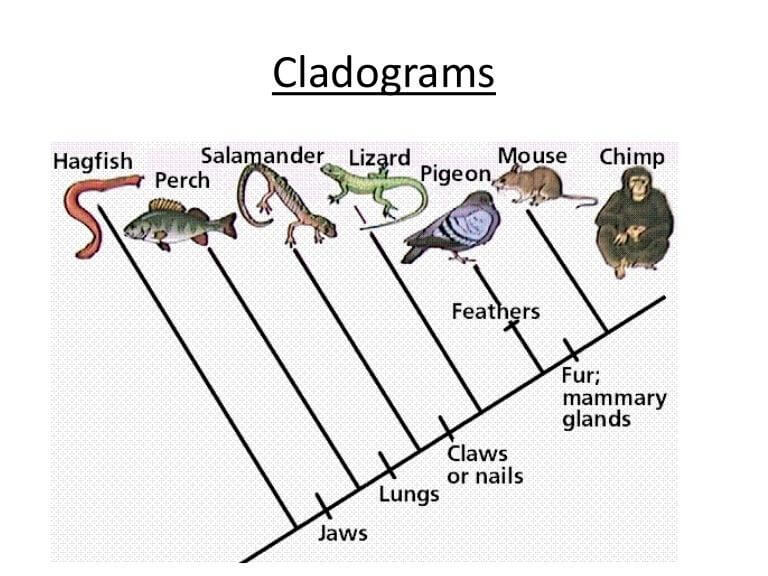
As you can see in the diagram, all animals have the same common ancestor, but they are divided because of their different characteristics. These characteristics are jaws, lungs, gizzards, and feathers. Thus, these characteristics differentiate between the animals mentioned in the diagram that nevertheless have the same ancestor.
All in all, the Phylogenetic tree could be used to display the relationship between other objects as well that is primarily based upon the similarities and differences in their characteristics, and that indicates that all species, objects, individuals, and units have been rooted in a common ancestry. The tree could be drawn in different ways, and this can be virtual or even physical.
However, for simulating the Phylogenetic tree diagram virtually, the best user-friendly software is EdrawMax that helps you create 2D diagrams, flow charts, Gantt charts, and all kinds of Phylogenetic trees and models.

