Bubble Map
Part 1: What is a Bubble Map
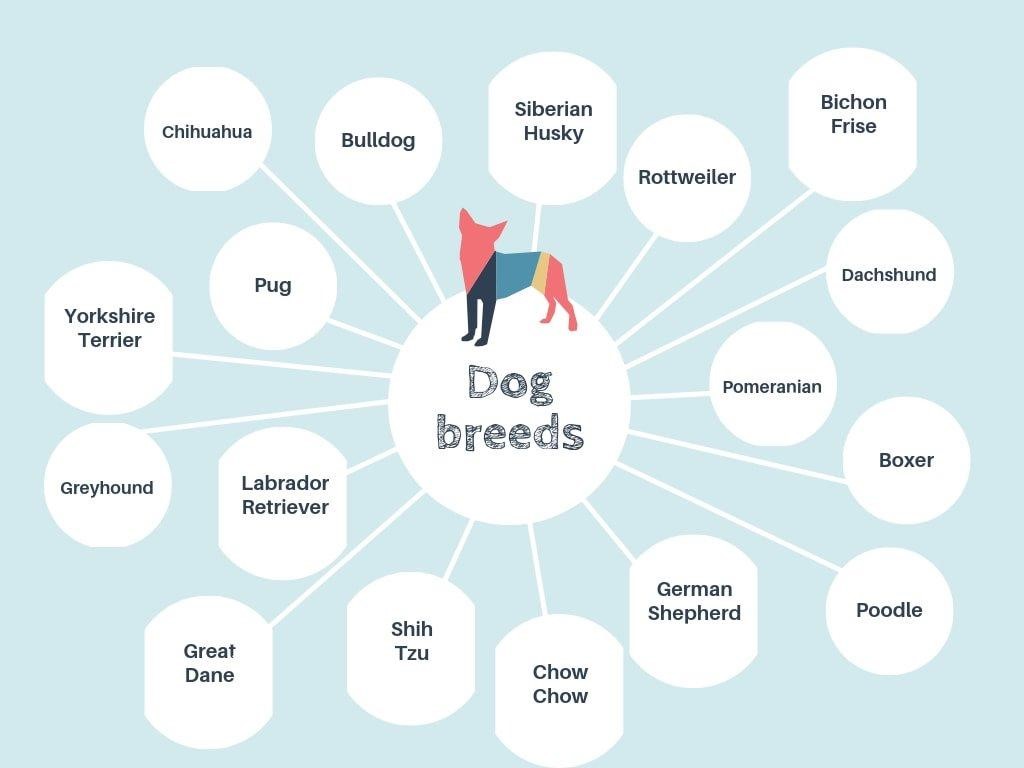
Bubble maps are diagrams and illustrations representing information on any topic in the form of a map. It is usually used to describe or define various topics in suitable adjectives and phrases. The main keyword or the title is written in the center of the bubble map inside a large bubble while its related information is written in smaller-sized bubbles in the surroundings.
A bubble map looks very similar to a spider web or a cluster map. However, one key difference among the three is that a bubble map only focuses on defining the central topic at hand; there can only be the definitions of one topic in one bubble map.
Moreover, these types of thinking maps trigger your critical thinking abilities since it asks students and even professionals to evaluate and describe the topic at hand using just adjectives.
Part 2: Usage of the Bubble Maps
● Using for fiction:
You can pick a character from any fictional movie, book or novel and perform an analysis on them by listing down their attributes using words that would perfectly describe them.
● Using in school for science:
Teachers can encourage their students to use the bubble map to help better understand a difficult chapter. Since there are uncountable topics in science – physics, chemistry, biology, psychology, psychiatry, etc. - there can be uncountable uses for bubble maps. Students can use it to map out the stages of human development such as the stages of infants, toddlers, to children and then adults.
● Using it to understand an abstract concept:
In the same way that students can use bubble maps for different courses at school, they can use a bubble map to show and write what they feel when looking at something vague. For example, the color “red” as the topic can encourage the students to write whatever comes to their mind when they see the word. This could include apples, cars, blocks, ladybirds, a favorite shirt, etc.
● Using it to understand roles:
In addition to bubble maps being very common at an educational level, it is also used by professionals in the working industry. Businesses and bosses use a title such as “Assistant Manager” in the middle of the map and map out all the duties and roles of what that person would be assigned to do.
This helps define the scope of work for a newly hired employee and lets them know what is demanded of them on a daily basis.
Part 3: Benefits and Limitations
According to Dr. Hyerle, Bubble Maps can be reflective, integrative, flexible, consistent and developmental for both individuals and groups that use them regularly. More benefits could include the triggering of critical thinking abilities of individuals that rather stays shut most of the time.
Bubble maps also benefit students because it allows them to become independent and think on their own. They write whatever comes to mind and create an image for themselves according to their point of view, which helps them remember the little details of a topic. Bubble maps are also appropriate for all age levels and encourage cross-disciplinary freedom.
On the other hand, there are a few limitations of the bubble map as well. Because of the small size of circles in these diagrams, it can get difficult to fully explain a point related to the topic. Moreover, since the points are concise, it can be a bit harder for someone else to understand without knowing the context first. You cannot display a huge amount of data and you are limited by the number of bubbles you can fit in one map.
Bubble Map vs Cluster Map
Both bubble maps and cluster maps are practically the same thing. In this case, “bubbles” and “clusters” can be taken as synonyms.
While a bubble map, as previously mentioned in this post, is more specifically used in terms of describing a topic with adjectives, a cluster map is generally used in any aspect. A cluster map is used to brainstorm ideas on a topic. It offers you the chance to understand different aspects of a topic within a slight glance. You can narrow down a broad topic into particular subtopics.
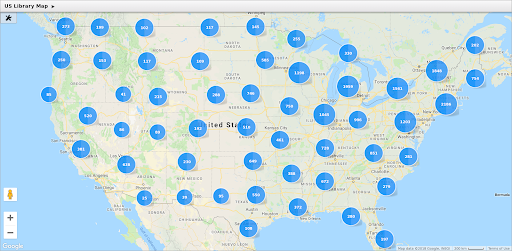
A cluster corresponds to the number of data present in a region and hence, a cluster map shows clusters throughout a region wherever the specifications are satisfied.
Now that you know what Bubble Maps and Cluster Maps are, coming back to the post’s topic, here’s how to easily make a bubble map.
Part 4: How to Create a Bubble Map
The best way to create a bubble map quickly and conveniently is to use a software on your computer. Creating one by hand on a piece of paper is a tedious task, and if you’re someone who needs to create these on a regular basis, you’re better off with a user-friendly software. On the same note, we believe EdrawMax is the best one for this task.
The software by Wondershare is pretty straightforward and comes with tools and features you might not find on other competing softwares. Additionally, EdrawMax also offers users plenty of pre-drawn templates of almost any niche available. Whether it be bubble maps, cluster maps, engineering diagrams or simple flowcharts, you’ll find templates that you can use to boost productivity.
1、From the blue menu on the left pane, go to New > Mind Map > and select Bubble Diagram.
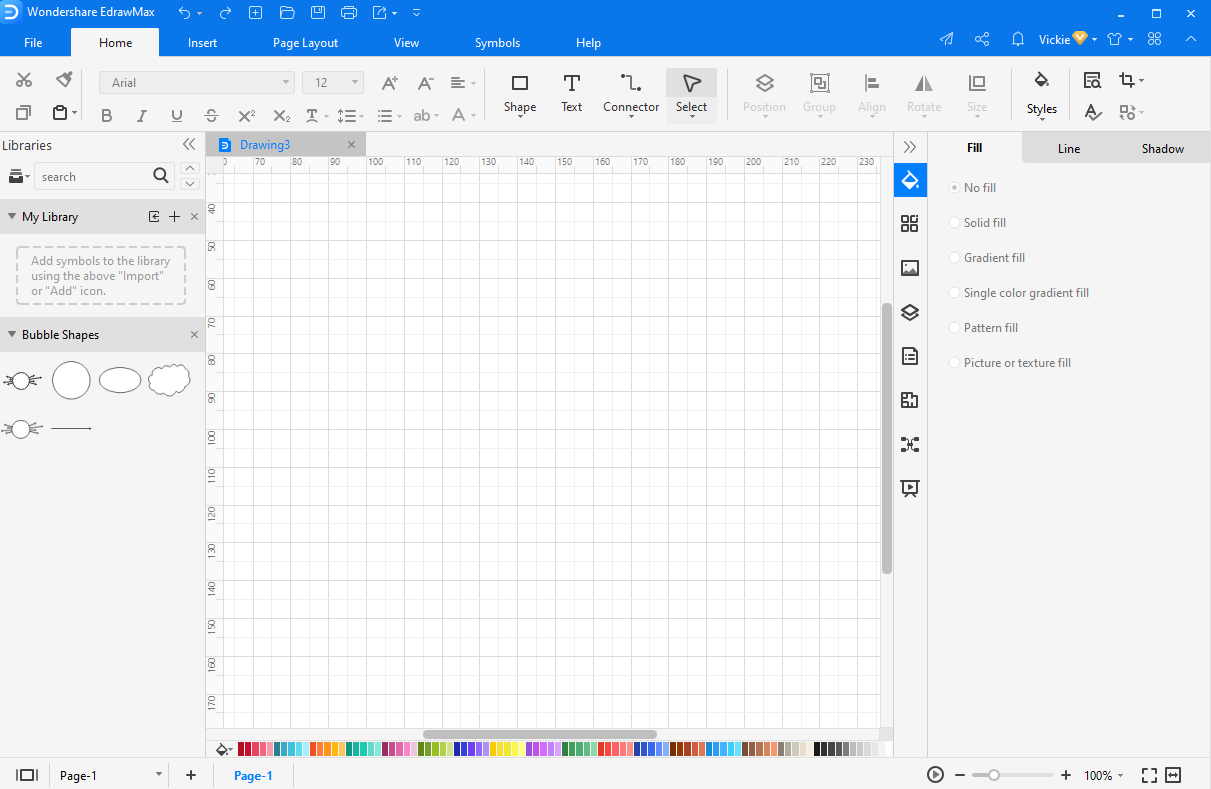
2、From here, you can click on the “+” sign to open up a drawing page.On this screen, you can start drawing bubble maps as you wish.
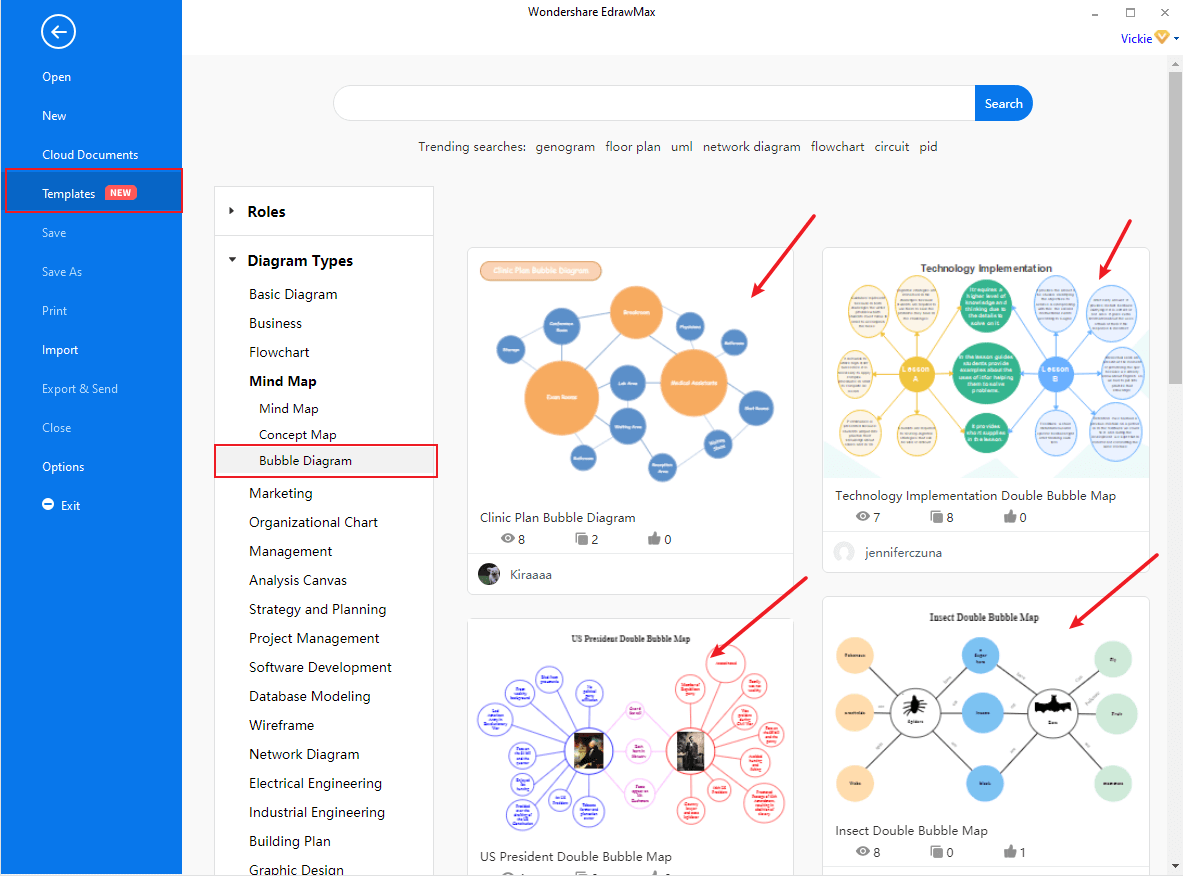
3、On the other hand, if you want to access the templates and edit them as we briefly mentioned earlier, go to the Templates tab from the main menu.
4、Look for the Bubble Diagrams under the Mind Map submenu. From the list of templates, pick the one you find closest to your project and edit it according to your situation.

An all-in-one platform for 210+ diagrams.
・ Simple alternative to Visio
・ 26k+ symbols
・ 10K+ free templates
・ 10+ AI diagram generators


Part 5: Example of Bubble Maps
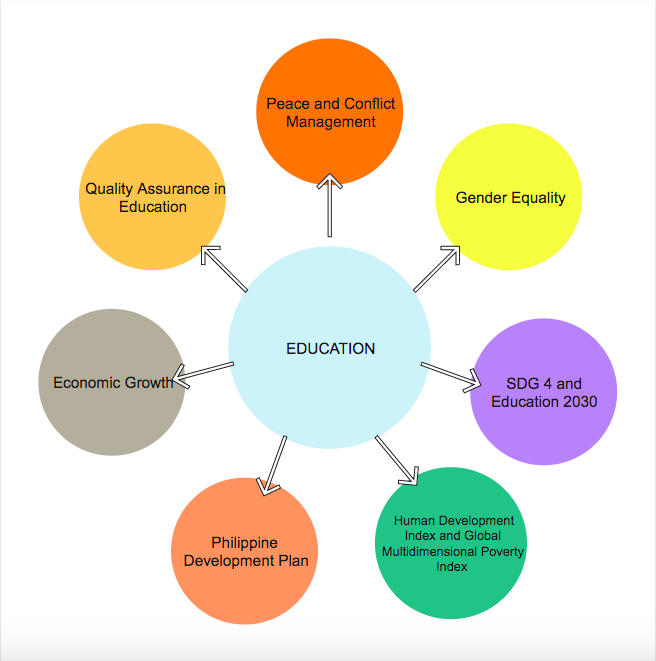
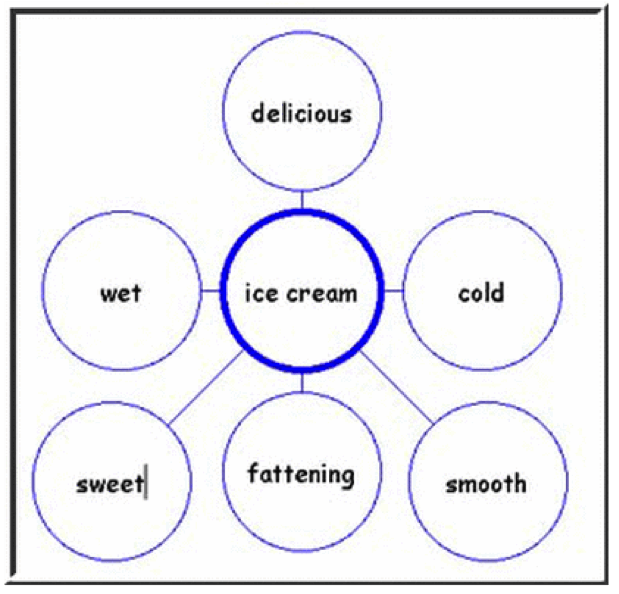
This is one example of bubble maps available on EdrawMax. As you can see, the main topic is in the middle of the diagram with adjectives and related aspects on the topics inside bubbles surrounding the main bubble.
Part 6: Conclusion
The article briefly discussed Bubble Maps – what they are, why they are used, their benefits and how you can draw them on a software on your computer. Because of EdrawMax’s simplicity and help in enhancing productivity for users, we believe this may be better than other applications on the market.
The availability of numerous templates and the tools and symbols available on EdrawMax has got many professionals and teachers shifting towards the software. One of the best things about it is that you can use it online as well; you don’t need to download the application onto your computer to use it. Visit EdrawMax now and take advantage of this application.

