Affinity Diagram - A Six Sigma Tool for Prioritizing Ideas
What is Affinity Diagram?
Affinity diagram, one step of the Six Sigma method, is originally developed by Japanese anthropologist Kawakita Jiro in the 1960s. It is used to organize unstructured ideas and information and link up to form thinking model. Not only do affinity diagrams generate ideas, but ideas will be organized into groups for further analysis. Affinity Diagrams are widely utilized in the fields like business analysis, project management, scholar research, and product management etc.

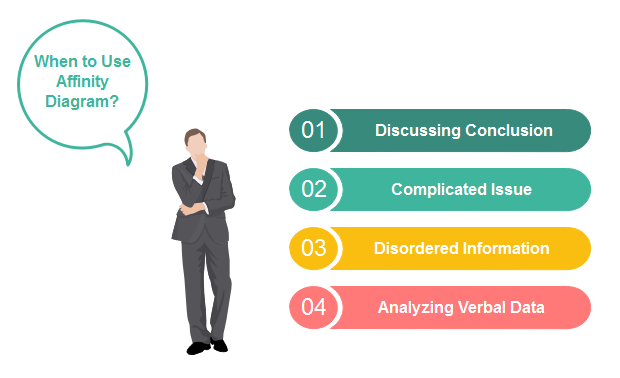
When to Use Affinity Diagram?
- Group agreement for a discussing conclusion
- A complicated issue with copious divisions
- Plenty of disordered information and data
- After analyzing verbal data

How to Prioritize Ideas by Affinity Diagram?
1. Explore Your Mind
The basic element for prioritizing ideas under affinity diagram is ideas, and whether the ideas are comprehensive or not should be confirmed in advance. At that time, exploring the mind and even brainstorming might contribute to abundant ideas. Digging your mind deeply will promote exploring mind.
2. Collect and record ideas
After the end of thinking and exploring process, the most significant task comes that you need to list all the ideas but not to mind the order. In addition, you should collect ideas from other channels to expand the topic ideas, like searching archives, discussing with your mates, and interview experts etc. All these lead to a systematic analysis of the issue.
3. Refine some keywords as categories
When you record ideas, you must have a general overview of what you collect. So it is easy to come to this process which you need to refine keywords as categories. If categories are fixed, the structure of the diagram is formed.
4. Merge recorded ideas into each category
This step is to integrate those ideas put forward in the first stage as many information and ideas might have the same meaning. After deleting all the repetitive ideas, you should place the rest of ideas into their belonging categories.
5. Combine groups into supergroup with a corresponding subject
As each category or group has its own idea branches, this step is to bring each confirmed category together into a combination and name the whole diagram with a relevant and corresponding subject so as to describe the common theme of that supergroup.
6. Analyze and Prioritize
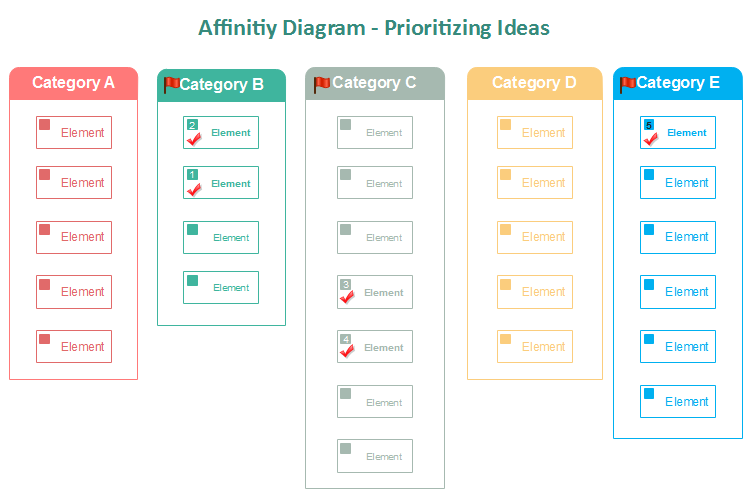
The last step of designing an affinity diagram is to analyze and prioritize groups of ideas. Although you have already finished the affinity diagram to some extent, you still need to set priorities for them by analyzing three main important and urgent groups, voting for the most important group, and ranking main focuses with labels to highlight.
The results of affinity diagram in prioritizing ideas absolutely rely on sourcing ideas and integrating them into an affinity diagram in a logical order. An affinity diagram is a valuable prioritizing tool under Six Sigma method.
Affinity Diagram Templates
Below are affinity diagram templates you can download and use. The templates are fully editable so that you can change the color, size, and layout to fit your own needs. Click on the images you can download the templates and use instantly.
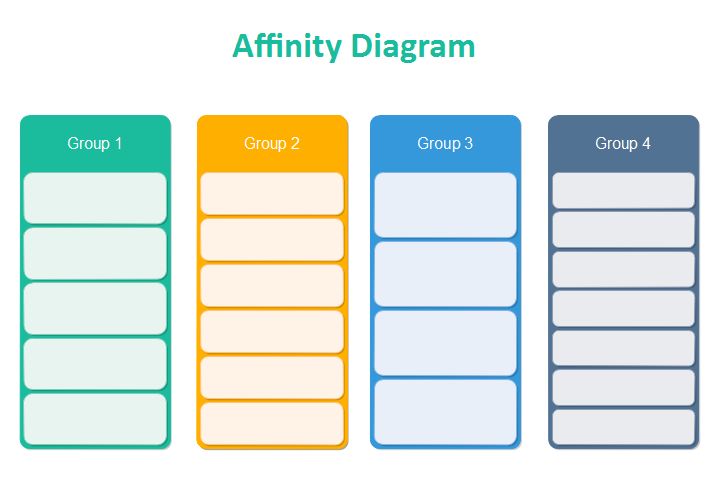
Affinity Diagram - List Style
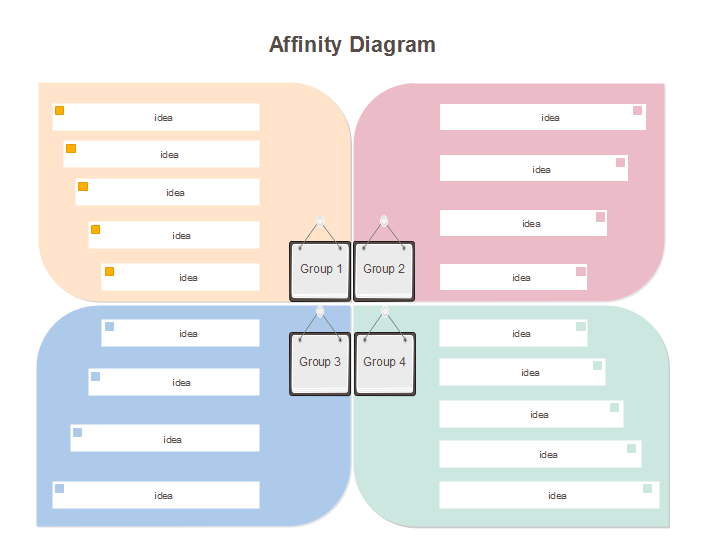
Affinity Diagram - Matrix Style
More Related
How to Create an Affinity Diagram?


