Math Diagrams: Math Solving and Illustrations Made Easier

What is a Math Diagram?
Math diagrams make it easier for academics and professionals to convey some form of mathematical relationship. These illustrations can be related to algorithms, velocity, mass, simple comparisons, and even timelines. Students move from a verbal presentation to a visual form, one which is later easier to explain.
This visual representation helps students with presentations, analysis, deciphering, and interpretation. Though software used in Microsoft and Linux can help create graphical and mathematical representations, the effects are not the same. Students and professionals alike tend to look into professional software that facilitates the creation of these diagrams.
Common Types of Math Diagrams
There are basic math diagrams that most academics will encounter in high school. Others offer calculations and illustration possibilities for more advanced career levels. The creation of these complex diagrams requires a sophisticated math diagram maker like Edraw. The software can run on Windows, Mac OS X, and Linux, which are the most commonly used operating systems by students.
A sample of the mathematical diagrams this software helps create is listed below.
1. Argand Diagram
Complex numbers can be plotted as a set of numbers forming a vector, which translates to easier plotting of poles of a given function. Horizontal axes represent real parts, while vertical ones cover the complex bits.
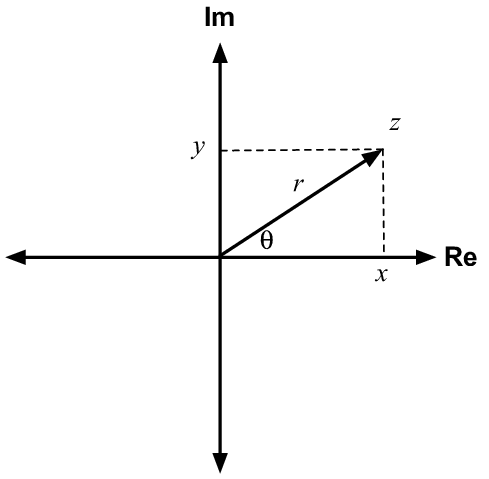
Image Source: researchgate.net
2. Commutative Diagrams
A set of maps whereby all map formations beginning from an equivalent set A, concluding with the same set B, produce the same results. Essentially, all paths in this diagram with the same beginning and endpoint will come to the same result.
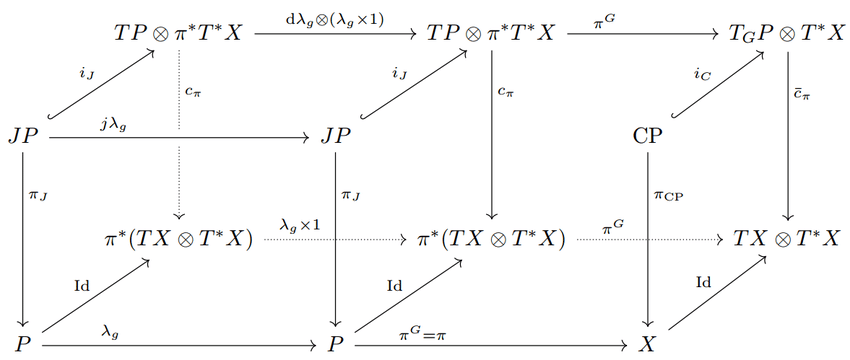
Image Source: researchgate.net
3. Hasse Diagrams
Representation of a finite not-fully ordered set, displayed in the form of a drawing related to its lesser, transitive reduction. This is possible because a partial order is deemed a binary relation.
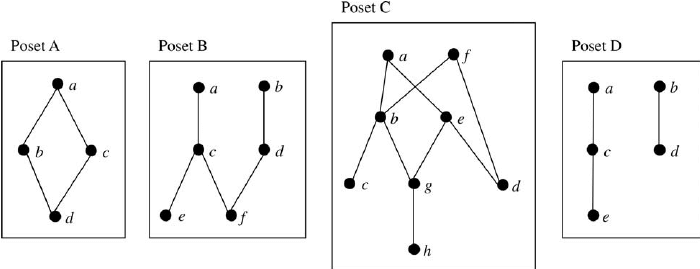
Image Source: researchgate.net
4. Petri Nets
The Petri Net is a type of graph in which the nodes graphically represent an event occurring and conditions illustrated in the form of circles. The directed curves illustrate conditions before or after a certain condition.
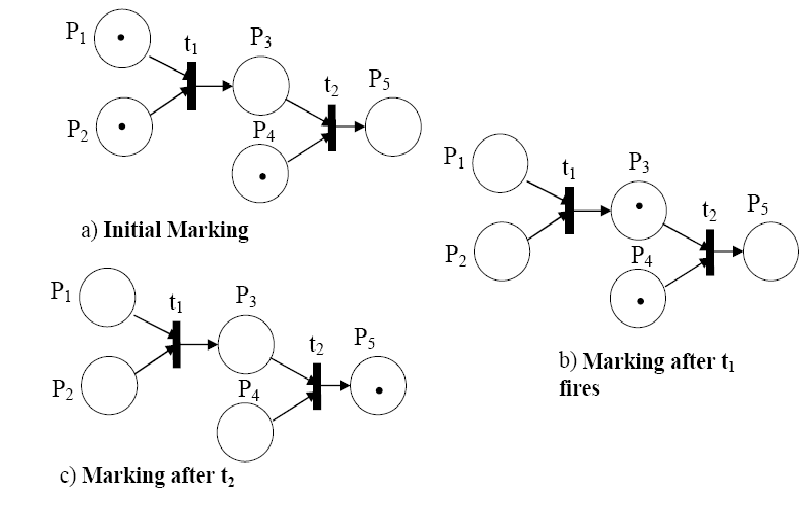
Image Source: researchgate.net
5. Voronoi Diagram
Points are placed in a plane with an equal amount of cells, in that every point, in this case, p, is within a cell with regions closer to p, than they are in relation to any other point.
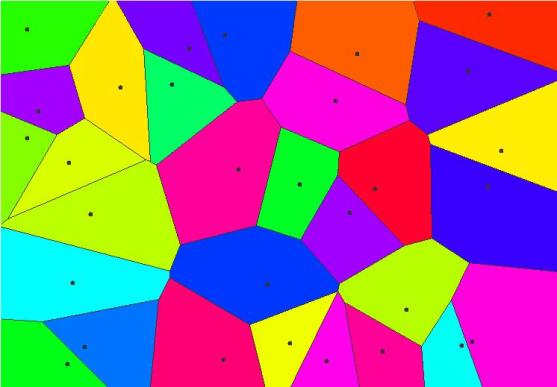
Image Source: thatsmaths.com
6. Venn Diagram
An illustration with overlapping circles which show the relationship between objects, or a finite amount of objects. The circles can list any type of comparisons, be it mechanical characteristics, functions, or other interrelated objects. Most students use Venn diagrams in basic math classes, but they are also applied in statistics and quantitative analysis.
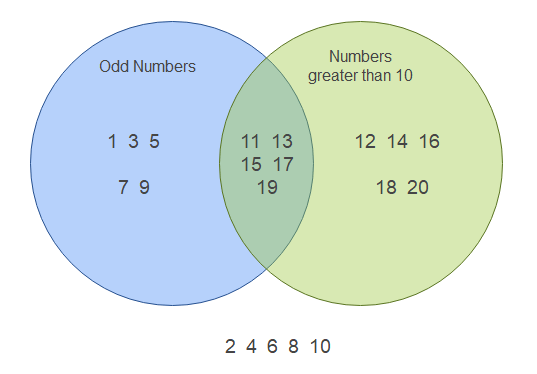
Created by Edraw
How to Create a Math Diagram
Using a math diagram maker like EdrawMax helps professionals to seamlessly create these mathematical illustrations. These creations range from organizational and business charts to engineering diagrams. The drop-down menu lists several options, including basic diagrams, flowcharts, science and education, mathematics, electrical as well as industrial engineering templates. As you can see, creating a math diagram is profoundly easier with EdrawMax.
Let’s take a look at how one can create a Venn diagram using EdrawMax.
Once the software is fully downloaded onto your computer, open the application and click on the file. From the menu, select file, and a page will appear with a flowchart, business diagram, and other options on the left. Using the search bar on top, type in Venn and you will be presented with several templates to choose from for your presentations.

Easy steps to creating a Venn diagram in EdrawMax:
- Easily change the size of the circles by pulling on the yellow bit on the edge of the circle.
- Select action icons/buttons to add circle details like number et al.
- If you double click on a box, you can edit/add text to it.
- Some Venn diagrams are available in vector formats to streamline the creation process.
- There are several options on the left glider to select from. You can add percentages, greater than or equal to signs, brackets or parenthesis and equation related symbols.
- In the unlikely event that some symbols are not listed in the library, you can add/import them from other libraries, or the net.
Examples of Math Diagrams
1. An example of a math diagram is the Hasse Diagram, with templates available on Edraw.
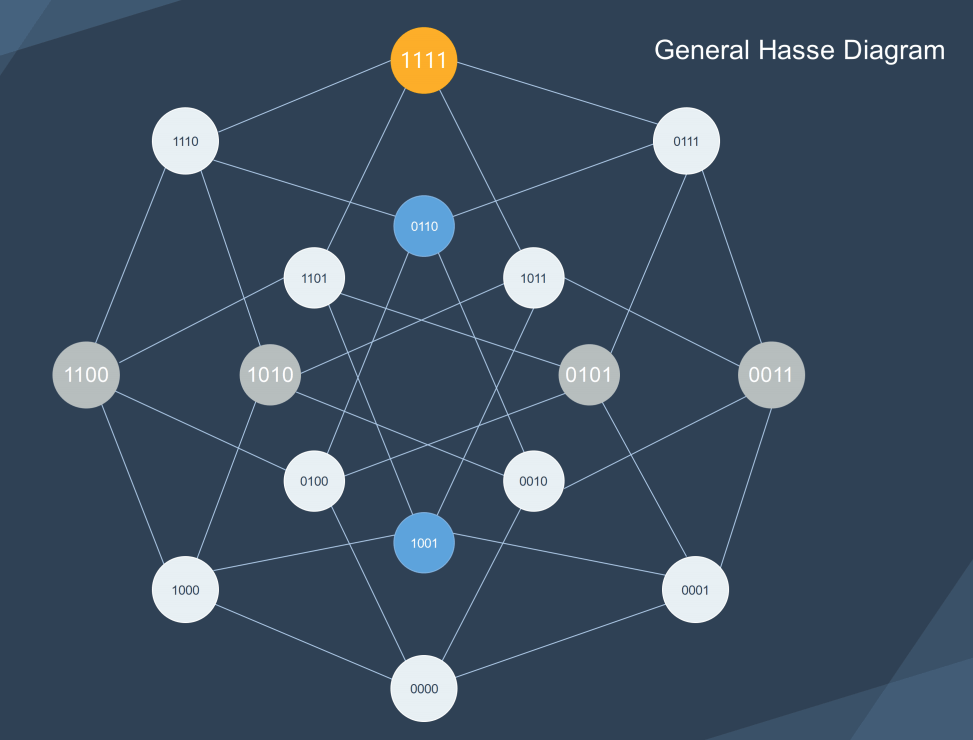
Created by Edraw
2. An example of a mathematical diagram is a Geometry Analytic Diagram.
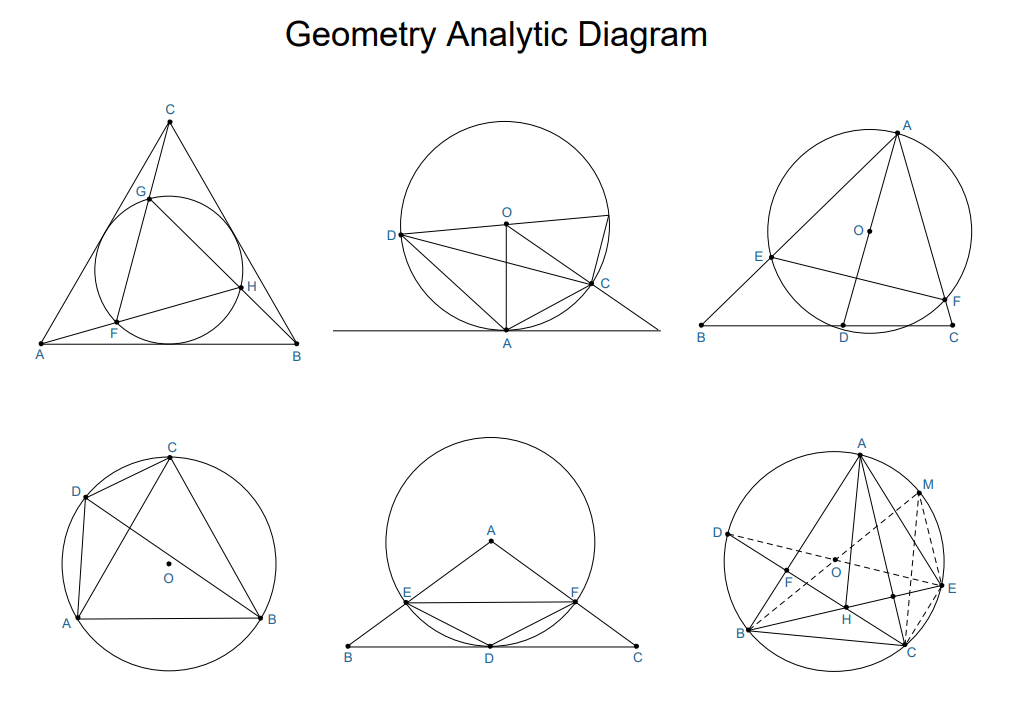
Created by Edraw
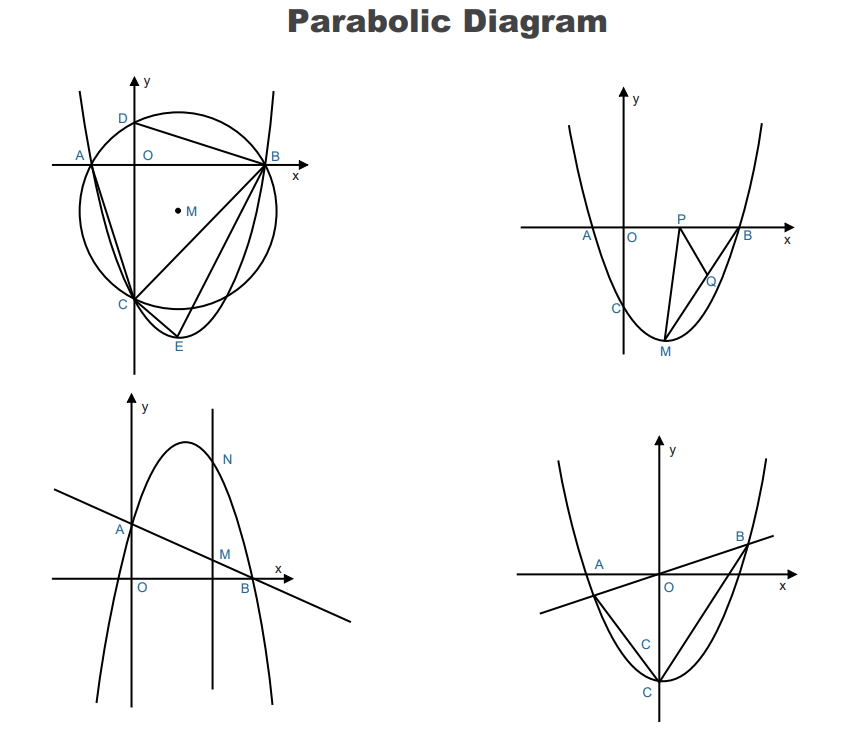
2. Another example of a mathematical diagram is a Parabolic Diagram.
Created by Edraw

An all-in-one platform for 210+ diagrams.
・ Simple alternative to Visio
・ 26k+ symbols
・ 10K+ free templates
・ 10+ AI diagram generators


Conclusion
This easy-to-use software is diversified enough to be applicable for all academic and professional presentations. There are numerous mathematical diagrams options, and even more, listed under the science section in this mathematical diagram maker. It helps students to understand concepts through illustrations better. Using EdrawMax facilitates the dissemination of information easily, especially when the audience might be lost with presentations that are too technical. Once created on Edraw, a student can easily export these presentations onto PowerPoint for a professional presentation to a class and instructors.

