Pie Charts: Carry out Data Analysis Efficiently and Effectively
Introduction to Pie Chart
A pie chart (or a circle chart) is a circular statistical graphic looking like a pie, which is divided into slices to illustrate numerical proportion. It is very useful for comparing different parts of the whole or highlighting a certain part. It helps viewers get the point at one glance clearly.
Pie charts can be used to analyze statistics for classroom teaching, business reports or presenting research results in academic essays and so on. It can serve as a capable tool to help people discover the most useful information from what otherwise may be dry or meaningless figures.
How to Use Pie Chart to Analyze Data
It is best to use pie charts when you want to show differences within groups based on one variable. For example, in order to show the significance of age on sales, you can break down the sample group into different age groups. It is important to remember that pie charts should only be used with several parts that combine to make up a whole. According to your need, you can choose different kinds of pie charts to analyze data as shown by the following table.
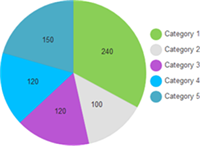
|
Simple Pie ChartUsed to compare the numbers or sizes between different parts. |
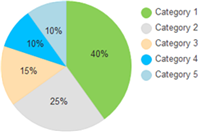
|
Percentage Pie ChartProvides comparison of different parts in percentage form. Offers proportional relationship between different parts as well as the relationship between a certain part and the whole. |
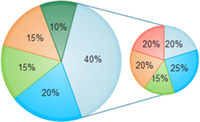
|
Multi-pie ChartOffers an overview of the whole and its integral parts. Also shows more details about one specific slice. |
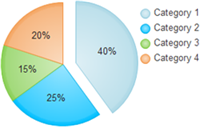
|
Exploding Pie ChartSuitable for highlighting a particular slice (usually the most important slice) by separating it from other slices. |
Make Pie Charts with Automatic Software for Data Analysis
With Edraw,youdon't have to spend tons of time drawing pie charts by hand any more. It is automatic vector-based diagramming software with comprehensive drawing and formatting functions. All basic chart types are included, with abundant pre-drawn templates with smart button which support auto generation of shapes. Download and see how amazing it is right now.
Pie Chart Templates and Samples
Create a customized Pie Chart easily from templates or samples. Enter any data, customize the chart's colors, fonts and other details, then save it or easily share it in various formats.
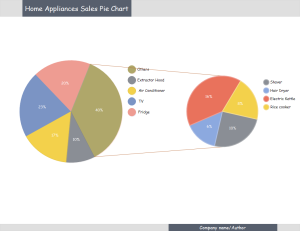
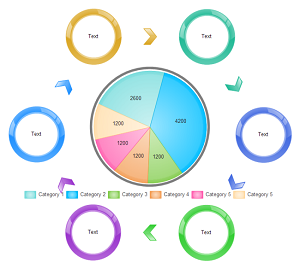
Pie Chart Example - Sales Report
Create your own unique pie chart with this handy and flexible template.
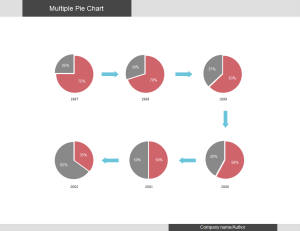
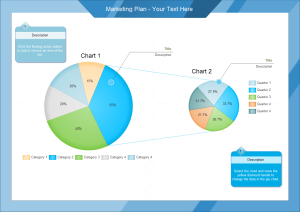
Pie Chart Example - Multiple Pie Chart
A multiple pie chart template is readily available in vector format allowing users to download and apply.
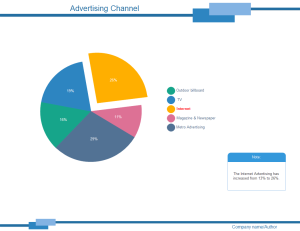
Pie Chart Example - Advertising Channel
Another pie chart example is provided with refined appearance and quality content. It's available for anyone to download and use.
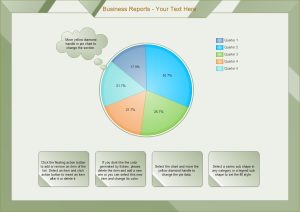
Pie Chart Example - Business Report
This ready-made pie chart template will be very practical and helpful in your business report presentations.
Pie Chart Example - Market Plan
A vector-based pie chart example is readily available for download. You will save lots of time by using this ready-made template.
Star Pie Chart Example
This nice looking pie chart template is well prepared to benefit our users. You can have a quick start using this vector file as a template.
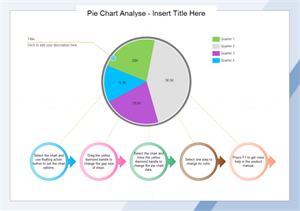
Pie Chart Example - Analysis
Nice pie chart example available to download and edit for your own use.
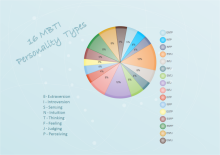
Pie Chart Example - Personality Types Pie Chart
In order to benefit our users, this template is offered for anyone to download and use freely.
Discover why Edraw is an excellent program to create pie chart. Try Edraw FREE.
Presentation Templates for Showing Data Analysis
After creating the pie charts, you can add them into beautiful presentation slides to show your analysis better. Here are some free unique presentation templates.
In Edraw, you can create more kinds of diagrams to demonstrate information visually, such as mind map, flowchart, circular diagram and matrix diagram and so forth.

