EdrawMax User Guide
EdrawMax Navigation
What is EdrawMax?
EdrawMax is a powerful, all-in-one, and yet easy-to-use diagramming tool that enables users to visualize the ideas effortlessly. With EdrawMax, you can create and customize flowcharts, Venn diagrams, mind maps, organizational charts, Gantt charts, UML diagrams, electrical drawings, genograms, building plans, etc.
EdrawMax provides beginners and pros the cutting-edge functionalities to build professional-looking diagrams easier, faster, and cheaper! It allows you to create more than 280 types of diagrams and should be an excellent Visio alternative. Powerful toolkits but super user-friendly interface make it easy for users at any level to get started.
To know more about our plans and features available, please check our pricing page and pick up the best option that fits your need. You can always reach out to Edraw Support Team at support@edrawsoft.com and our customer service center will be more than happy to help you with your choice!
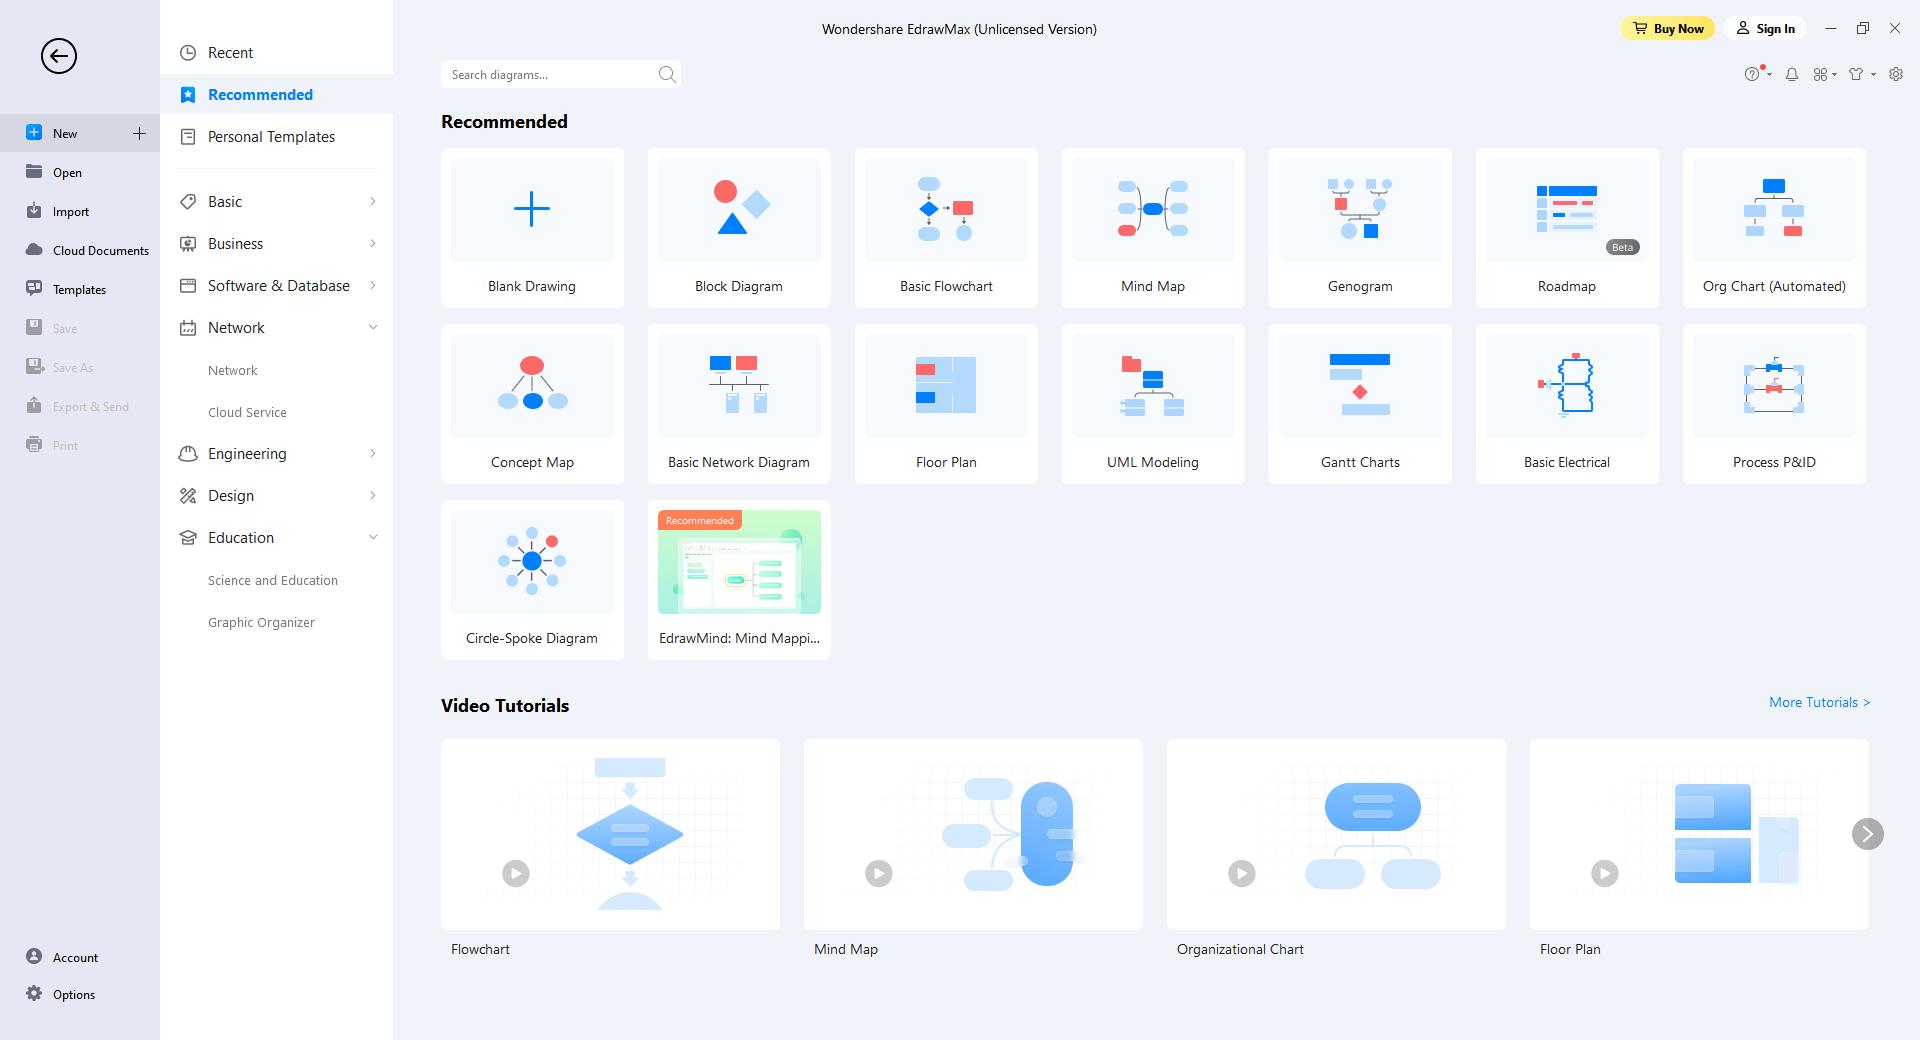
The Home Page
When you launch EdrawMax on your computer, you will be navigated to the Home page. Here you can create and manage documents, search and use templates, import Visio or other files, and modify general options of the software. This page also works as an entrance to the Edraw workspace.
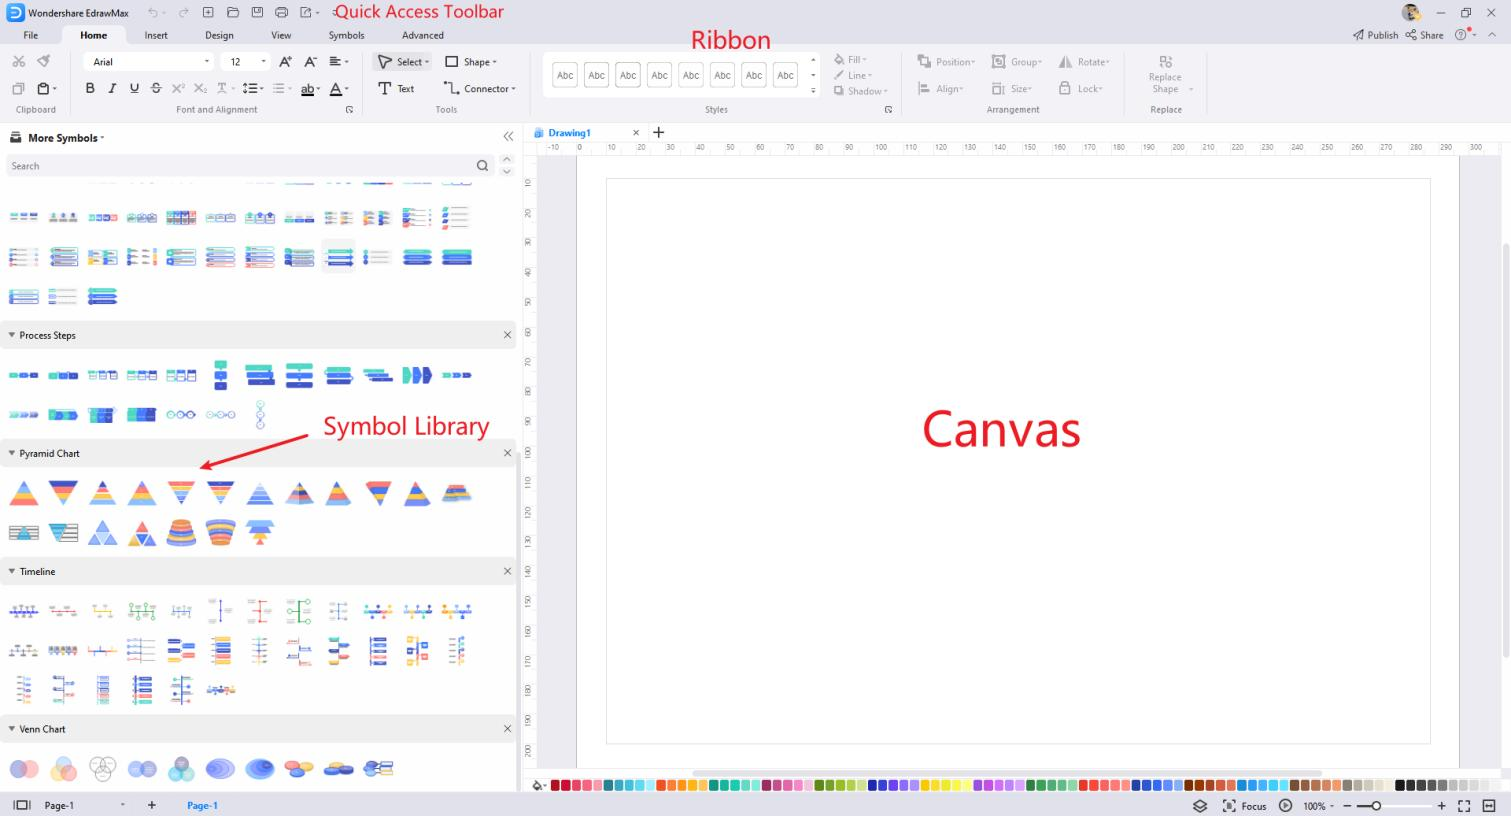
Workspace
You will see Quick Access Toolbar, Ribbon, Canvas, Context Pane, Symbol Library, and Footer on the workspace. Getting familiar with these functional areas will help you complete your designs more efficiently.
- Quick Access Toolbar: One-click access to commonly used commands such as Undo, Redo, Open, Save, Print, and Export. You can also customize this area to fit your preference.
- Ribbon: There are main toolbars where all commands and controls are organized in different tabs and groups.
- Canvas: It is the heart of the user interface where you will create your diagrams.
- Symbol Library: By default, the symbol library will show the related shapes and symbols, when you have chosen which diagram you would make in EdrawMax.
- Footer: You will find the footer underneath the canvas where you can manage documents' pages, adjust zoom level and present the canvas in full screen mode.
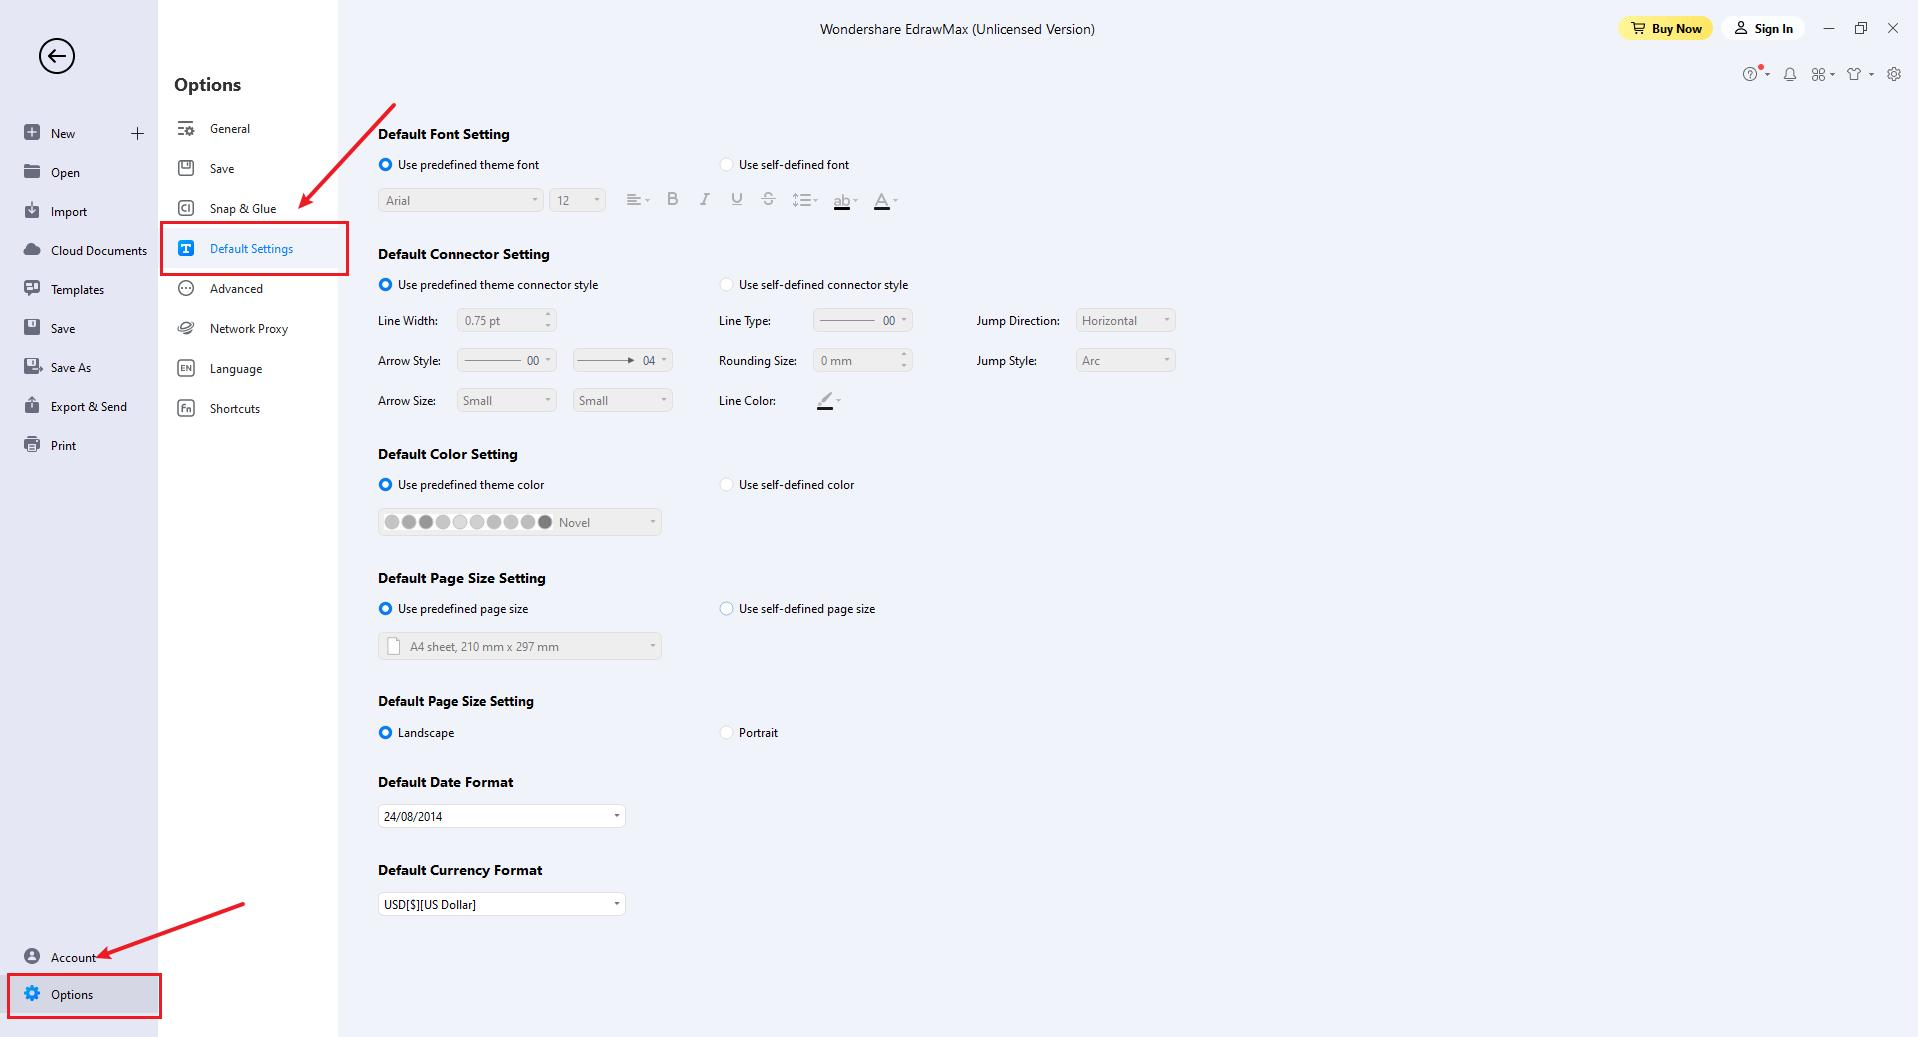
If you want to change the default settings, you can use the self-defined format settings to customize a shape's style. Now you can start diagramming simply and intuitively! Go to the File tab, click Options > Default Setting, and next, all you need to do is choose your favorite font, connector, theme color, and page size.
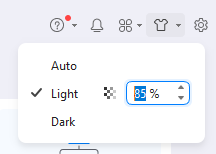
EdrawMax adds new theme colors for UI:
- For Win: Light and Dark.
- For Mac: Midnight blue and Dark.
Click the Style button in the upper right corner and choose the color you like.
System Requirements
- Windows 2000/2003/2008/Vista/7/8/10/11 (32bit/64 bit)
- macOS v10.11 to macOS v12; Work on M1 Macs
- Linux: Debian, Ubuntu, Fedora, CentOS, OpenSUSE, Mint, Knoppix, RedHat, Gentoo, and More
- Minimum 2 GB RAM and 4 GB disk space (not including the project space)
- High monitor resolution
- Mouse and keyboard
Download and Install EdrawMax
If you don't have Wondershare EdrawMax yet, click the button below to obtain your copy of the program.
Note:
A computer running Windows 11 is used here for illustrations.
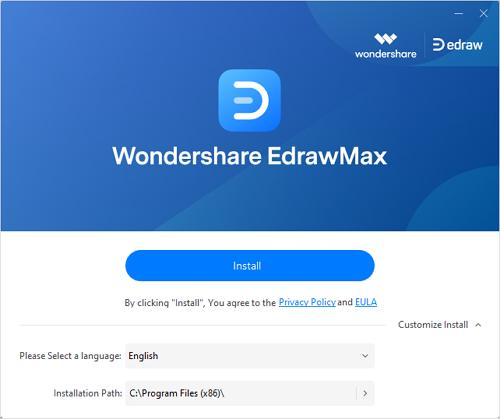
Once done, go to the Downloads folder (or to the download location if it's other than the default one), and double-click the executable file you downloaded. Click Install on the main screen and follow the instructions to install EdrawMax on your PC.
Register EdrawMax
There are a couple of ways to register your instance of EdrawMax to access all its features for better productions. It is advisable to get this done right after installing the app.
How to Register?
Method 1: From the File Screen
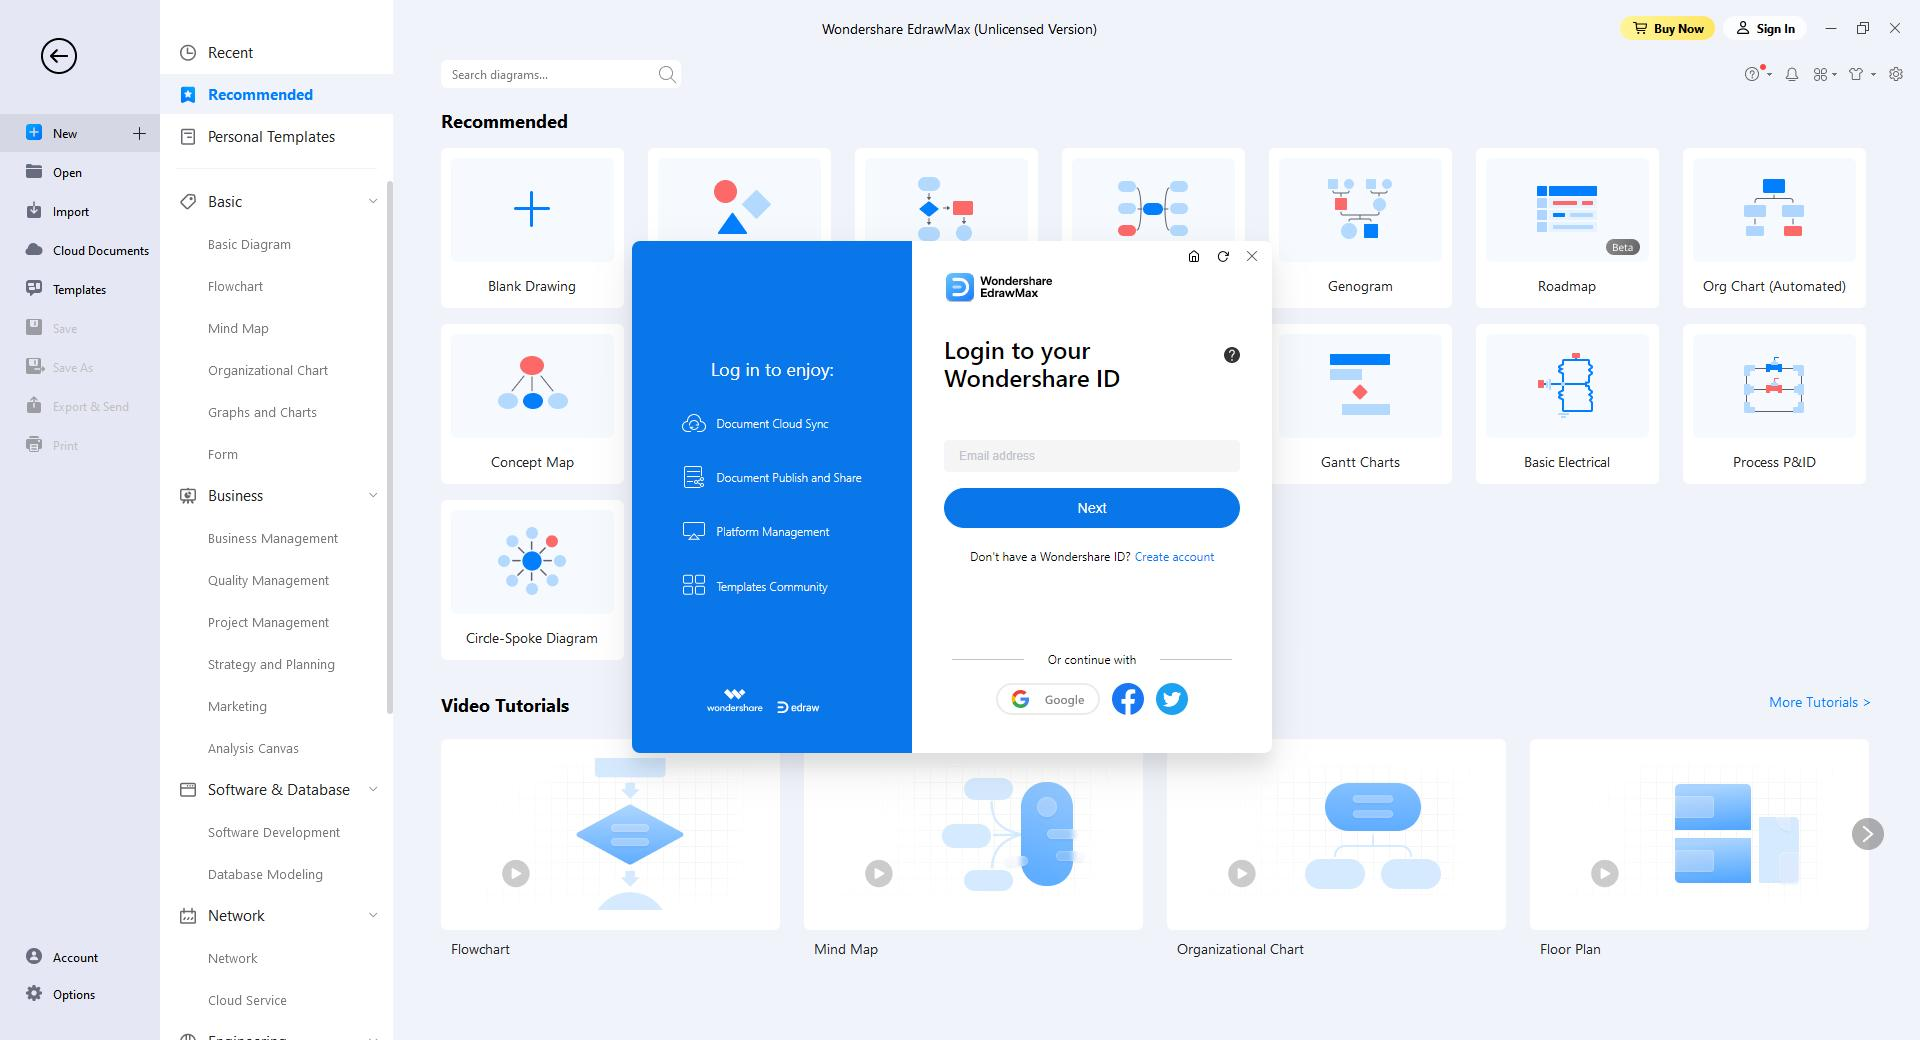
- Click Sign In from the top-right corner of the Home page.
- Click Create account on the Login to your Wondershare ID screen.
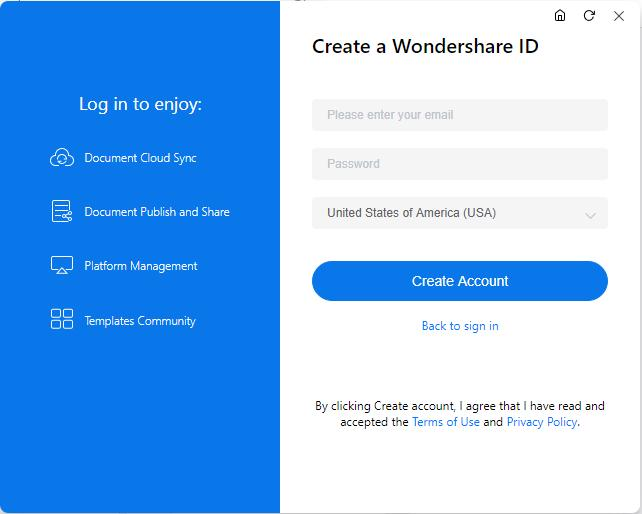
- Populate the available input boxes on the Create a Wondershare ID screen with your email ID, a strong password, and region of residence, and click Create Account.
- After registering, get back to the Login to your Wondershare ID screen, and use the account's credentials to sign in to the app.
Method 2: From the Account Screen
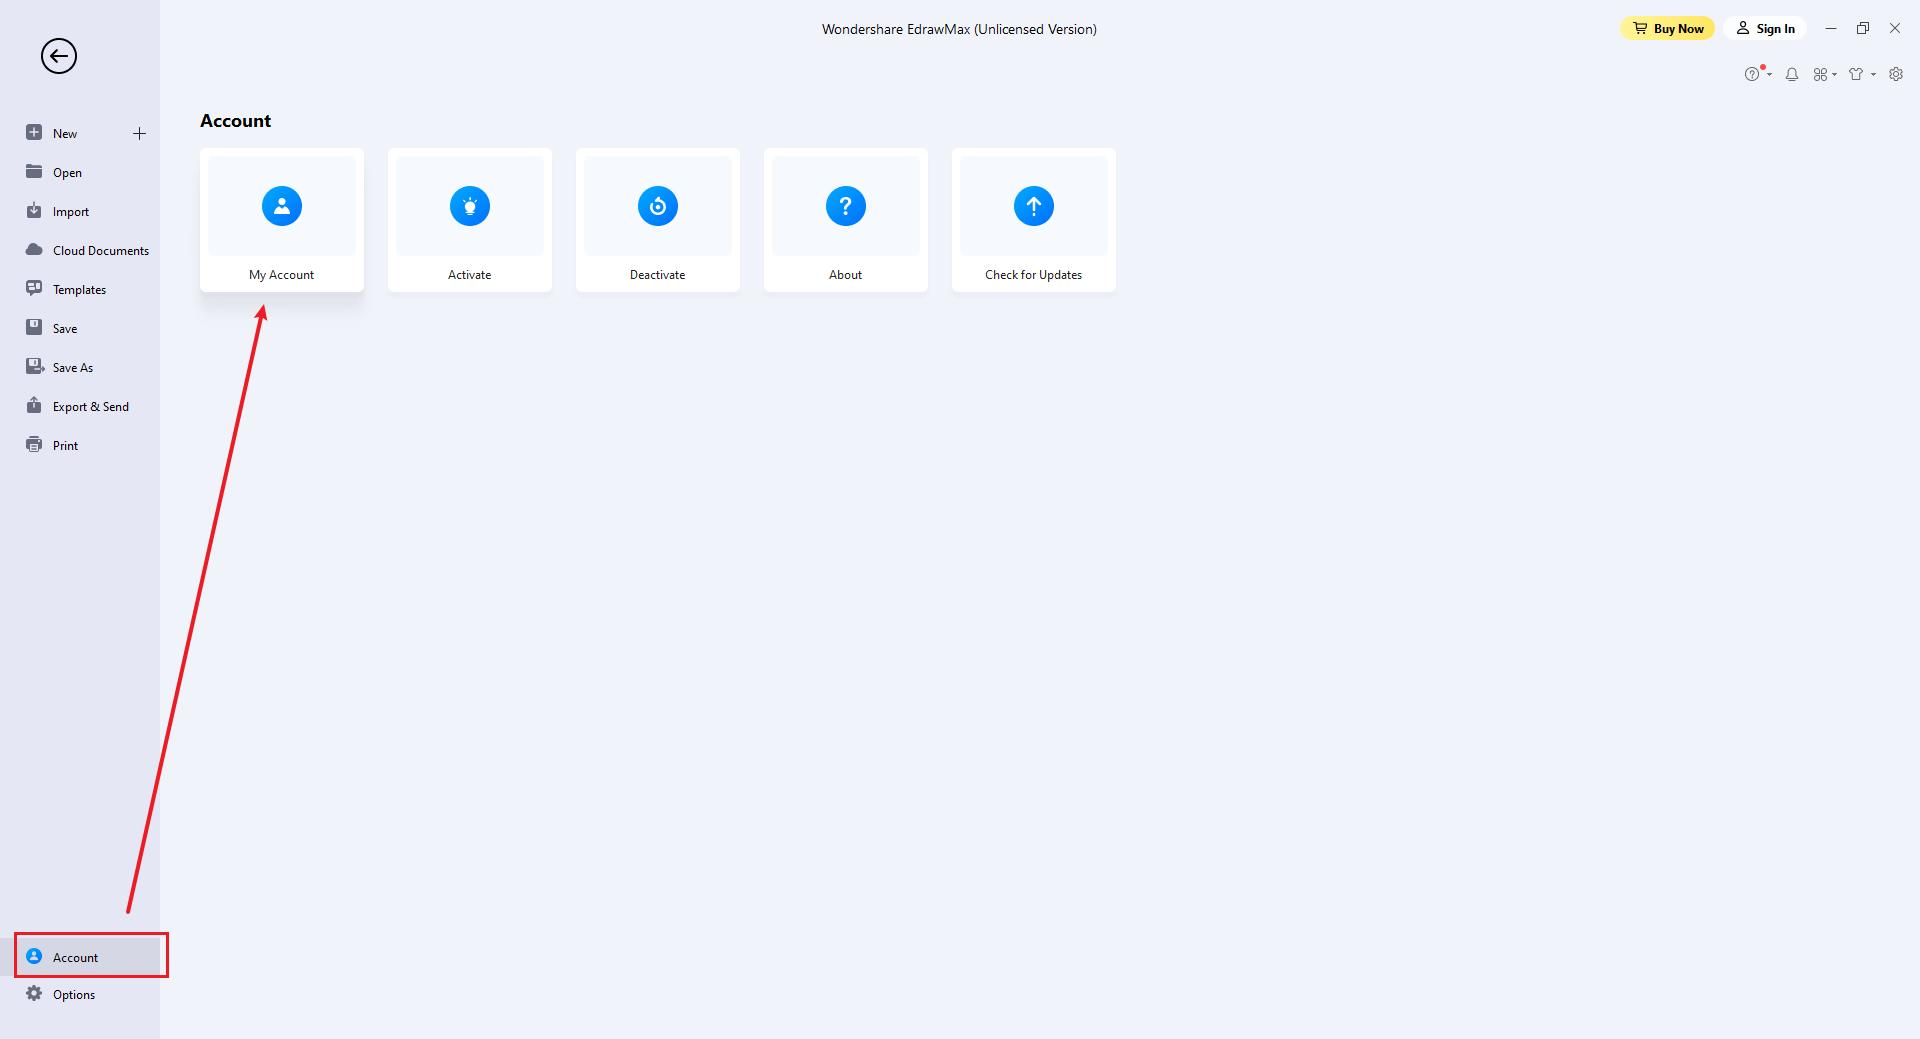
- Click Account from the bottom of the navigation bar present on the left side of the Home page.
- Click My Account from the right window, and the Login to your Wondershare ID screen will appear. From there, you can follow the steps explained in the previous method to register and sign in.
How to Check Your Account?
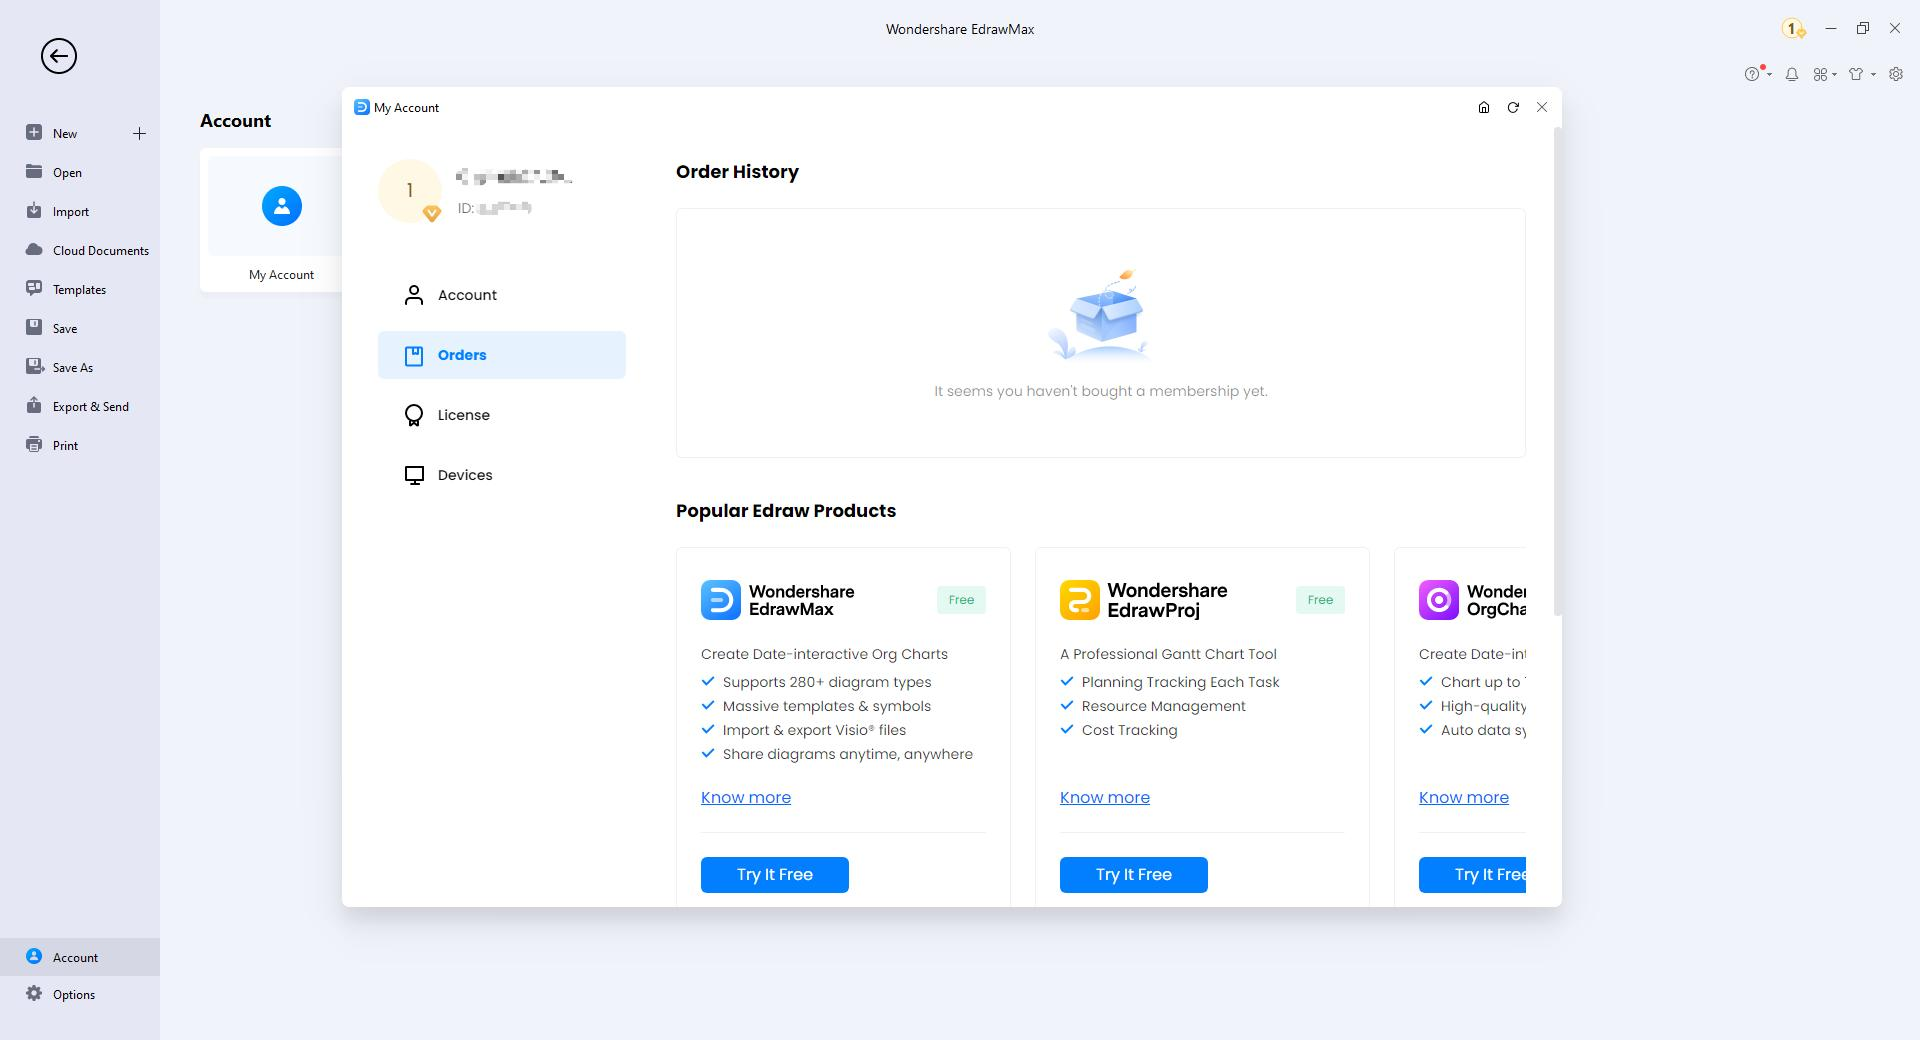
After signing in, go to the Account screen as explained earlier.
Click My Account. Click to select Orders from the navigation pane on the left of the My Account box, and you can check your account details under the Order History section on the Purchase history tab on the right.
Update EdrawMax
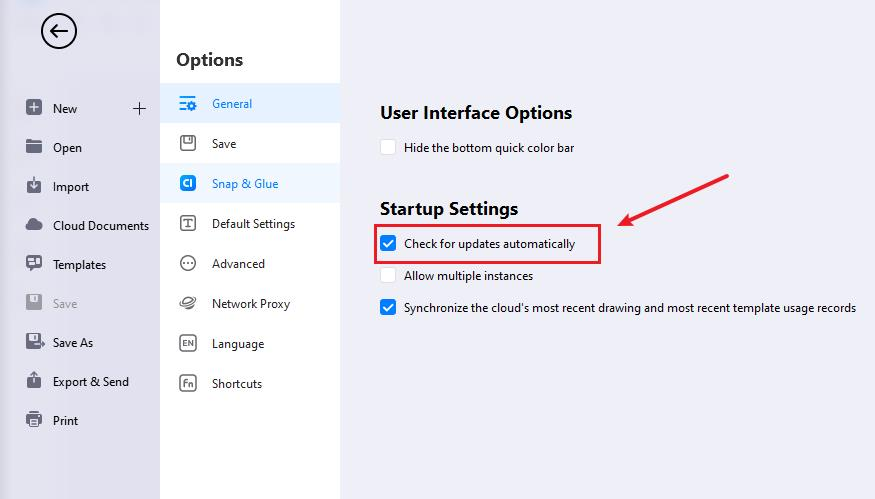
It is important to check for software updates regularly to ensure a flawless working experience and access all the new features added to the program. Because of this, by default, EdrawMax is configured to check for and install the updates automatically.
However, there might be instances when you don't want the application to install the updates automatically. In such a situation, you can turn off automatic updates and check for them manually whenever convenient for you.
To turn off automatic updates on EdrawMax, and update the software manually when needed:
Activate and Deactivate EdrawMax
How to Activate?
To get the full features of our product, you can activate EdrawMax and use the premium version. Edraw Activation is an anti-piracy technology designed to verify that software products are legitimately licensed. It works by checking whether the valid license code is used in another device more than the permitted number.
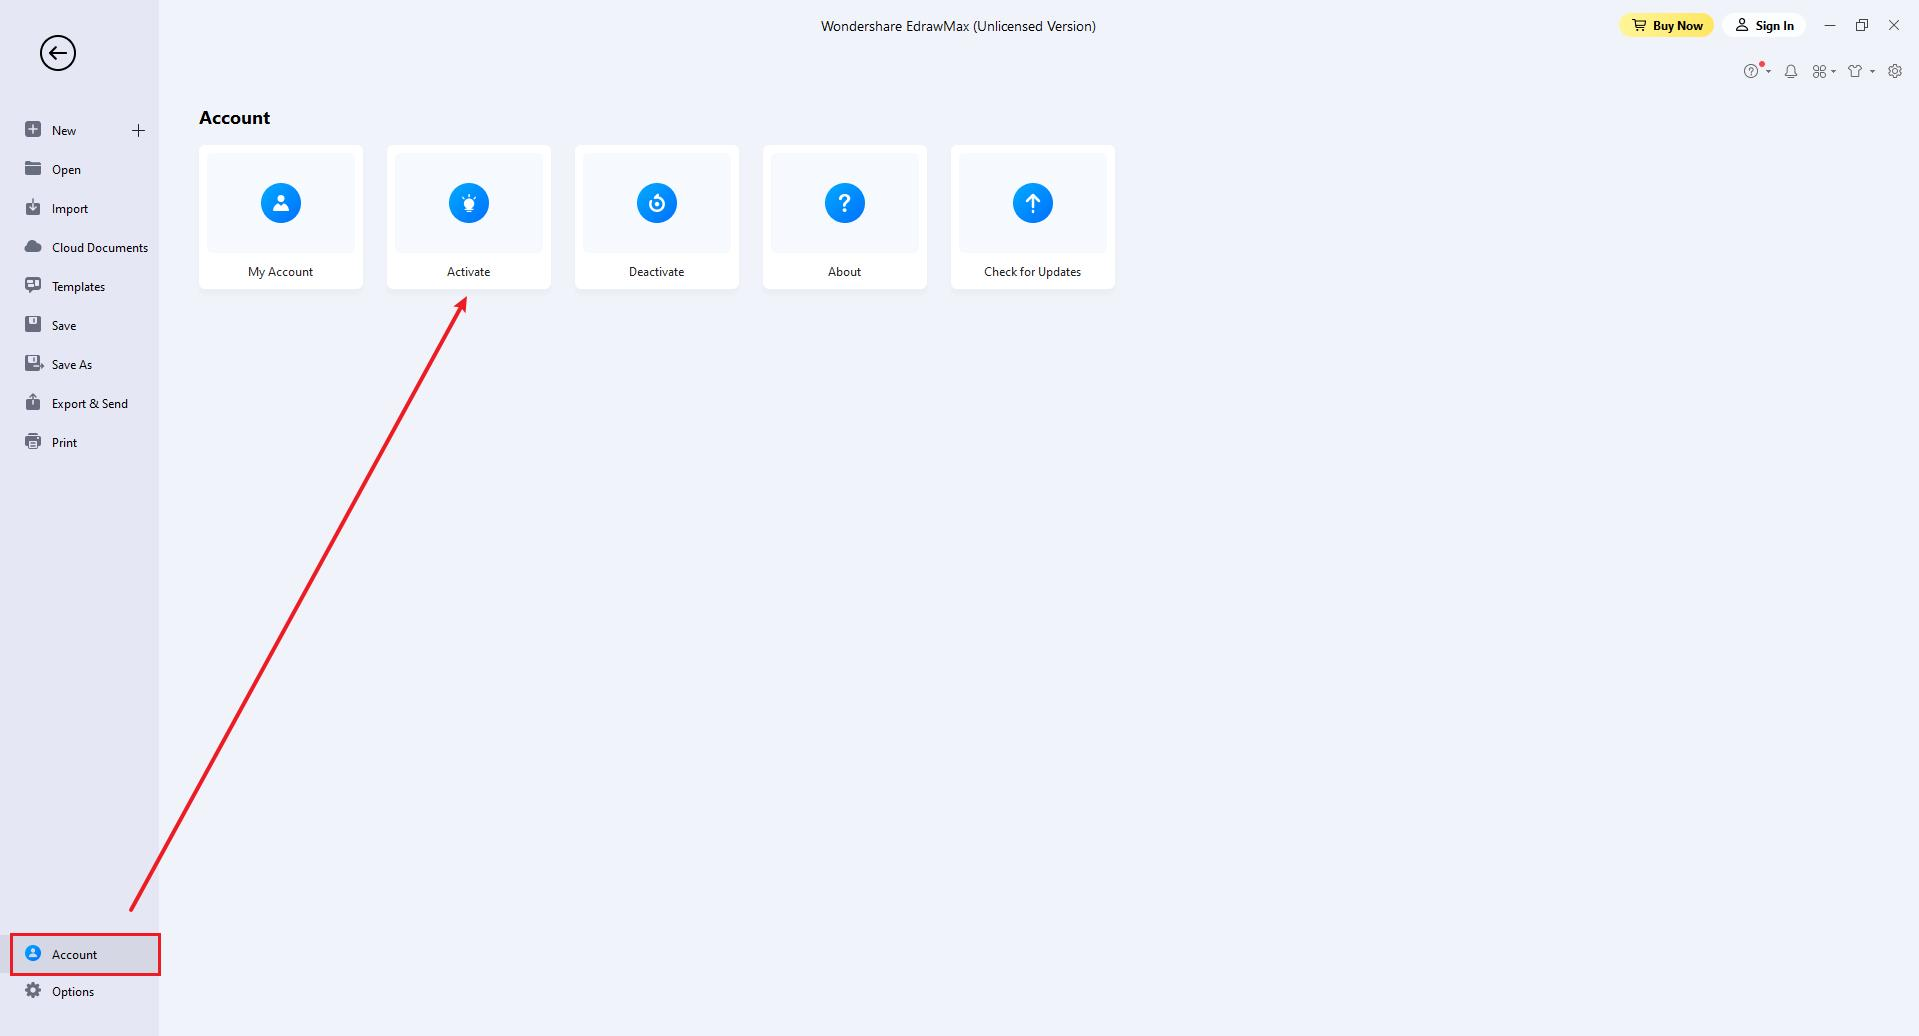
Run EdrawMax with computer administrator privilege and navigate to Account > Activate.
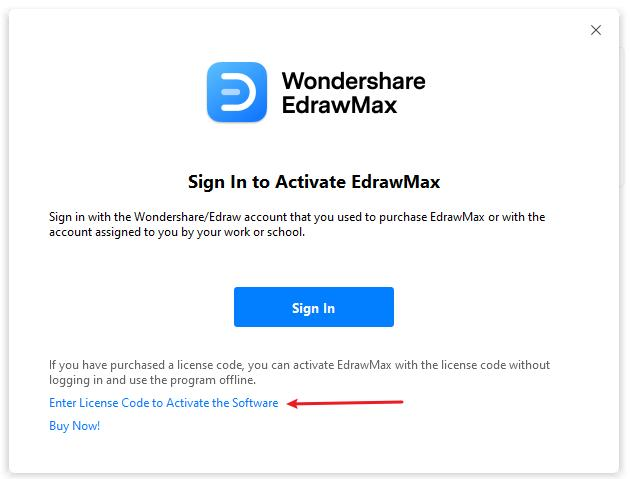
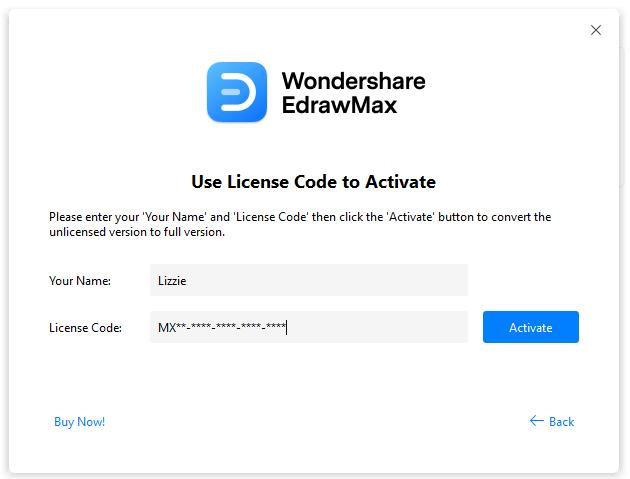
If you buy a subscription or lifetime plan of EdrawMax, you can sign in with your account to activate the software. If you get a license code, click Enter License Code to Activate.
The Activation window will open. You can write your name and paste the valid license code in the input boxes. Then click Activate button.
How to Deactivate?
Deactivation is necessary if you want to activate Edraw programs on another computer. Go to the Account window and click Deactivate.
Once you deactivate the software, EdrawMax on this computer will turn into the unlicensed version, and you can activate it on another computer.
Note:
Deactivation can only be done once every 30 days.
The Limitation of Unlicensed Version
An unlicensed version allows you to use EdrawMax freely for 15 days. Using diagrams created by EdrawMax (unlicensed version) for commercial purposes is NOT ALLOWED.
The unlicensed EdrawMax will add watermarks when you want to export your designs, and there are also some other functional limitations. Refer to EdrawMax FAQ.
Create New Diagrams
You can start drawing with a new file or build from a pre-designed template. There are several ways as follows.
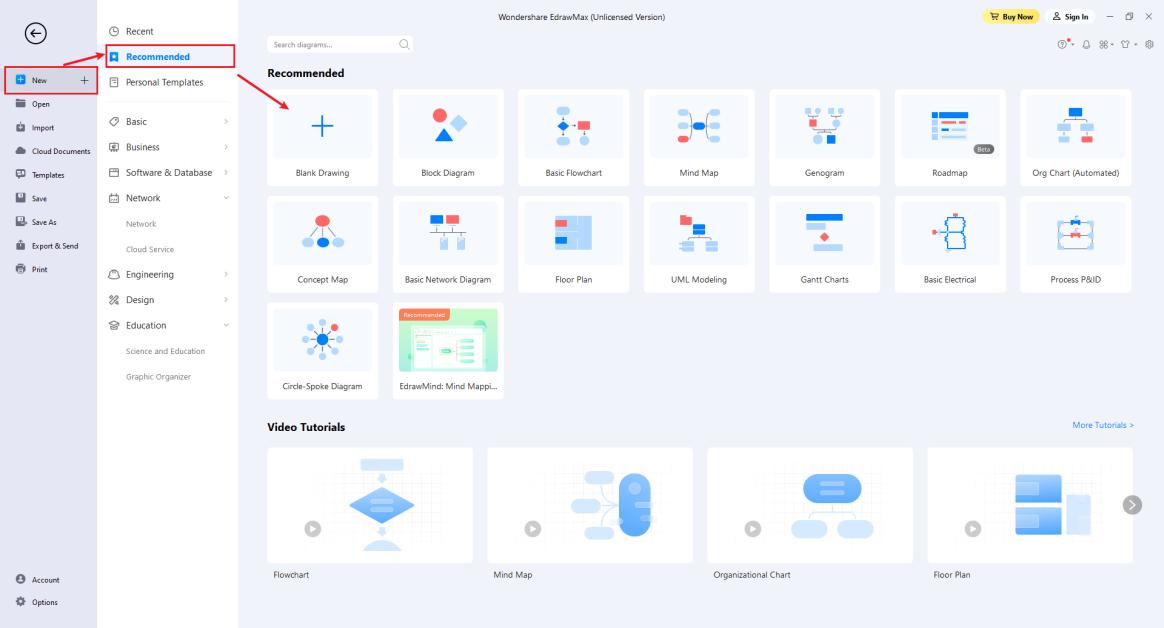
- Launch EdrawMax, choose Recommended in the pop-up window and click Blank Drawing.
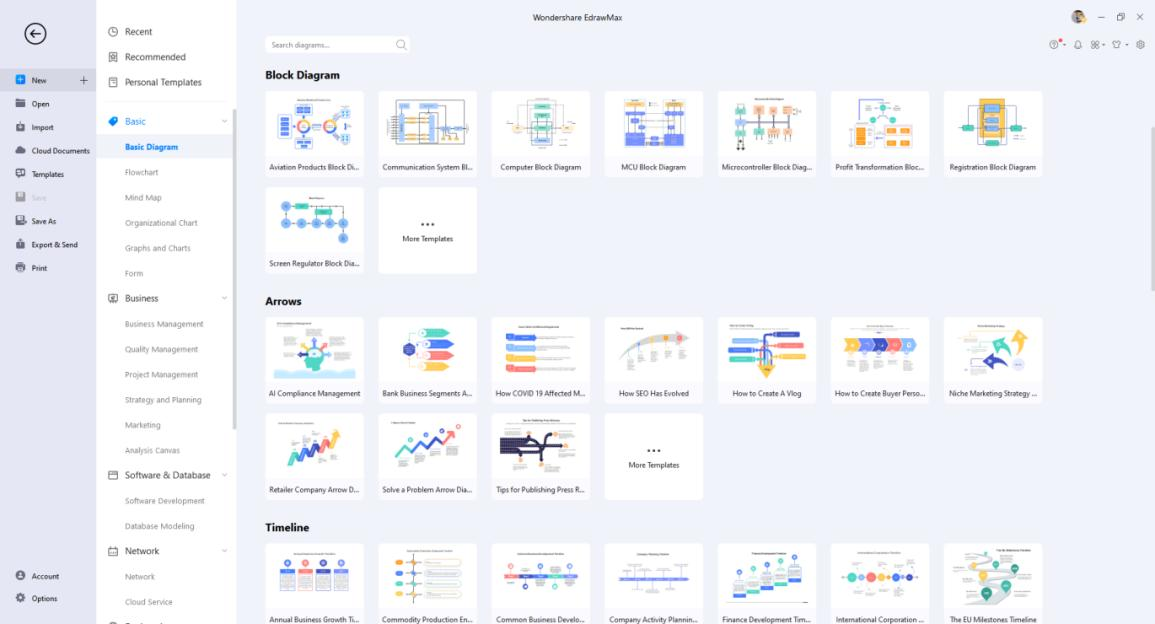
- Choose a pre-made template in the diagram collections window and click the template to open it.
- Use the shortcut Ctrl + N(Mac: Use the shortcut ⌘ + N / cmd + N) or click the New button
 on the Quick Access Toolbar in the workspace.
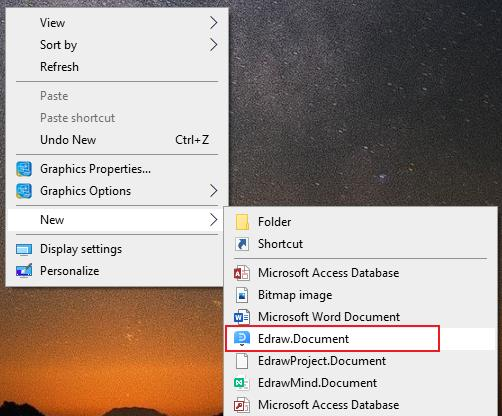
 - Right-click on the desktop, open the context menu, and select New > Edraw.Document.
Open Files
There are several ways to open a file as follows.
- Double-click the file, or right-click and choose Open in the context menu.
- Drag and drop the file into EdrawMax to open it.
- Use the shortcut (Win: Ctrl+O; Mac: ⌘ + O / cmd + O) or select File > Open, locate the file you want and open it.
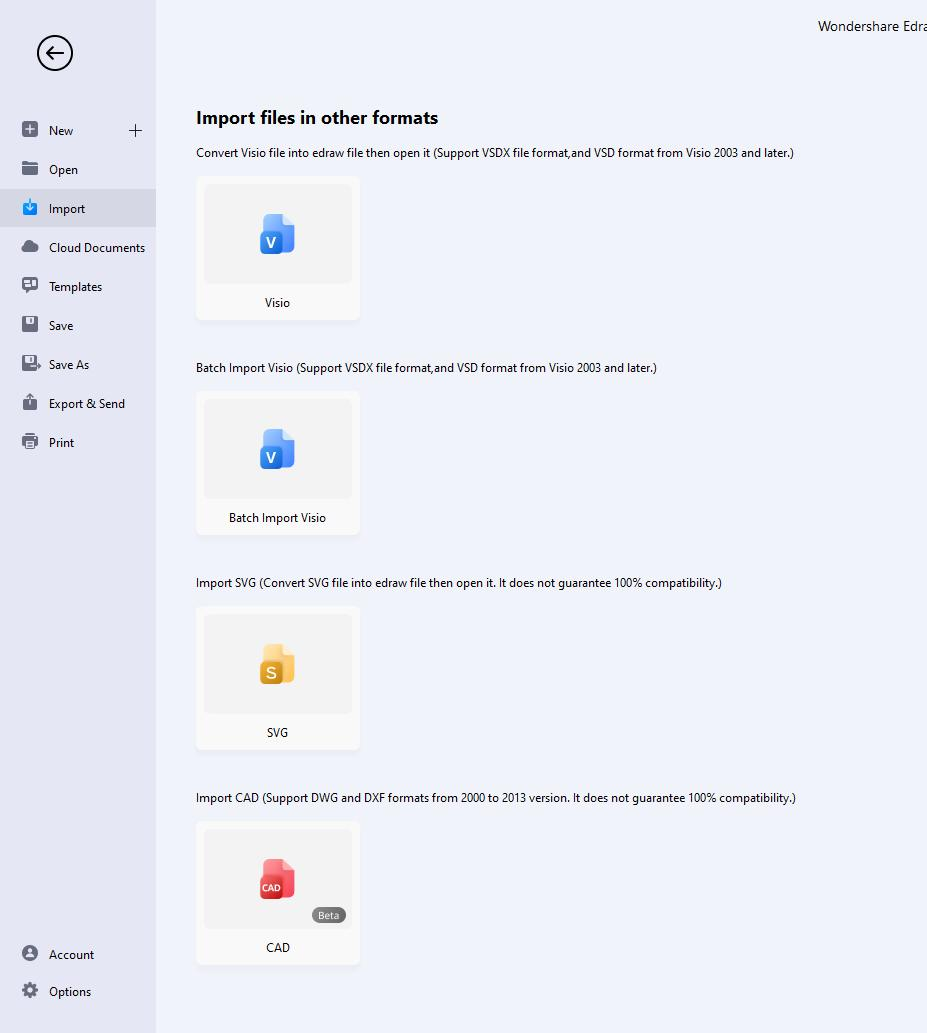
Import Files
EdrawMax supports importing multiple file formats, including Visio(VSDX, VSD)and SVG.
Open EdrawMax and select File > Import. You can easily import Visio files (VSDX, VSD) into EdrawMax one by one or in batch.
Save Files
There are several ways to save a file as following.
- Use the shortcut Ctrl + S(Mac: ⌘+ S / cmd + S).
- Select File > Save. If the file is saved for the first time, please follow the instructions to rename it and keep it on the right path.
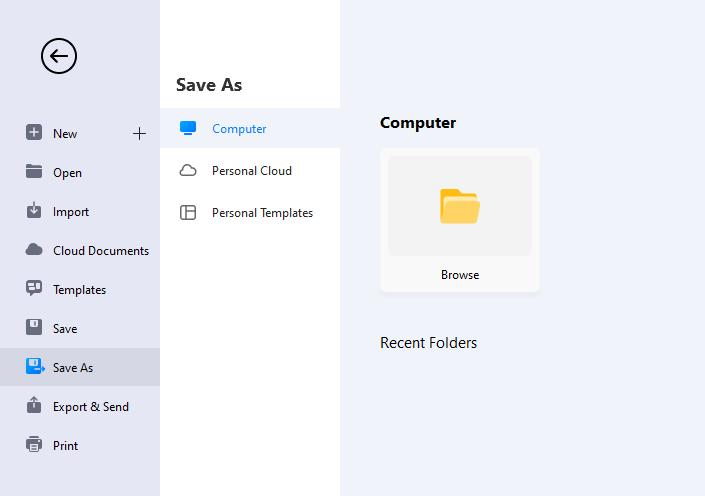
- Select File > Save As. You can save the file to a new path or create personal templates.
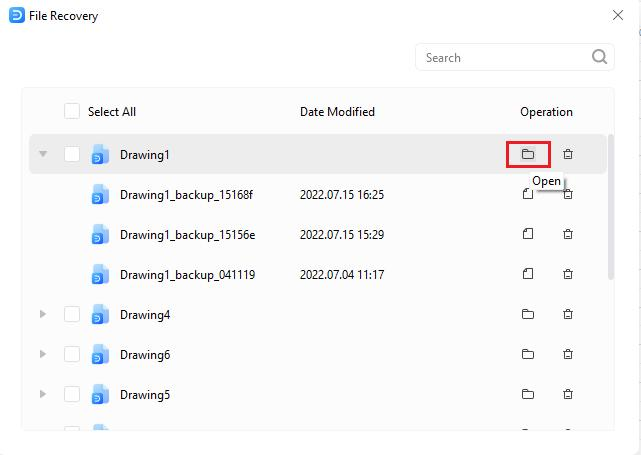
File Recovery
File Recovery is not a replacement for saving your files manually. Save files frequently, and the software will recover files with more versions.
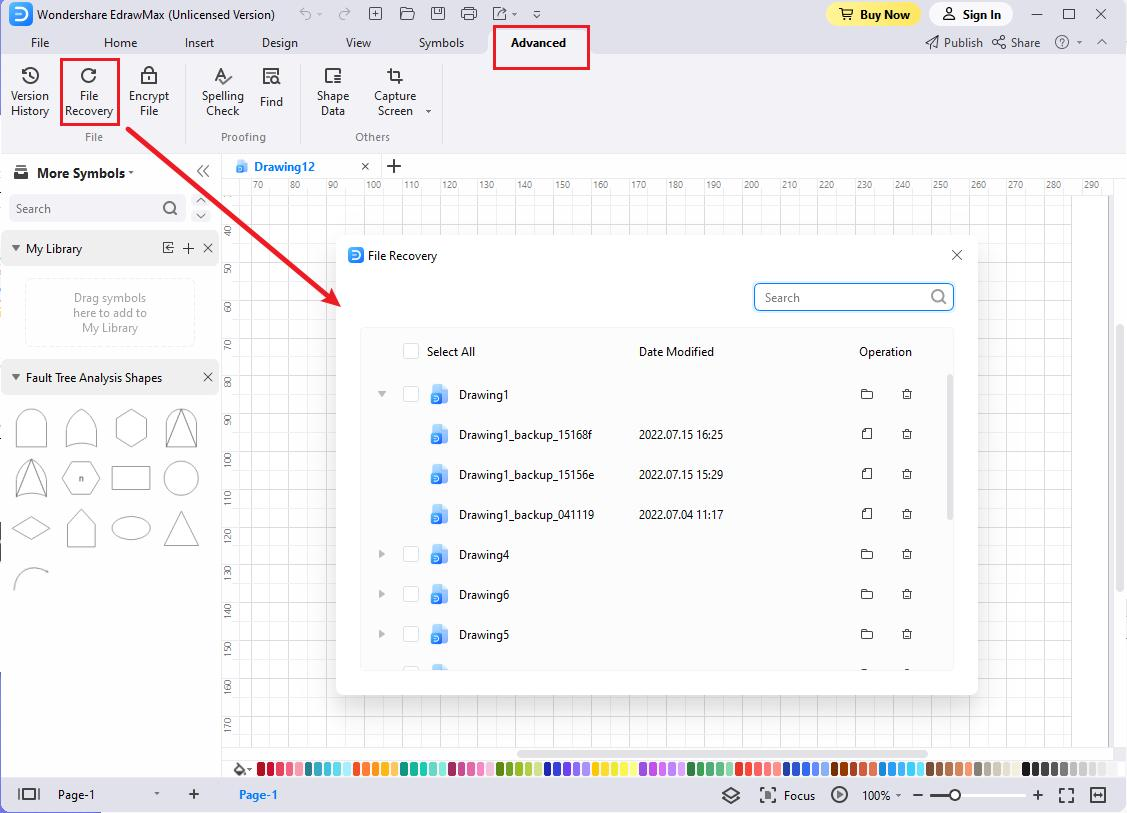
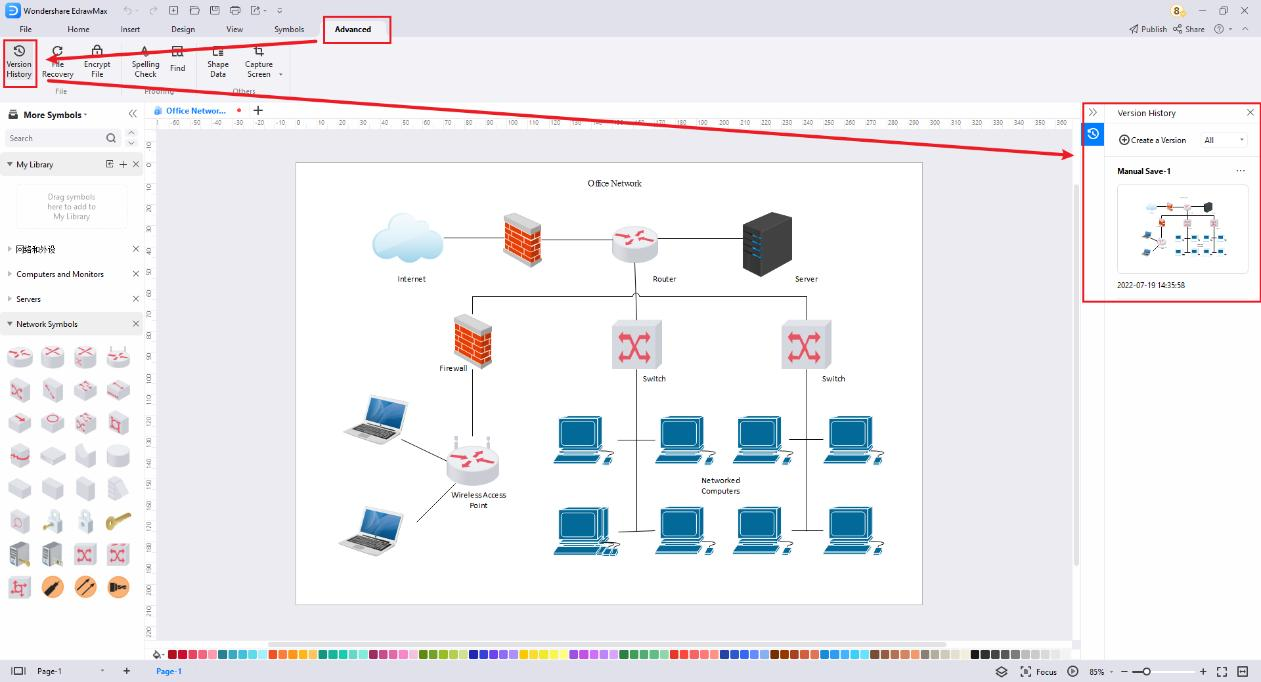
The File Recovery panel can be accessed by clicking Advanced at the top of the workspace. .In the tab you will see two buttons, namely Version History and File Recovery, where you can see all the available backup files.
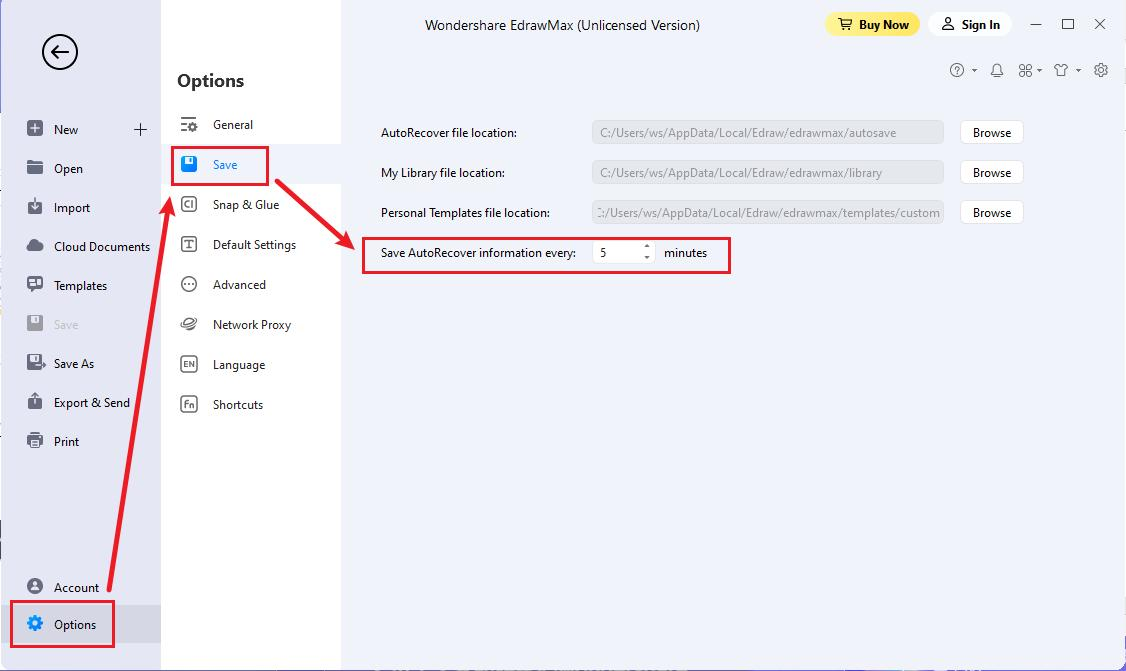
- Win: Select File > Options > Save to set a time interval for saving backup files.
- Mac: Select File > Options > General to set a time interval for saving backup files.
How to Restore Files?
- Win: Click the Advanced tab from the top of the workspace.
- Click the File Recovery button.
- Click the Open icon present next to the backup file you want to recover.
- Save the file to your PC or Personal Cloud for future uses.
Mac: Click the Version History & File Recovery icon
Version History
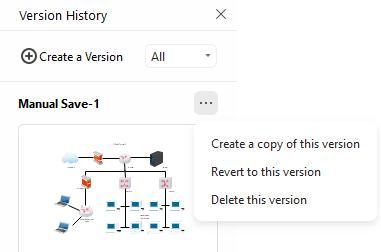
Version History in EdrawMax allows you to view the change history of the file, revert a file to a previous version, and create a new copy from an earlier version. Version History will work after you have saved the file in the Cloud.
- Win: Go to Advanced > Version History to open the Version History pane.
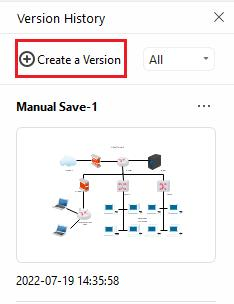
- Click Create a Version to create a version manually for your file, which will be saved in the Cloud and your PC.
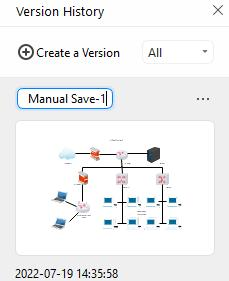
- Name specific version by clicking on the title of the version.
- Click on the three dots to the right of each tile. A menu will display with three options. Click Create a copy of this version to create a new file from the previewed version and not replace the current version. Click Revert to this version to return the file to the previewed version, removing all edits made in between that version and the current version.
Mac: Click the Version History & File Recovery icon.
Note:
EdrawMax automatically generates a new version to be saved in the Cloud and locally when a file is left unsaved for longer than the set auto-save time.
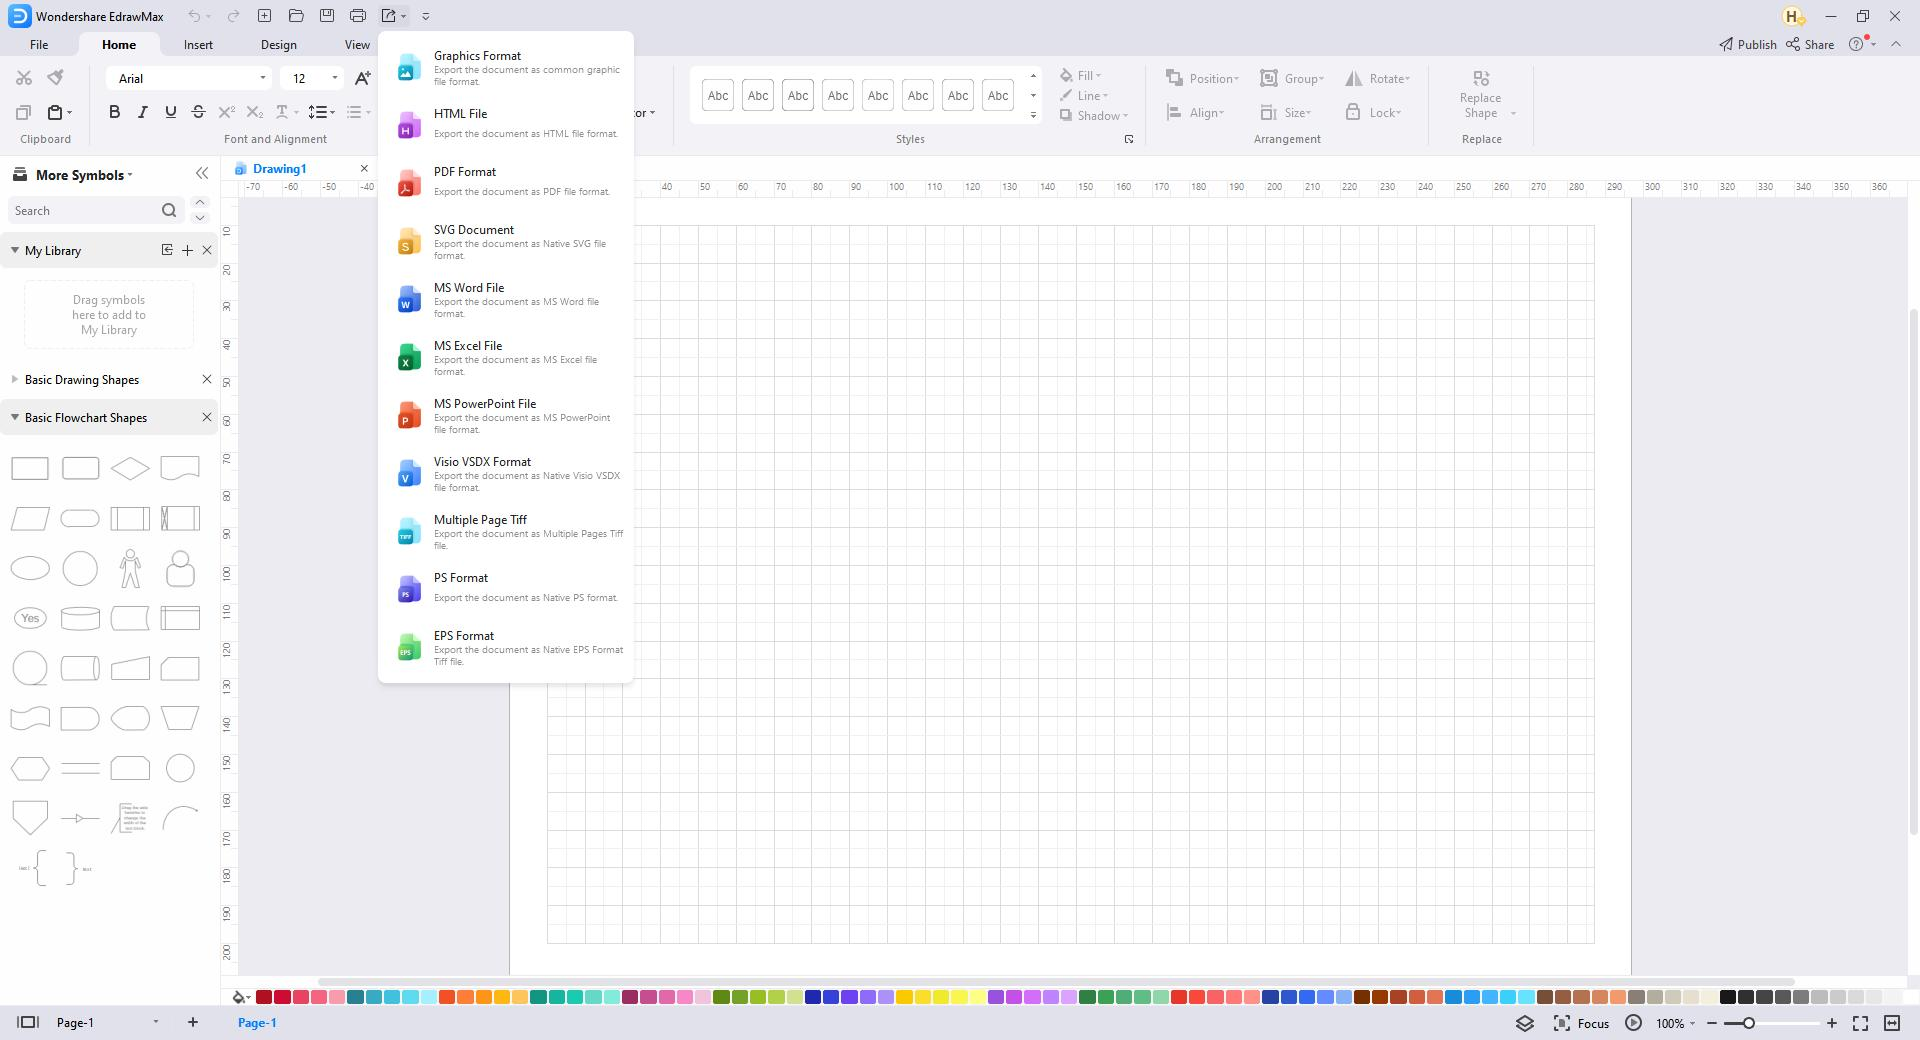
Export Files
EdrawMax currently supports exporting file formats such as PNG, JPG, SVG, PDF, Excel, Word, PowerPoint, Visio, HTML, etc.
Navigate to File > Export & Send or click the Export button on the Quick Access Toolbar. Then choose the desired export options.
Export to Graphic
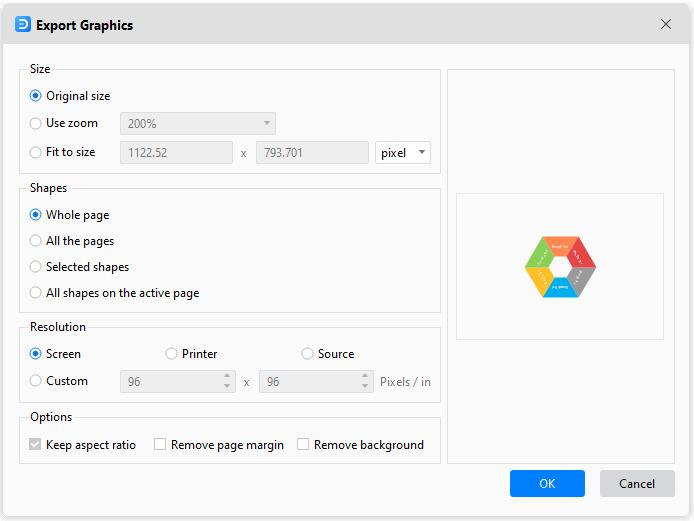
EdrawMax supports exporting PNG, JPG, BMP, ICO, PPM, TIF, and TIFF.
- Select Export & Send > Graphics. The Export Graphics window will appear.
- Choose the size, which page(s) or shape(s) of your file to export, and the resolution.
- Click OK.
- Choose what type of graphic to export and where to save the exported graphic.
Tip:
If you only need to export one or some shapes in the drawing, select them on the canvas before clicking the Export button. Otherwise, there will be no "Selected Shapes" for you to choose from.
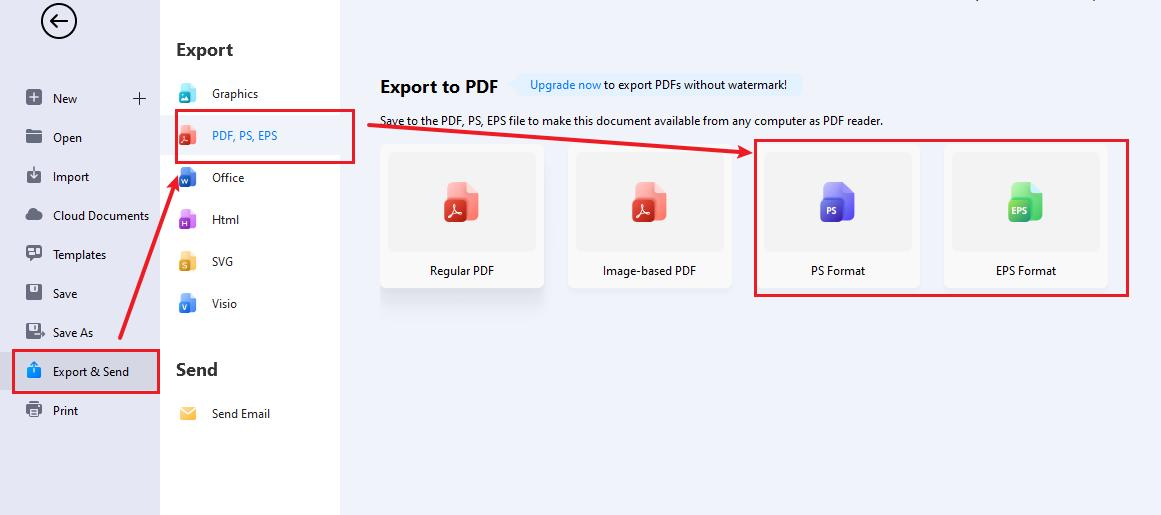
Export to PDF
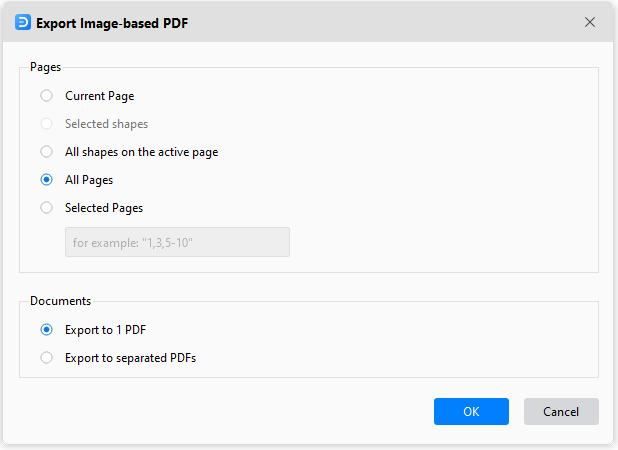
EdrawMax supports exporting regular and image-based PDFs.
- Navigate to Export & Send > PDF, PS, EPS.
- Choose Image-based PDF or Regular PDF to export the document.
- The Export window pops up.
- The options under the Documents tab will be available only when "All Pages" or "Selected Pages" are selected.
- Select to export the file as a single PDF file or multiple separated PDF files when the file contains multiple pages.
Export to PS/EPS
EdrawMax supports exporting PS and EPS. Select Export & Send > PDF, PS, EPS and choose PS Format or EPS Format instead. Determine where to save the file and open it with Adobe Illustrator or Adobe Photoshop.
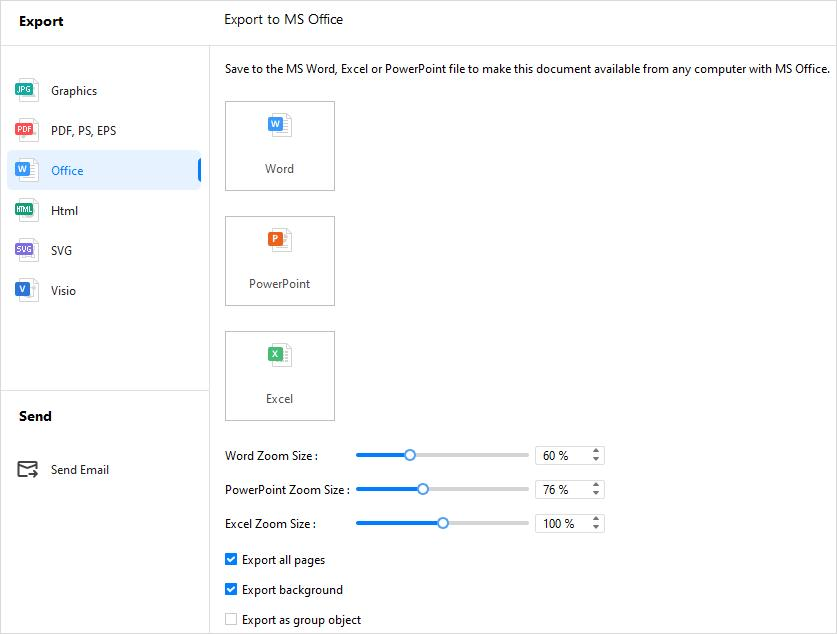
Export to MS Office
EdrawMax supports exporting editable MS Office files, including Word, PowerPoint, and Excel.
- Navigate to Export & Send > Office;
- Choose the desired file formats (.docx, .pptx, .xlsx) and customize your export settings.
- Save the file in the path.
Note:
For the export documents, we recommend you open and edit them in Microsoft Office 2013 and the advanced versions to get a better preview effect.
Export to Html
- Navigate to Export & Send > Html.
- Choose Html Format and customize the export options.
- Save the file in the path.
Export to SVG
- Navigate to Export & Send > SVG.
- Choose SVG Format and select which page(s) or shape(s) to export.
- Save the file in the path.
Export to Visio
- Navigate to Export & Send > Visio.
- Choose Visio VSDX Format
- Save the file in the path.
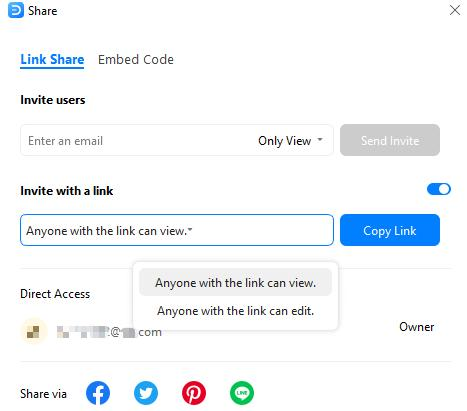
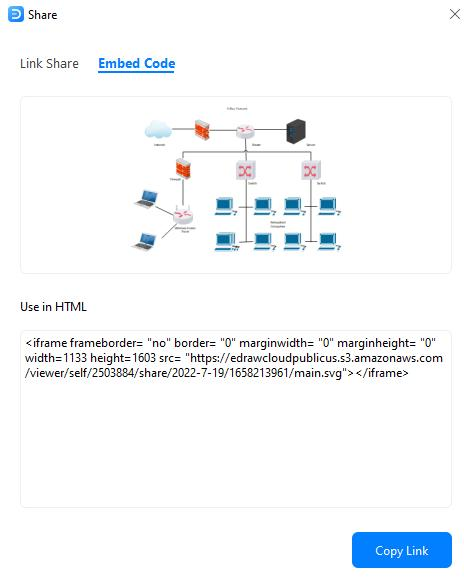
Share Files
Click  on the top right corner of the workspace, and the Share window pops up.
- Post on social media: Share your files via Facebook, Twitter, LinkedIn, Pinterest, or Line directly from EdrawMax.
- Share with link: manage shared link permissions and allow others to read and edit files.
- Embed into webpages: copy the generated HTML code and paste it into your webpage.
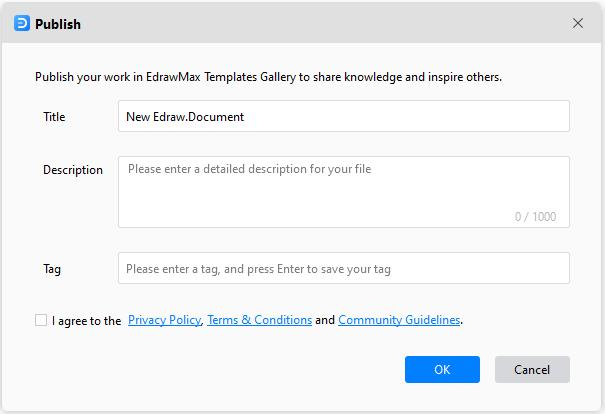
Publish Files
Click  on the top right corner of the interface, and the Publish window pops up.
- Fill in the file name, file description, and tag, respectively.
- Read the terms & conditions, community guidelines and check the box to agree.
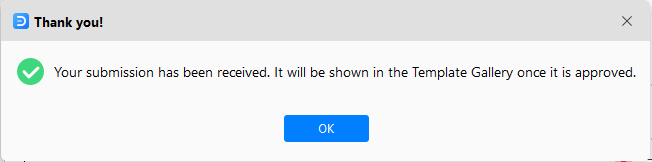
- Click OK and wait for the pop-up window that indicates success.
- Go through your templates in EdrawMax Templates Community.
Print Files
Use the shortcut to open a print preview interface.
- Win: Ctrl + P or select File > Print
- Mac: ⌘ + P (cmd + P) or select File > Print
By default, the copy number is 1, and you can choose printers or check printer status in Printer Properties. Specify the Page Range, Collated/Uncollated, Orientation, Page Size, and other print settings.
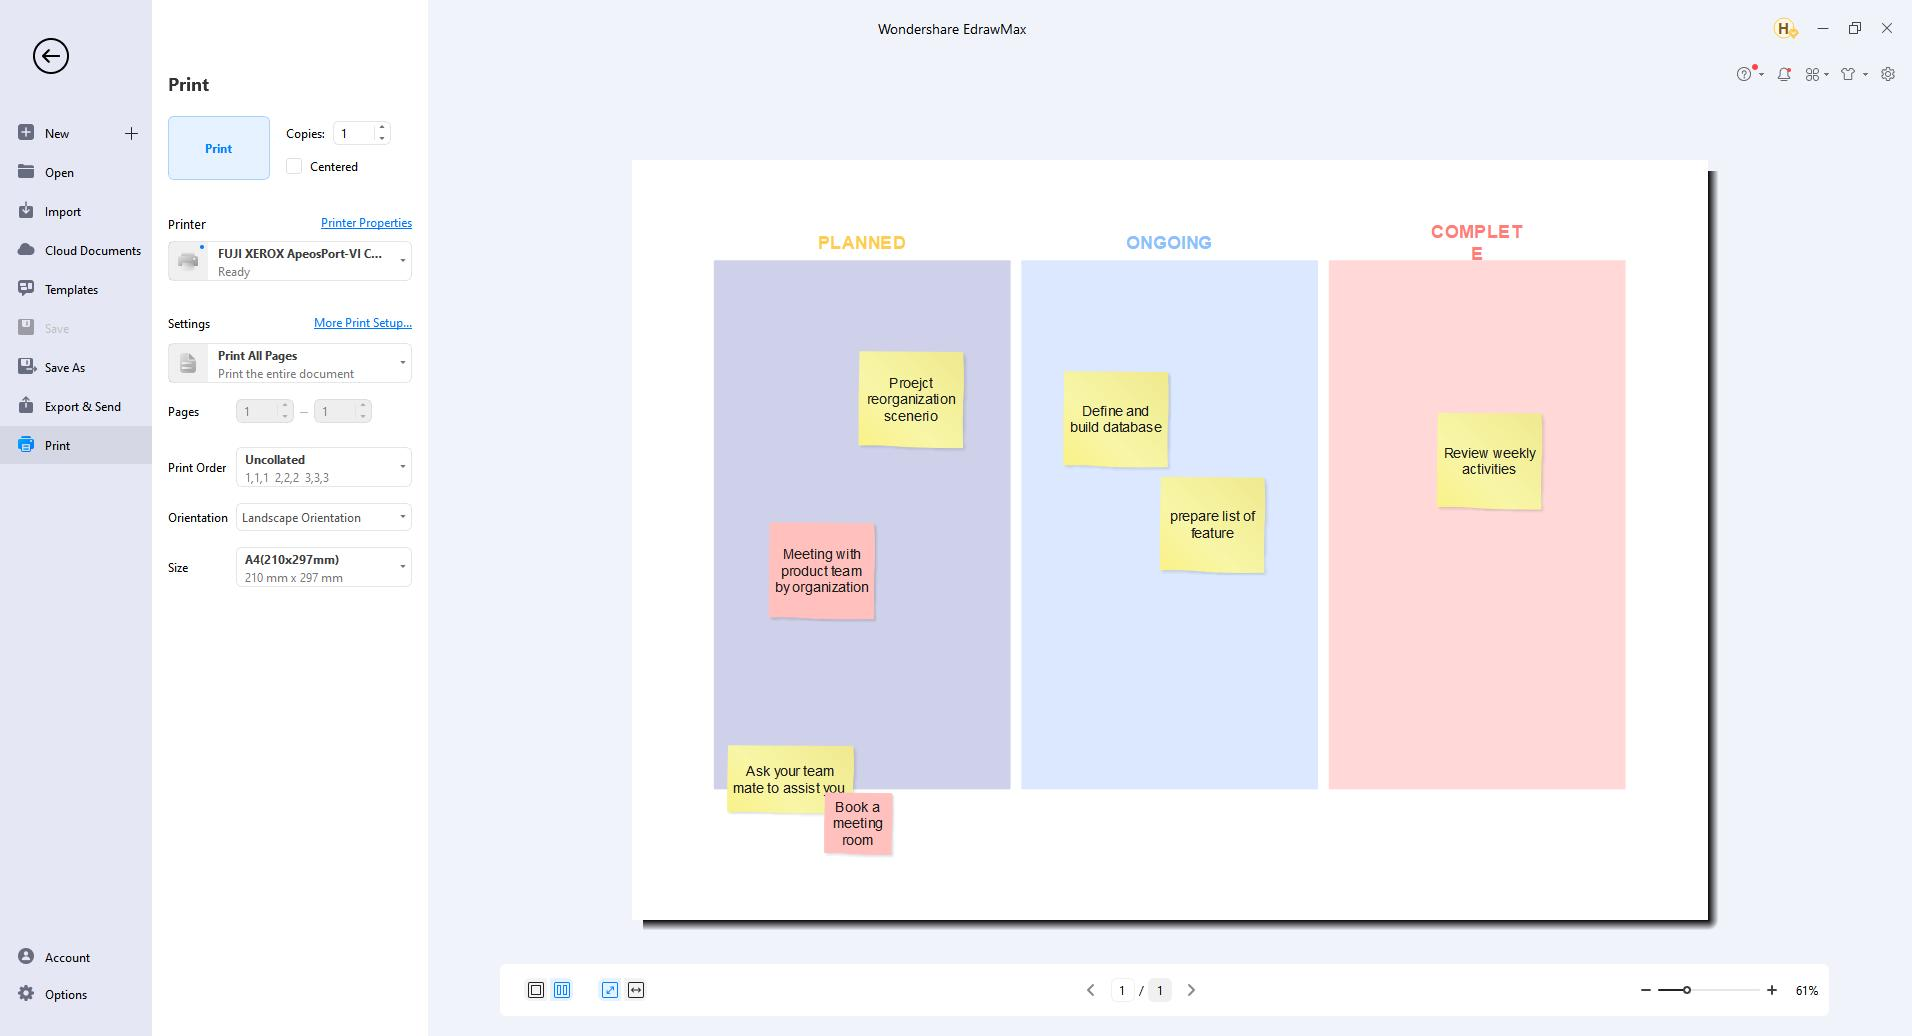
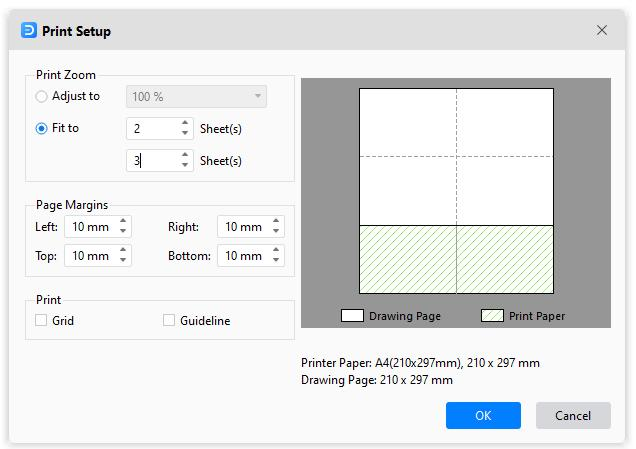
Click More Print Setup to see whether the sizes of the drawing page and the printer paper meet your requirements. You can add a grid or guideline and know the result in the preview window.
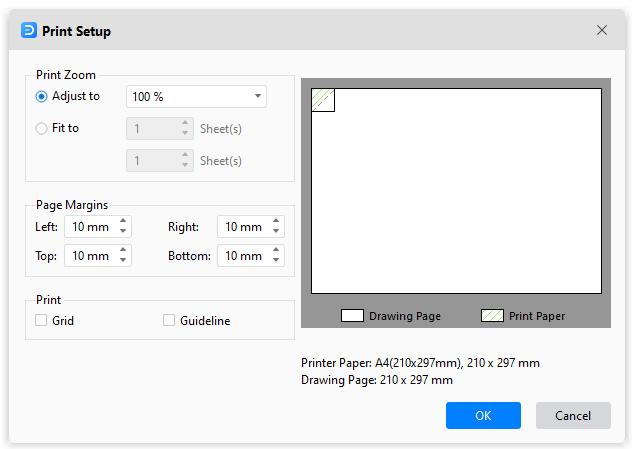
Adjust to: The percentage represents how the print size of the drawing page matches that of the printer paper(s). 100% means that the drawing will be printed exactly on paper. Less than 100% indicates that your drawing does not cover extra space on the print paper. For more than 100%, your drawing will be divided into sections and printed by several papers.
Fit to: The numbers will decide how many sheets will be used to print the whole drawings. The above means to add printer papers horizontally, while the below is to add papers vertically.
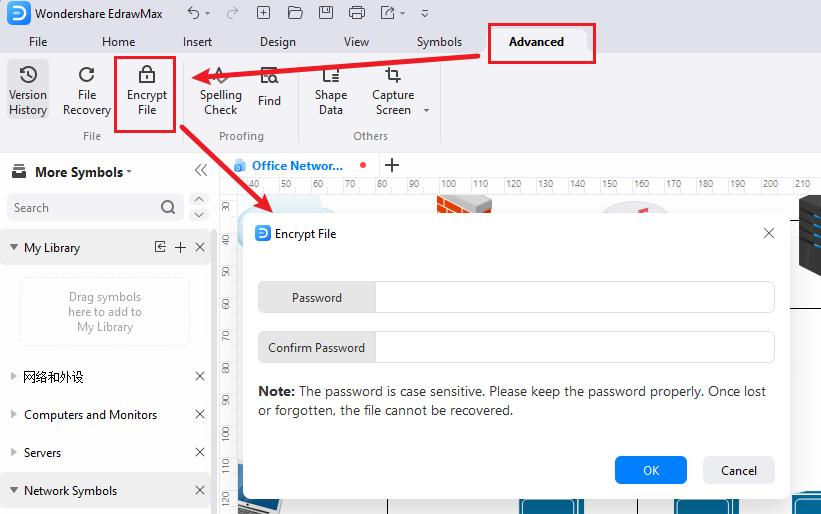
Encrypt Files
You can add passwords to protect the file.
- Select Advanced > Encrypt File ( Mac: Select View > Encrypt File).
- Enter and confirm the password that contains at least four characters.
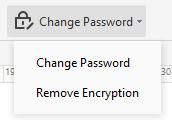
- You can also change or remove the password.
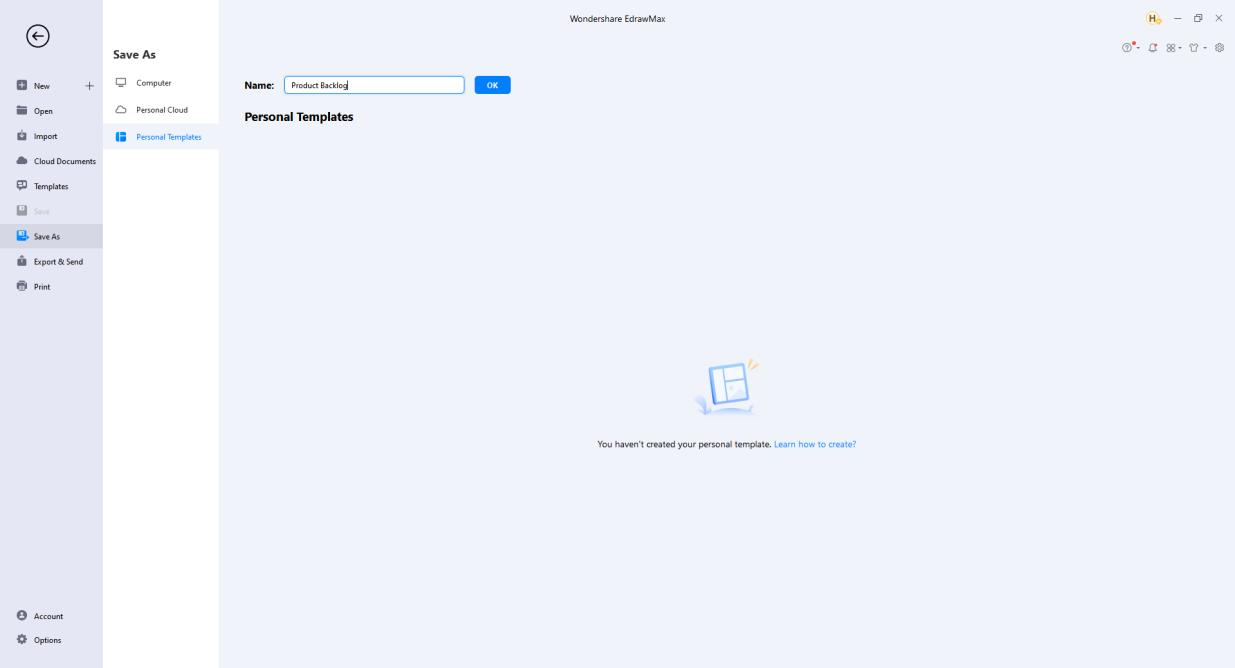
Create Personal Templates
If you and your team often use the same diagrams, you can easily convert the diagram into a template and share it. Creating personal templates can help you, and your team save more time and standardize the workflow.
- Create the diagram, select the page size, background, theme that you want, and choose the commonly-used symbol libraries attached to the diagram.
- Select File > Save As > Personal Templates, name the file, and click OK.
- See the template thumbnail and the pop-up window if uploaded successfully.
- Access and use the self-designed template from the Personal Templates panel.
Add Pages
There are several ways to add pages as follows.
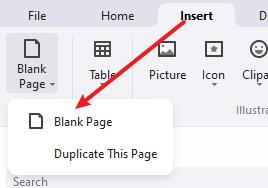
- Select Insert > Blank Page.
- Click the plus icon next to the page number on the footer.
- Right-click on the page name and choose Add Page on the context menu.
You can also duplicate a page in EdrawMax.
- Select Insert > Blank Page > Duplicate This Page.
- Right-click on the page name and choose Duplicate Page on the context menu.
Delete Pages
- Right-click on the page name and choose Remove Page on the context menu.
Reorder Pages
- Drag page tabs and rearrange pages.
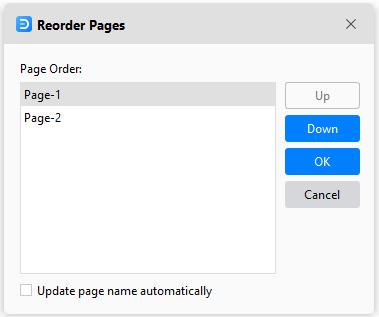
- Right-click on the page name and choose Reorder Pages on the context menu. The Reorder Pages window pops up.
Note:
If you check the Update page name automatically, EdrawMax will rename pages in numerical order.
Preview Pages
- Select View > Page Preview.
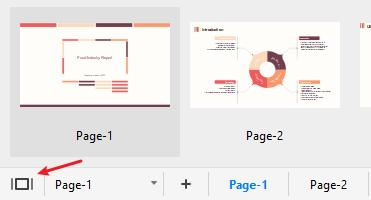
- Click the Preview Page button on the footer.
Zoom Pages
- Use the zoom bar, click and drag the slider to the left or right to zoom out or in.
- Select View > Zoom and choose a suitable zoom level.
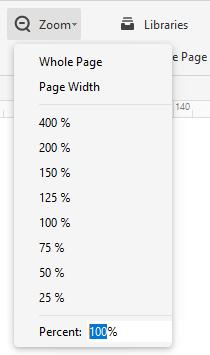
Whole Page: Adjust the page size to fit the window size.
Page Width: Adjust the page width to fit the window width.
Note:
EdrawMax supports zoom in/out based on the current position of the cursor.
Background and Layer
Add or Change Backgrounds
- Select Design > Background Color and choose a color you want.
- Select Design > Background Picture and choose a picture you want.
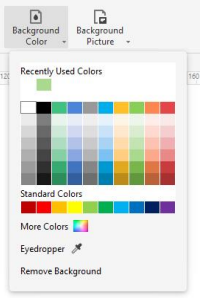
Remove Backgrounds
- Select Design > Background Color/Background Picture.
- Click Remove Background on the menu.
Add Layers
The Background is the default setting that you can't delete. When there are only Background and Layer-1, you can't delete Layer-1.
- Open Layer pane on the bottom of the canvas.
- Click New Layer.
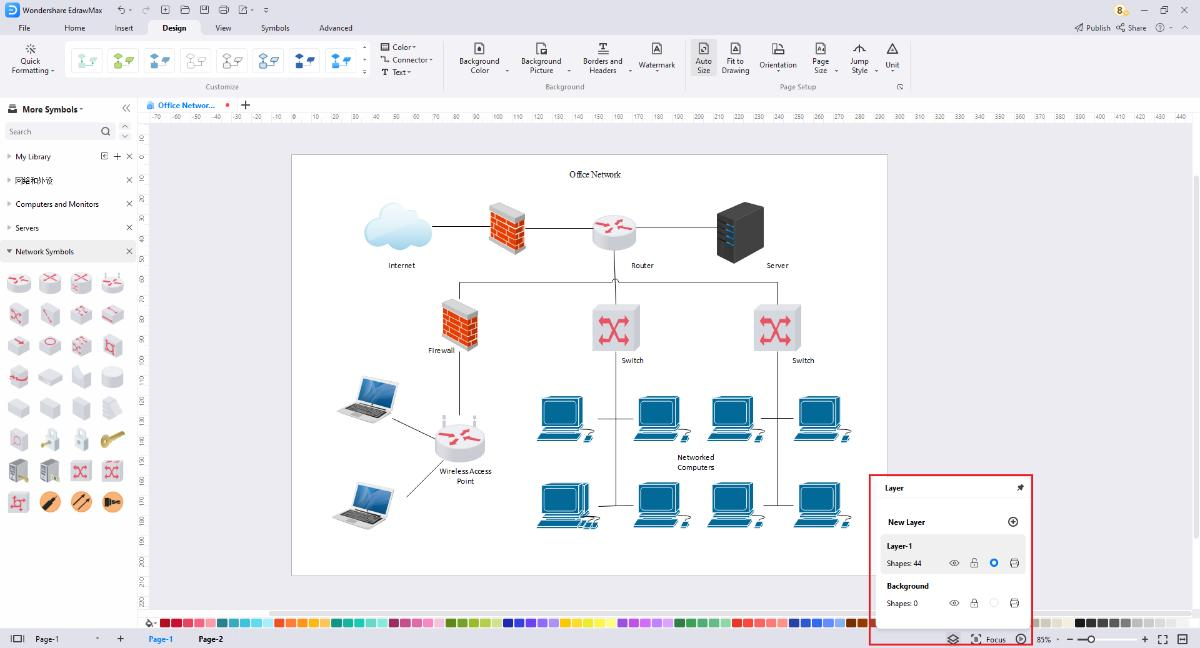
Click the pen icon, and you can rename the layers and background.
Click the open-eye icon, and the eye will be closed, which means you will not see any shapes on this layer.
Click the lock icon, the shapes in this layer will be locked and cannot be selected or changed if the lock is closed.
The circle dot icon indicates whether the layer is active or not, and it will tell you which layer you are editing.
Click the printer icon, and it shows banned; the shapes in this layer will not be printed.
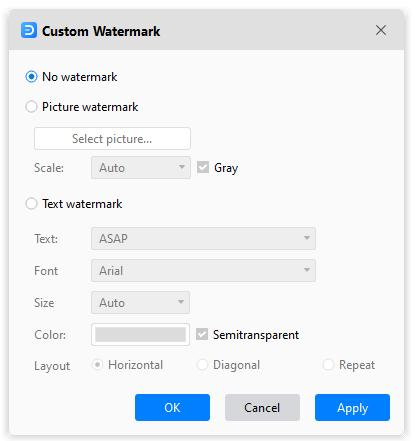
Add Watermark
Watermark: Add a pre-designed watermark on the drawing page, make your watermark or remove all watermarks.
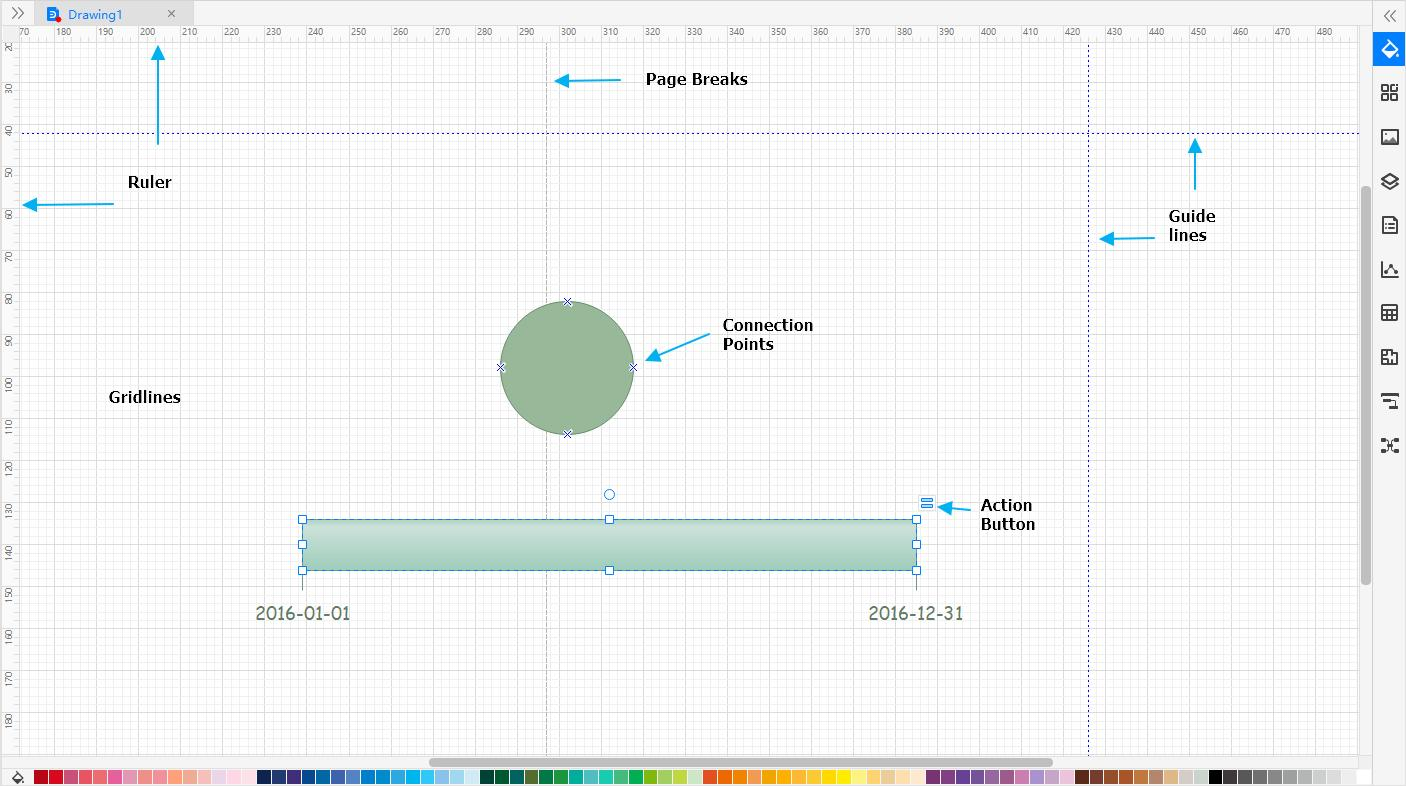
Page View Options
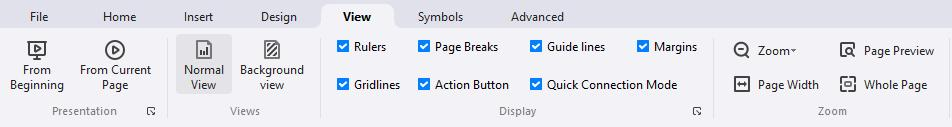
The View tab contains
From Beginning: Start the slide show from the first page.
From Current Page: Jump right into the show from this page.
Normal View/Background View: You can switch between two views. The grey button means it is active.
Auxiliary view tools: Ruler, Page Break, Guide lines, Gridlines, Action Button, Connection Points. You can use them to help you draw accurately and easily.
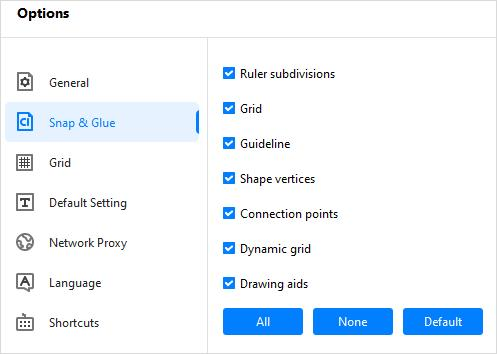
Snap and Glue
Turn Snap On/Off
When you create or move a symbol, snap pulls symbols and their edges into positions that align with other symbols, ruler subdivisions, grids, guidelines, or connection points. You can specify the types of drawing elements that symbols are snapped to.
- Select File > Options > Snap & Glue.
- Click None to clear all check boxes and turn snap off.
- Click All or select the drawing elements you want to turn snap on.
Note:
The snap settings you choose will apply to all symbols in the drawing.
Turn Glue On/Off
When you draw a connector, glue keeps symbols and connectors attached. If glue is turned off, you can move symbols while connectors are unattached.
- elect File > Options > Snap & Glue.
- Clear the Connection points check box to clear all check boxes and turn glue off.
- Select the Connection points check box to turn glue on.
Note:
The above procedures change the default glue setting for newly-created connectors but do not change the glue setting for existing connectors.
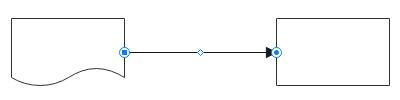
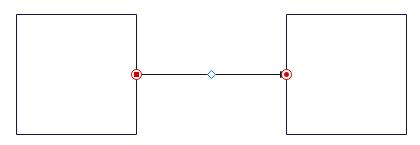
A glued connector shows red dots and circles at its end points when selected.
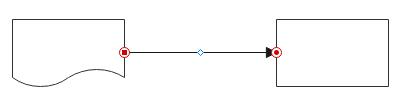
An unglued connector shows blue dots or circles at its end points when selected.
Page Setup
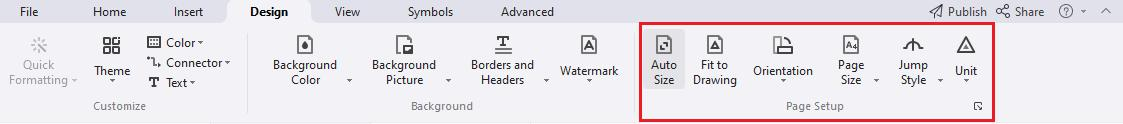
The Page Setup in Design tab contains
Auto Size: Extend the drawing page as needed to help you create larger diagrams than one printed page without changing the printer paper size. Combined with the Page Break option (View > Page Break), it shows you where page breaks would happen if you were to print the diagram.
Page Size: Choose a page size for your drawing, including A3 Sheet, A4 Sheet, A5 Sheet, B5 Sheet, Letter, Envelope, etc. You can customize page sizes in the Page Setup dialog box.
Orientation: Change page orientation to Portrait or Landscape.
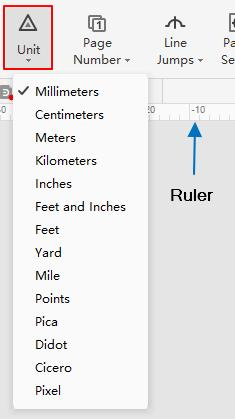
Unit: Choose a unit of measurement for your drawing, including millimeters, inches, feet, yard, mile, pixel, etc.
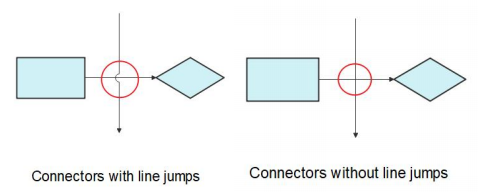
Line Jumps: Show or remove connector line jumps. You can change the line jumps setting to make connectors on a page intersect as straight crossing lines or line jumps. You can change line jump styles in the Page Setup dialog box.
Fit to Drawing: Resize the drawing page to fit the symbols on the page.
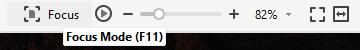
Focus Mode
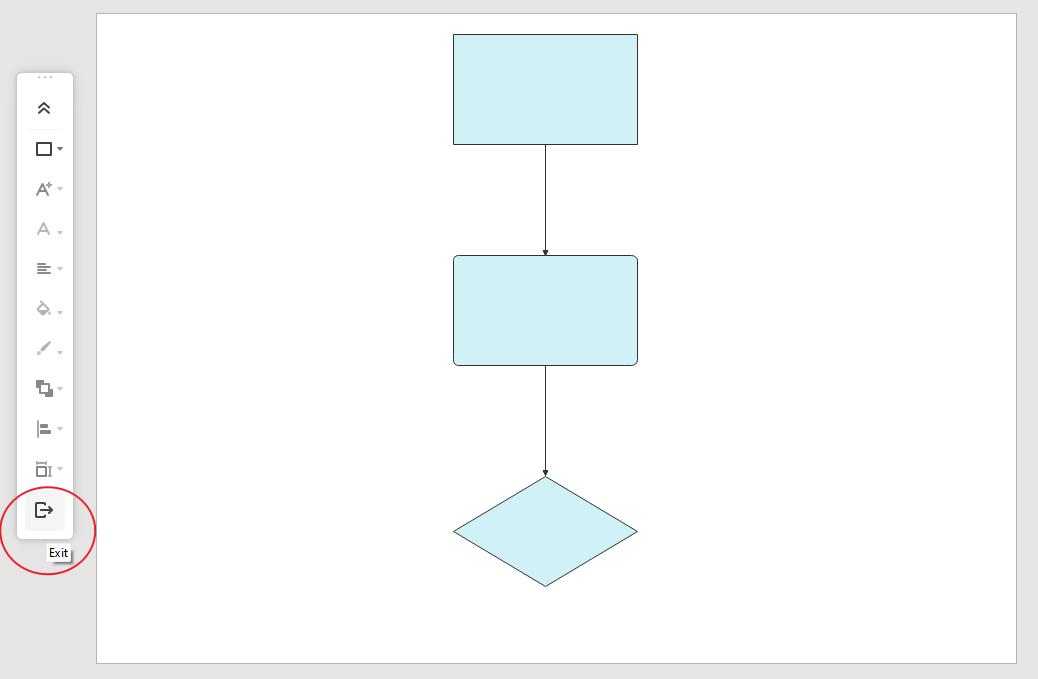
Focus Mode keeps you away from distractions and enables you to focus only on the diagram by switching the interface to the full-screen view. All important tools and libraries can be accessed from the floating toolbar on the left of the screen in the Focus Mode.
To turn on Focus Mode:
- Start a new document or open an existing one.
- Click Focus from the bottom-right corner or use the shortcut F11.
To turn off Focus Mode:
- Click the Exit button present at the bottom of the toolbox.
- Use the shortcut Esc.
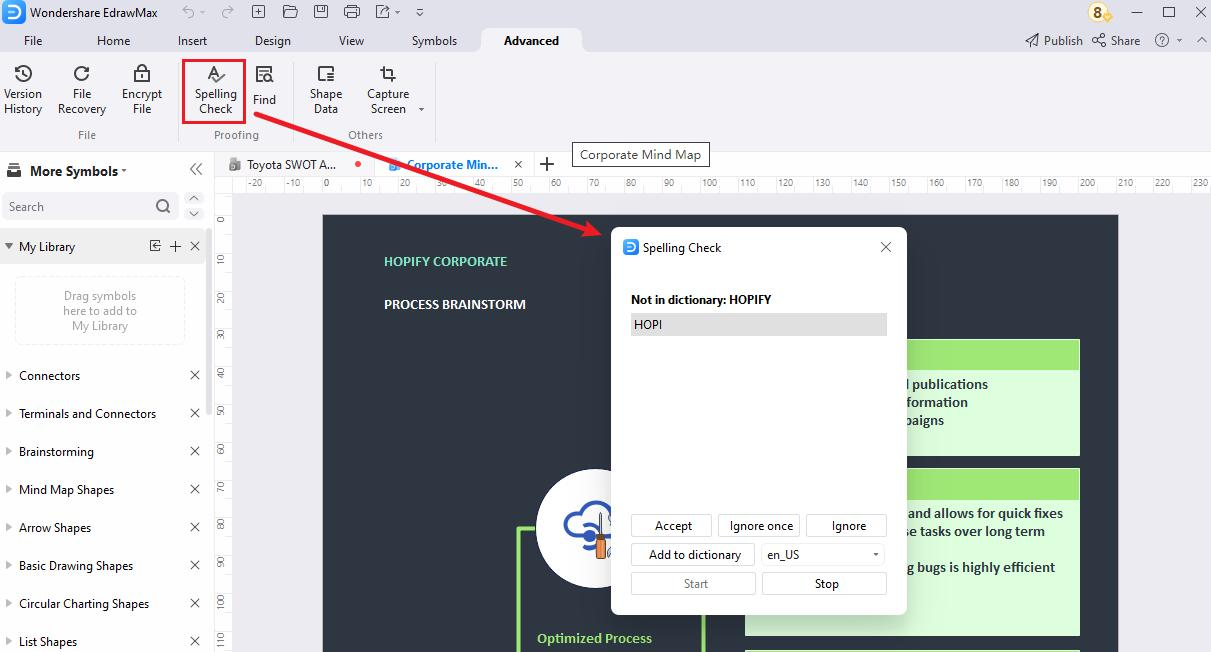
Spelling Check
- Open the file with a text or other content.
- Win: Select Advanced > Spelling Check or use the shortcut F7 to open the Spelling Check menu.
- From the bottom of the panel, you can use the available buttons to manage the misspelled word.
Mac: Select Home > Spelling Check or use the shortcut Fn + F7.
The buttons and their use are explained below:
- Accept – To replace the wrong word with the one that EdrawMax suggests. If there are multiple suggestions, you can click the one that you believe is contextually correct and then click the Accept button.
- Ignore once – To ignore the spelling error in the instance of the selected misspelled word and leave it unchanged.
- Ignore – To ignore the spelling error in all the instances of the misspelled word, regardless of the number of times it is present in the text.
- Add to dictionary – Add the misspelled word to EdrawMax's built-in dictionary, so the app doesn't consider the spelling incorrect anymore. The language of the dictionary can be selected from the drop-down list that is present next to the button.
- Start – To enable automatic spelling check.
- Stop – To stop automatic spelling check. In this case, you must check for the misspelled words manually.
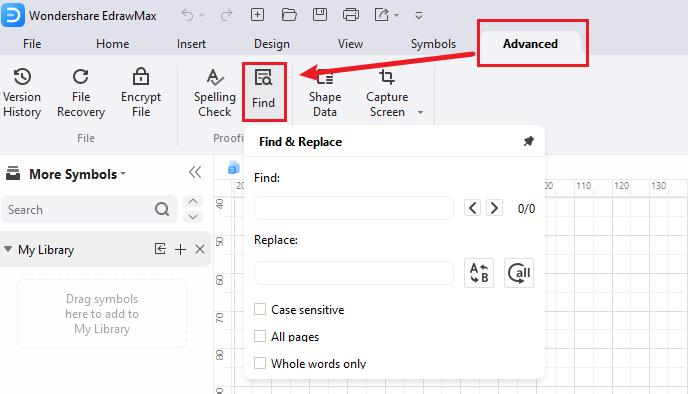
Find and Replace
- Open the file with a text or other content.
- Win: Select Advanced > Find or use the shortcut Ctrl + F to open the Find & Replace menu.
- In the Find field, enter the word that you want to replace.
- In the Replace field, type the word you want to replace with something else.
- Press the Replace or Replace all button next to the Replace textbox to replace the first instance of the word or all its instances in the entire text, respectively.
Mac: Select Home > Find & Replace or use the shortcut ⌘ + F (cmd + F) to open the Find & Replace menu.
You can fine-tune the replacement process with the help of the checkboxes that are present at the lower section of the Find and Replace panel. The following descriptions explain what these boxes do when checked:
- Case sensitive – Searches for and replaces the words that match the upper and lower cases. For instance, with this box checked, when you find the word 'Block,' it would ignore 'block' and find only the word with 'B' in the upper case.
- All pages – Searches and replaces the word across all the pages in the file.
- Whole words only – Searches only the entire word and not any part of it. For instance, if you search 'Block' with this box checked, the tool would ignore the words like 'Blocked,' 'Blocking,' etc.
Capture Screen
- Open the file or create a new one.
- Win: Select Advanced > Capture Screen or use the shortcut Ctrl + Shift + R to open the snipping tool.
- Win: Alternatively, select Advanced > Capture Screen > Capture Screen with Window Hidden or use the shortcut Ctrl + Shift + X to hide EdrawMax's interface and capture anything else that is present underneath it.
- Drag the mouse pointer across the area on the screen you want to capture a screenshot.
Mac: Select Home > Capture Screen or use the shortcut ⌘ + ⇧ + R (cmd + shift + R)
Mac: Select Home > Capture Screen > Capture Screen with Window Hidden or use the shortcut ⌘ + ⇧ + X / cmd + shift + X
Once the screen is captured, the options that are then available include:
- Undo – To discard the current capture and start over.
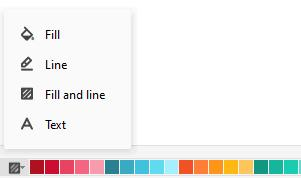
- Shapes, Line, and Text Tools – To draw shapes like rectangles, ellipse, etc., line, and add text to the captured snapshot.
- Copy – To copy the captured image to the clipboard.
- Save – To save the screenshot to your PC in PNG, JPG, or BMP format.
- Cancel – To discard the capture and exit the Capture Screen mode.
- OK – To accept the capture and place the screenshot on the canvas.
Create Presentation Slides
EdrawMax can automatically create presentation slides based on the project file's pages. It also helps you manually create slides out of different shapes or parts of a page, preview the slideshow, define the presentation's aspect ratio, and export the slideshow in PPTX format, which can then be opened in Microsoft PowerPoint for further inputs and slight modifications.
Auto-create Presentation Slides
- Open a file or create a new one.
- Add your preferred diagram to the canvas of the first page.
- Click the + (Add Page) button to add a new page and create the next diagram you want to have in the presentation.
- Repeat the process to add as many pages and diagrams as you need.
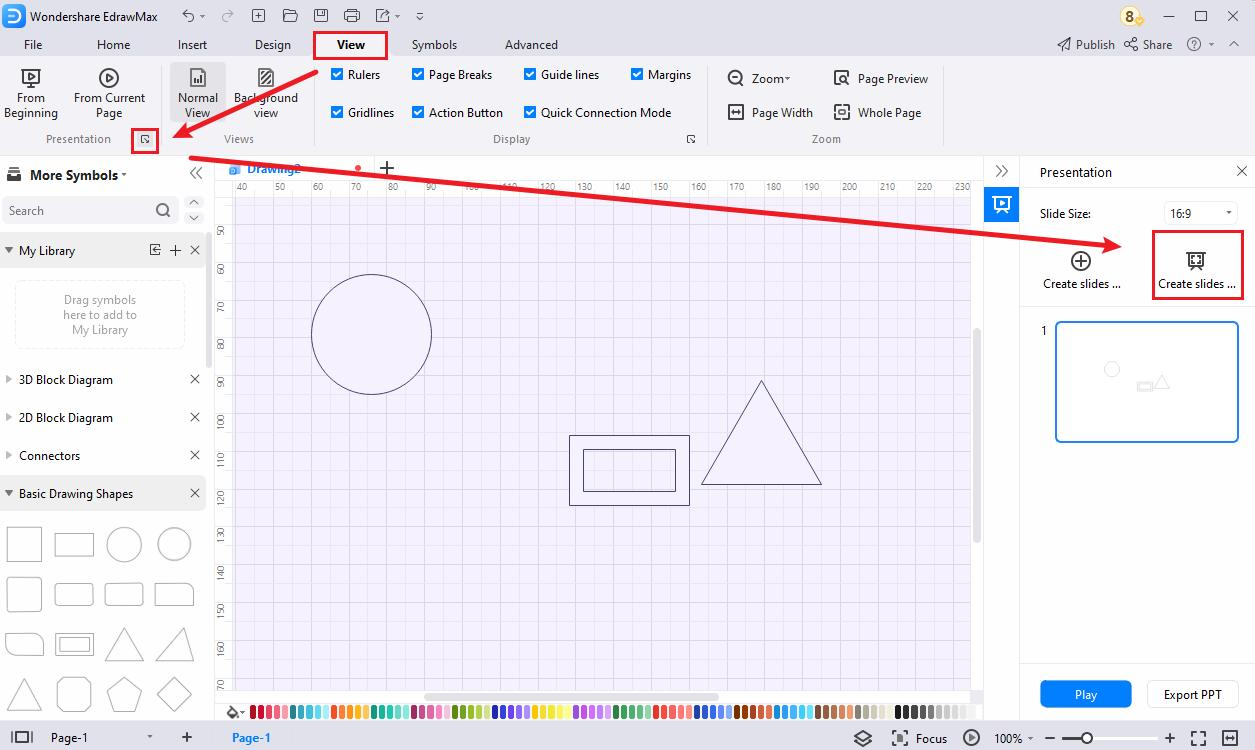
- Win: Go to View and click the launcher botton of Presentation group
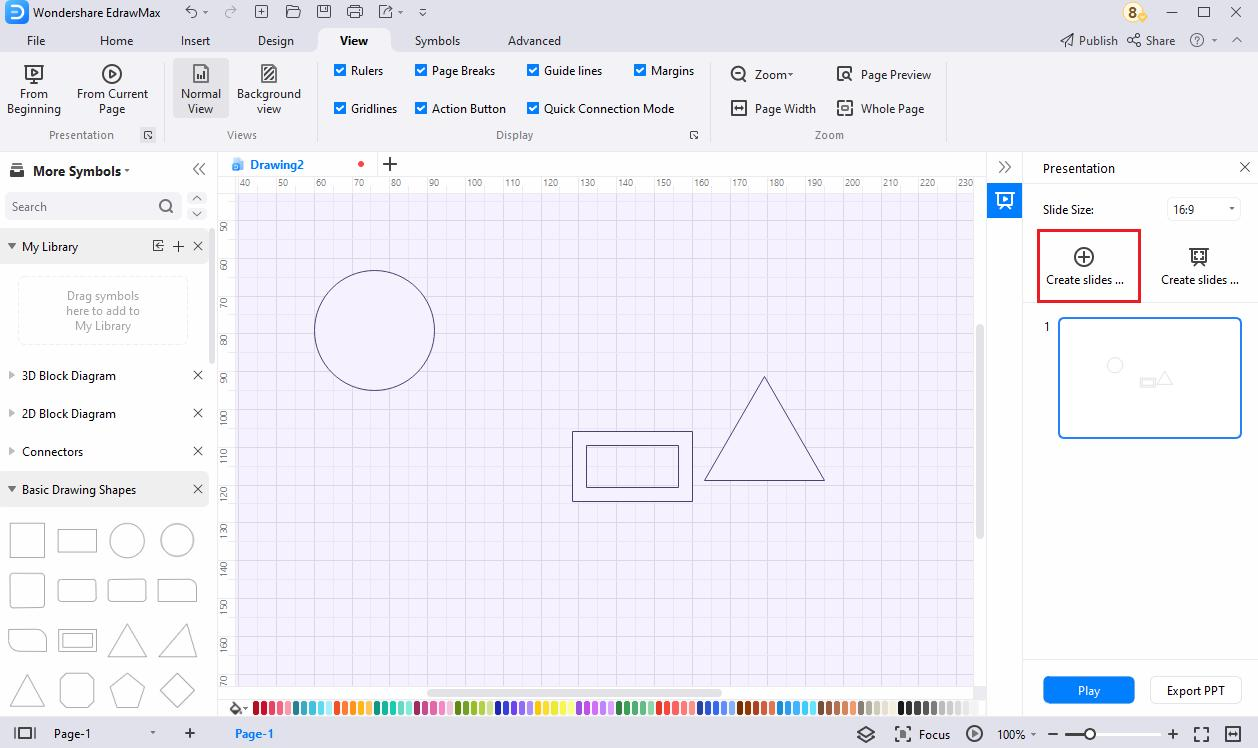
- Click Auto-Create presentation by pages to automatically create a presentation using each page as an individual slide.
- Click the Play button below the Auto-Create button to preview the slideshow before exporting.
Mac: Click the Presentation icon from the toolbox of the right pane.
Create Slides Manually
Manual slide creation doesn't require you to have multiple pages, and you can even create them out of different sections of a diagram on any page. The method is as follows:
- Open a file or create a new one and create a new diagram on the canvas.
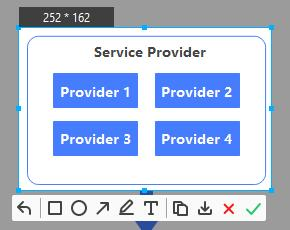
- Open the Presentation pane and click Create a slide by selecting any area of the page to add a section frame.
- Drag the selection frame over the area or shape on the canvas that you want to create a slide. If need be, use the corner handles of the selection frame to resize and cover the area you want to capture for the slide.
- Repeat the process to create as many slides as you need.
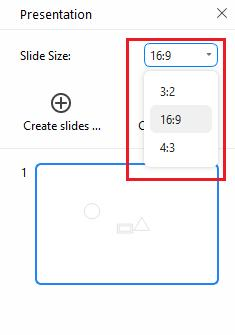
- Win: Change the slide size for the section frame.
Mac: Click the gear icon and change the aspect ratio for the section frame.
Export Presentation Slides
Exporting to PPTX enables you to view and edit the presentation in MS PowerPoint. The good thing is, you can even edit the shapes and captions of the exported presentation in PowerPoint as well.
- Create slides either manually or automatically.
- Click Export PPT from the bottom of the Presentation pane.
- Save the presentation in PPTX format.
Presentation Mode
Presentation mode saves people the extra steps of exporting and leaving the software. It makes EdrawMax itself a great presentation tool.
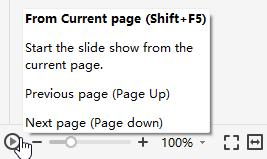
Present from the current page and do one of the following:
- Use the shortcut Shift + F5.
- Select View > From Current Page.
- Click the play button on the footer.
Present from the beginning and do one of the following:
- Use the shortcut F5.
- Select View > From Beginning.
The buttons in the presenter view and their use are explained below:

Select Symbols
Where to Find Symbols?
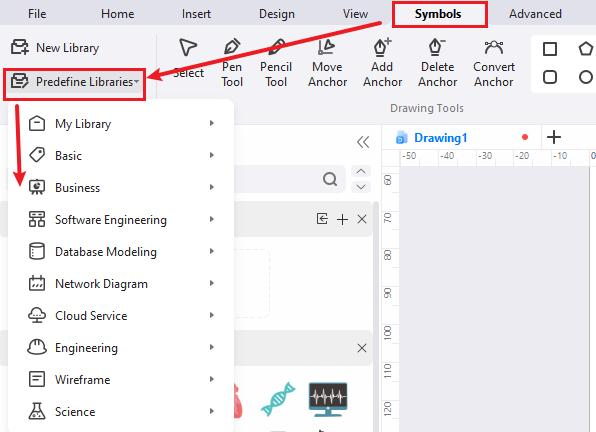
Do one of the following to open the menu of libraries and choose symbols you want:
- Select Symbols > Predefine Libraries on the ribbon.
- Open the Libraries pane on the left side of the canvas.
Select One Symbol
Note:
If you cannot select, move, resize, or rotate a symbol on your diagram, it might be protected.
- Open a file or create a new one.
- Simply drag a symbol from the library and drop them on the drawing page.
- Select Home > Select > Select to ensure the mouse cursor becomes an arrow.
- Click the symbol, and the cursor turns into a four-headed arrow.
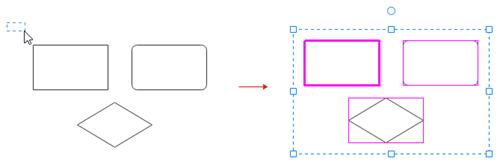
Select Multiple Symbols
Note:
The primary symbol in the selection box has a thick magenta outline, and you can press the Tab key to switch the outline into another symbol.
Do one of the following ways:
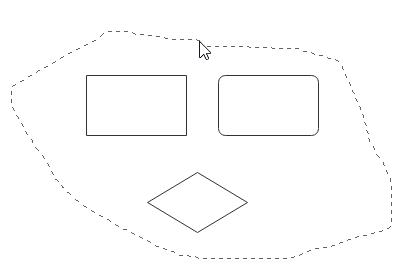
- Use area selection by clicking and dragging the mouse pointer on the page.
- Select Home > Select > Lasso Select Tool or use the shortcut Ctrl + Alt + 1 (Mac: ⌘ + ⌥ + 1 / cmd + option + 1) and drag a freeform lasso around the symbols that you want to select. Release the mouse point after you have surrounded symbols. The lasso doesn't need to be completely closed to select symbols.
- Hold down Shift or Ctrl while clicking symbols to select multiple symbols at once. You can also use these keys to add another shape to a current selection without deselecting.
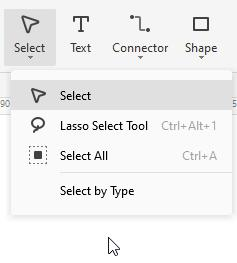
Select All Symbols
- Select Home > Select > Select All.
- Use the shortcut Ctrl + A. (Mac: ⌘ + A)
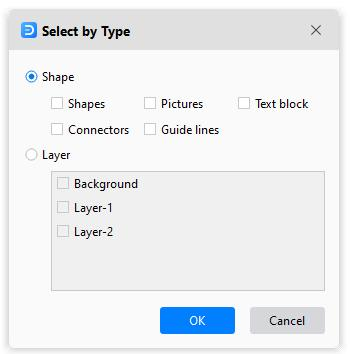
Select by Type
- Select Home > Select > Select by Type to open the Select by Type dialog box. Check the type of objects you want to select, such as symbols, pictures, or connectors, and then click OK.
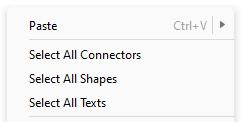
- Right-click on a blank area on the diagram and choose objects in the context menu.
Deselect Symbols
- Deselect one or multiple symbols when several are selected: Press Shift or Ctrl (Mac: ⇧ or ⌘ / shift or cmd) and click a symbol to cancel its selection.
- Deselect all symbols: Click a blank area on the diagram.
Move Symbols
There are several ways to move symbols as follows.
- Select a symbol and drag it to a new position.
- Select a symbol and press an arrow key to nudge the symbol.
- Select a symbol, hold down Shift and press an arrow key to move a symbol one pixel at a time.
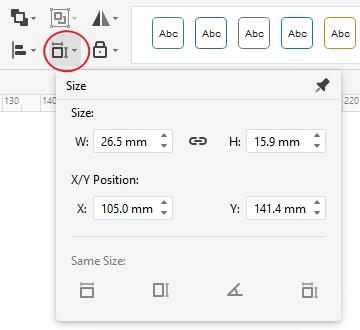
- Select a symbol, select Home > Size, and type in new values for X and Y.
Tip:
Use Dynamic Grid to help align with other symbols when moving a symbol. Select File > Options > Snap & Glue and select Dynamic Grid to turn it on.
Resize Symbols
There are several ways to resize symbols as follows.
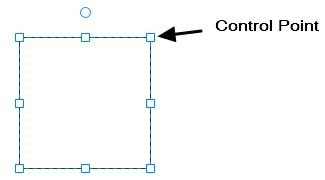
- Select a symbol and drag one of its control points or end points (for 1D shapes).
- Select a symbol, select Home > Size, and type in new values for W (width/length) and H (height).
- Select a symbol and drag a corner handle to resize it proportionally.
- Select a symbol and press the Ctrl key to resize the symbol without moving its center point.
- Select a symbol and press the Shift key to resize the symbol smoothly.
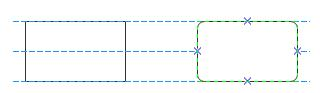
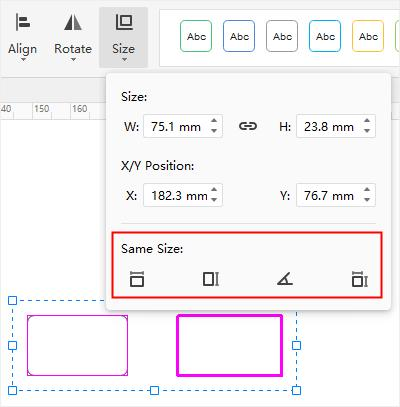
To make several symbols the same size, select the symbols, and the symbol as a reference has a thick magenta border. Select Home > Size > Same Size.
Same Width - keep symbols in the same width with the reference symbol.
Same Height - keep symbols in the same height with the reference symbol.
Same Angle - keep symbols in the same angle with the reference symbol.
Same Size - keep symbols in the same size with the reference symbol.
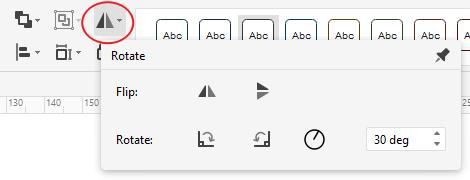
Rotate and Flip Symbols
There are several ways to rotate and flip symbols as follows.
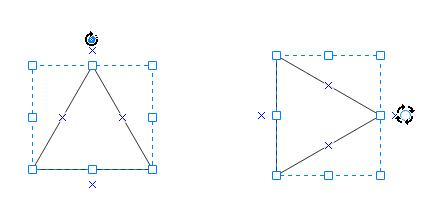
- Select a symbol and drag the rotation handle.
- Select a symbol, select Home > Rotate, and select either Rotate 90o clockwise (Win: Ctrl + R; Mac: ⌘ + R / cmd + R) or Rotate 90o counter clockwise (Win: Ctrl + L; Mac: ⌘ + L / cmd + L).
- Select a symbol, select Home > Rotate, and type in new values for Angle.
- Select a symbol, select Home > Rotate > Flip Vertical.
- Select a symbol, select Home > Rotate > Flip Horizontal.
Connect Symbols
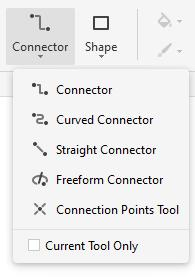
About Connectors
There are four different types of connectors: (Right-angle) Connector, Curved Connector, Straight Connector, and Freeform Connector. The connector means a connection line here.
A connection point helps "glue" connectors and the symbol. When you move a symbol connected with another one via a connector, the line will be automatically adjusted to keep symbols connected and the end points of the line glued on symbols.
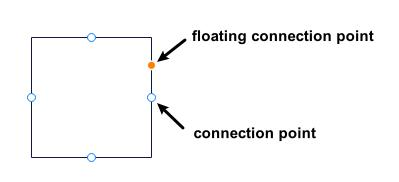
When you draw connectors, you will see two kinds of connection points – connection points and floating connection points. Both can be used to draw connectors from a symbol. The floating connection point changes position on the edge as the cursor moves, but the connection point is relatively fixed.
Automatically Connect Symbols
- Open the libraries of flowcharts, organizational charts, or mind maps and drag a symbol on the canvas.
- Point to the symbol and position to the arrow or plus that indicates the direction of the next symbol you want to add.
- Select the symbol you want to add and connect.
Manually Connect Symbols
- Select Home > Connector and choose a kind of connector. Select Current Tool Only to keep drawing connectors.
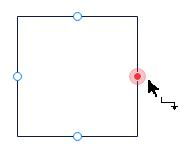
- Point to a symbol until you see the connection points around the edge.
- Select a connection point and drag to draw a line to a connection point on the symbol you want to connect to. The end points turn red when symbols are connected.
- Release the mouse button and repeat drawing connectors.
- Right-click on the canvas and choose All Connectors on the context menu to select all connectors.
Connection Points Tool
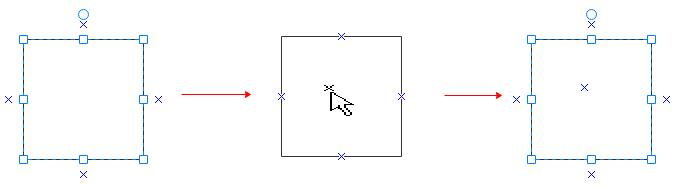
Add a connection point on a symbol
- Select a symbol.
- Select Home > Connector > Connection Points tool.
- Position the point where you want to add and click.
- Press the Esc key or select the select tool.
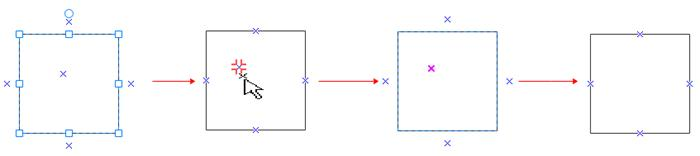
Delete a connection point
- Select a symbol.
- Select Home > Connector > Connection Points tool.
- Click and select the connection point (it turns magenta).
- Press Delete.
- Press the Esc key or select the select tool.
Move a connection point
- Select a symbol.
- Select Home > Connector > Connection Points tool.
- Click to select the connection point (it turns magenta).
- Drag and move the connection point to the new spot.
- Release the mouse button.
- Press the Esc key or select the select tool.
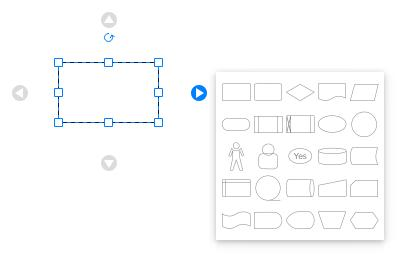
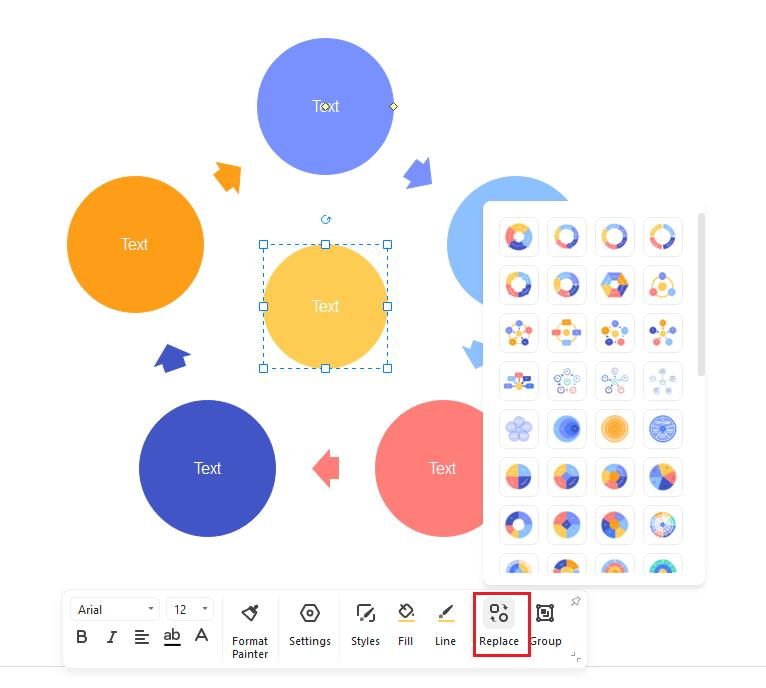
Replace Symbols
- Select the symbol you want to replace.
- Select Home > Change Shape
 or select Replace Shape on the right-click menu.
 - Choose the new symbol you need on the sub-menu.
- All text and formatting applied to the original symbol are applied to the new one.
Protect Symbols
Symbol protection allows you to prevent changes to symbol attributes and lock symbols from being selected. Thus, your diagrams can be protected from changes.
- Select a symbol in your diagram.
- Select Home > Lock
 to open the protection menu.
 - Select the symbol attributes you want to lock or clear the check marks for the attributes you wish to unlock.
The following table specifies the attributes of a selected symbol that you can lock or prevent changes.
| Symbol Attribute | Usage |
| Width | Lock the selected symbol's width to prevent resizing. To lock a 1D shape like a straight line against rotation, its width must be locked. |
| Height | Lock height of symbols to prevent resizing, and it's invalid for 1-D shapes. |
| Aspect Ratio | Lock the ratio between a symbol's height and width so its proportions won't change when you resize it. |
| X Position | Lock the X (horizontal) position of a symbol so it can't be moved. |
| Y Position | Lock the Y (vertical) position of a symbol so it can't be moved. |
| Rotation | Lock a symbol so that you can't rotate it. You can still rotate 1D shapes by dragging their end points, and you must lock their width to prevent rotation. |
| Begin Point | Lock the beginning point of a 1D shape to a specific location so it can't be moved. |
| End Point | Lock the end point of a 1D shape to a specific location so it can't be moved. |
| Ungroup | Lock the grouped symbol so that you can't ungroup it using the Ungroup command. |
| Edit Text | Lock the text in the symbol so that it can't be edited. |
| From Selection | Lock the symbol so it can't be selected. |
| From Deletion | Lock the symbol so it can't be deleted. |
| From Connector | Lock the symbol so it can't be connected. |
| Format | Lock the symbol so it can't be formatted. |
| From Group Formatting | Lock the formatting (color, fill, line, and shadow) in sub-symbols to not change if the grouped symbol is formatted. You can still format a sub-symbol by selecting it. |
| From Group Fill | Lock the fill in sub-symbols so that they do not change if the grouped symbol is formatted. You can still format a sub-symbol by selecting it. |
| From Theme | Lock the symbol, so it doesn't change if a theme is applied. |
| From Outline | Lock floating connection points of a symbol so they can't be glued. |
| None | Click Unlock All on the menu. |
Reorder Overlapping Symbols
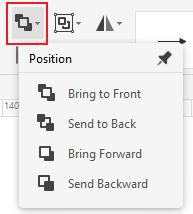
Do one of the following and bring the selected symbol in front of all other symbols.
- Go to Home > Position > Bring to Front;
- Win: Press Ctrl + Shift+ ] (right bracket).
- Click Bring to Front > Bring to Front on the right-click context menu.
Mac: Press ⌘ + ⇧+ ] (right bracket).
Do one following and send the selected symbol behind all other symbols.
- Go to Home > Position > Send to Back;
- Win: Press Ctrl + Shift + [ (left bracket).
- Click Send to Back > Send to Back on the right-click context menu.
Mac: Press ⌘ + ⇧ + [ (left bracket)
Do one of the following and bring the selected symbol forward.
- Select Home > Position > Bring Forward;
- Win: Press Ctrl + Shift + [ (left bracket).
- Click Bring to Front > Bring Forward on the right-click context menu.
Mac: Mac: Press ⌘ + ] (right bracket).
Do one of the following and send the selected shape backward.
- Go to Home > Position > Send Backward;
- Win: Press Ctrl + Shift + [ (left bracket).
- Click Send to Back > Send to Back on the right-click context menu.
Mac: Press ⌘ + [ (left bracket).
Align Symbols
The commands align symbols evenly spaced. Do as following procedures and choose an alignment direction.
- Select the primary symbol that you want the other symbols to align to.
- Press and hold Shift or Ctrl (Mac: ⇧ or ⌘ / shift or cmd) while selecting the other symbols you want to align with the primary symbol.
- You can press Tab to switch the primary symbol to other selected symbols.
- Click Home > Align and select the desired alignment direction.
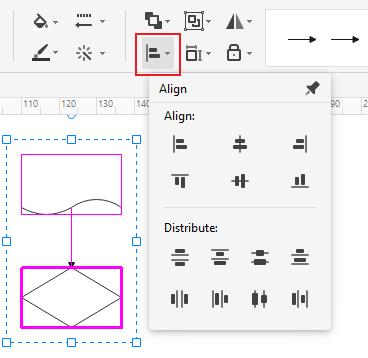
Distribute Symbols
Note:
If you don't select three or more symbols, the commands for distributing symbols are unavailable.
- Select three or more symbols by holding down Shift or Ctrl (Mac: ⇧ or ⌘ / shift or cmd) while clicking symbols.
- You can press Tab to switch the primary symbol to other selected symbols.
- Click Home > Align and select a distribution option.
- For vertical distribution, the boundaries are defined by the top and bottom shapes in the selection box.
- For horizontal distribution, the boundaries are defined by the leftmost and rightmost shapes in the selection box.
Group and Ungroup Symbols
Select two or more symbols by holding down Shift or Ctrl (Mac: ⇧ or ⌘ / shift or cmd) while clicking symbols or using the area selection tool. Do one of the following and group symbols.
- Select Home > Group > Group.
- Right-click a selected symbol and click Group > Group on the menu.
Select the group and do one of the following to ungroup symbols.
- Select Home > Group > Ungroup.
- Right-click the group and click Group > Ungroup on the menu.
Center Symbols
Do as following and center symbols on the drawing page.
- Select symbols you want to center by holding down Shift or Ctrl (Mac: ⇧ or ⌘ / shift or cmd)while clicking symbols or using the area selection tool.
- Right-click the symbol(s) and select Center on the menu.
Note:
If there is only one symbol, it will be moved to the center of the page. If there are several shapes, they will act as a group, and the center point of the group will move to the center of the page.
Draw Shape Tool
Draw Shape Tool on Home Tab
You can draw custom shapes using the rectangle, oval, line, and Bezier tools on the Home tab of EdrawMax. The shapes will contain default text blocks and connection points.
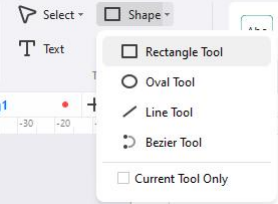
- Select Home > Shape and click the tool for the kind of shape you want to draw.
- Drag on the canvas to draw the shape.
- Select Current Tool Only, and you will keep drawing one kind of shape continuously.
- Click Select on the ribbon to stop drawing and turn the cursor into the arrow.
The following list specifies the usages of tools and what the cursor will be like.
- Rectangle Tool: the cursor will be
 ; you can draw rectangles or squares by dragging diagonally with the tool.
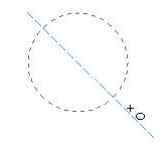
 - Oval Tool: the cursor will be
 ; you can draw ovals or circles by dragging diagonally with the tool.
 - Line Tool: the cursor will be
 ; the line will have a default arrow at the end, and you can change the styles.
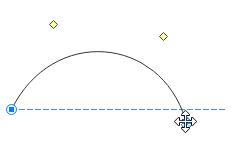
 - Bezier Tool: the cursor will be
 ; the line will have a default arrow at the end, and you can change the styles. You can drag the end points of the curve to change the direction. The yellow squares are used for changing the radian of the curve.
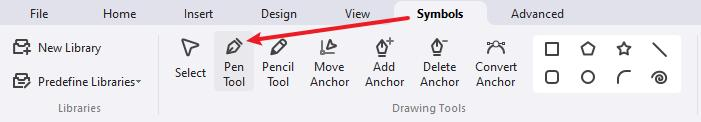
Draw Shape Tool on Symbols Tab
You can draw more custom-sized shapes with the Draw Shape Tool on the Symbols tab of EdrawMax. The shapes will not contain any default text block or connection points.
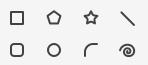
- Select Symbol and click the tools next to Convert Anchor for the kind of shape you want to draw.
- The cursor will be
 . Drag on the canvas to draw the shape.
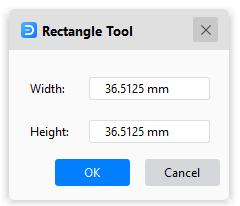
 - Double-click where the shape will be to open the property dialog box. You can type in values for width, height, length, angle, etc.
- Click Select on the ribbon or press Esc to stop drawing and turn the cursor into the arrow.
The following table specifies the usages of tools and what property dialog boxes would be like.
| Shape Tool | Usage | Dialog Box |
| Rectangle Tool | Draw rectangles. Draw squares by holding down Shift (Mac: ⇧) while dragging on the canvas. |
 |
| Polygon Tool | Draw polygons. | 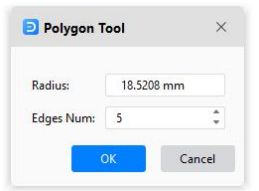 |
| Star Tool | Draw stars. | 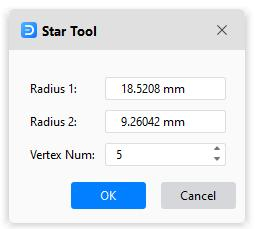 |
| Line Tool | Draw straight lines. | 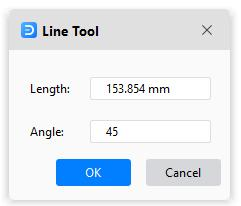 |
| Round Tool | Draw rounded rectangles. Draw rounded squares by holding down Shift (Mac: ⇧) while dragging on the canvas. |
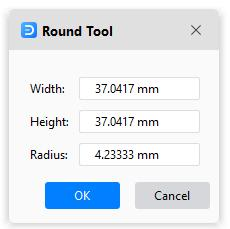 |
| Oval Tool | Draw ovals. Draw circles by holding down Shift (Mac: ⇧) while dragging on the canvas. |
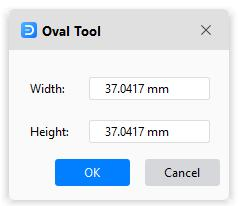 |
| Arc Tool | Draw arcs or curved lines. | 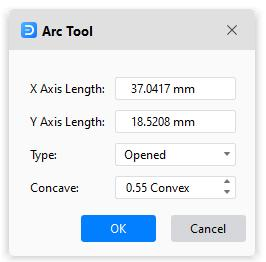 |
| Spiral Tool | Draw spirals. | 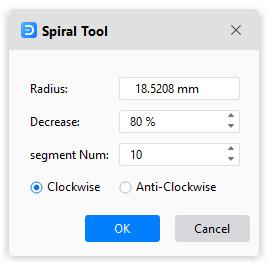 |
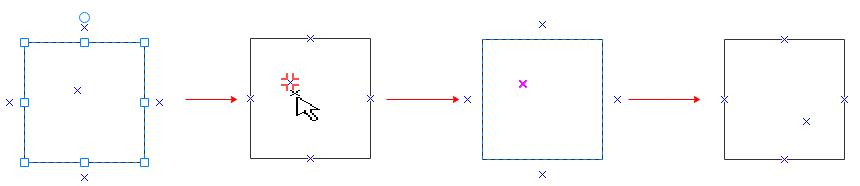
Path and Anchor Point
Before you use the Pencil or Pen tools, you need to know what paths and anchor points are, and then you will have more control over a graphic project.
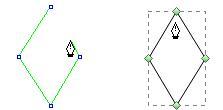
About Path
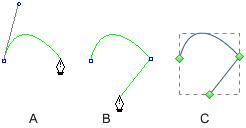
A path consists of one or more straight or curved segments. A basic path can be either open, like a wavy line, or closed, like a circle. You will see anchor points at the beginning and end of each segment. The starting and ending anchor points are called "end points " for an open path.
You change the direction and curvature by dragging the path's anchor points, the direction points at the end of direction lines that show at anchor points, or the path segment itself.
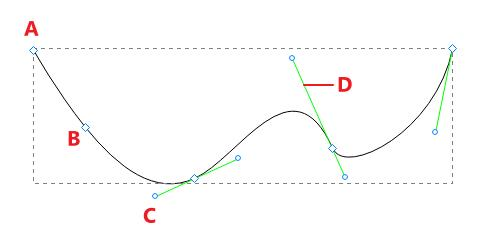
A. End point
B. Anchor point
C. Direction point
D. Direction line
There are two types of anchor points: corner points and smooth points. You can draw paths using any combination of corner and smooth points. At a corner point, a path can change direction unexpectedly. At a smooth point, a path continues as one smooth line.
Corner points can connect straight segments, curved segments, or a combination of the two. While smooth points always connect curved segments.
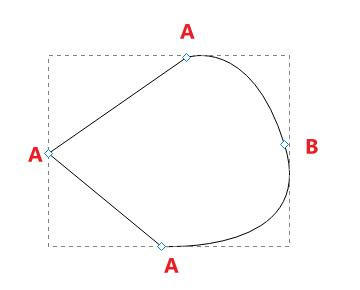
A. Corner point
B. Smooth point
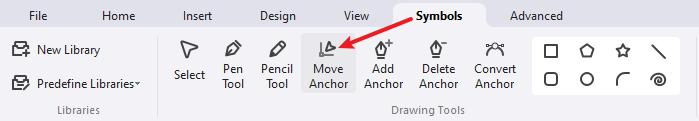
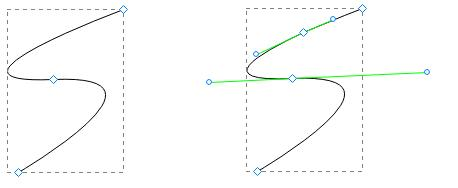
Move Anchor Points
- Select Symbols > Move Anchor or press Ctrl + M (Mac: ⌘ + M / cmd + M);
- Select the path or shape to see all anchor points.
- Click on the anchor point that you want to move.
- Drag the point and move to another spot.
Add Anchor Points
- Select Symbols > Add Anchor;
- Select the path or shape to see all anchor points.
- Move the cursor to the spot where you want the new anchor point to appear.
- Click on the spot and add a new anchor point.
Delete Anchor Points
- Select Symbols > Delete Anchor;
- Select the path or shape to see all anchor points.
- Click on the unneeded anchor point, and it will disappear on the path.
Convert Anchor Points
Using the Convert Anchor Point tool, you can convert anchor points on a path between corner points and smooth points precisely.
- Select Symbols > Convert Anchor or press Ctrl + Shift + M (Mac: ⌘ + ⇧ + M);
- Select the path or shape to see all anchor points.
- Move the cursor to the anchor point you want to convert and do one of the following:
- Convert a corner point to a smooth point: Drag the direction point out of the corner point.
- Convert a smooth point to a corner point without direction lines: Click the smooth point.
- Convert a smooth point to a corner point with independent direction lines: Drag either direction point.
- Convert a corner point without direction lines to a corner point with independent direction lines: Firstly, drag a direction point out of a corner point (making it a smooth point with direction lines). Then, release the mouse only, but don't release any keys you may have pressed to activate the Convert Anchor. Last, drag either direction point.

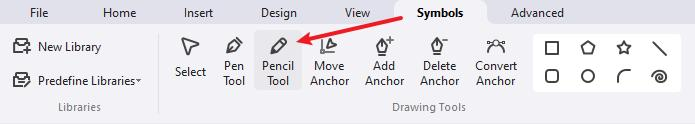
Pencil Tool
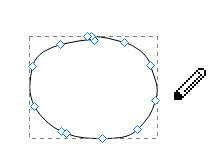
The Pencil tool lets you draw custom shapes as if you were drawing with a pencil on paper. It is useful for fast sketching or creating a hand-drawn look.
- Select Symbol > Pencil Tool. The cursor will look like a pencil.
- Drag on the canvas to draw the first segment of the shape.
- After you draw the first segment, there display anchor points.
- Click the anchor point at the end of the first segment you added, and drag to draw the second segment.
- Repeat the above process to get enough segments.
- To close the shape, drag the end point of the last segment that you create over the anchor point at the beginning of the first segment.
- Click Select on the ribbon or press Esc to stop drawing and turn the cursor into the arrow.
Note:
Only a closed shape can be applied to fill colors.
Pen Tool
The Pen tool allows you to create shapes or vector graphics with freeform paths. You can practice and duplicate most paths found in the real world by using the Pen tool.
Draw Straight Lines
- Select Symbol > Pen Tool. The cursor will look like a pen.
- Click and release on the canvas to create the first anchor point (do not drag).
- Move the pen, and you'll see a preview of the path you create. The first segment you draw will not be visible until you click a second anchor point.
- Keep clicking and releasing to create paths until you get what you want.
- Complete the path by doing one of the following:
- Move the pen over the first anchor point. Click or drag to close the path.
- To leave the path open, double-click anywhere on the canvas, select a different tool or choose Select.
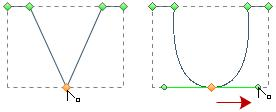
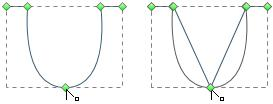
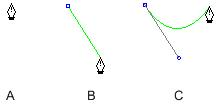
Draw Curves
You create a curve by adding an anchor point where a curve changes its direction and dragging the direction lines that shape the curve. The length and slope of the direction lines determine the shape of the curve.
Curves are easier to edit, display, and print if you draw them using as few anchor points as possible. Too many points can also introduce unwanted bumps in a curve. Instead, it's a good way to draw widely spaced anchor points and practice shaping curves by adjusting the length and angles of the direction lines.
- Select Symbol > Pen Tool. The cursor will look like a pen.
- Position the pen where you want the curve to begin. Hold down the mouse button, and the first anchor point will appear.
- Drag to extend direction lines. In general, you can extend the direction line to one-third of the distance to the next anchor point you plan to draw. You can adjust one or both sides of the direction line later.
- Release the mouse button but note that the first segment will not be visible until the second anchor point is drawn.
- Position the pen where you want the curve to end, and do one of the following:
- To create a C-shaped curve, drag in the direction opposite to the previous direction line. Then release the mouse.
- To create an S-shaped curve, drag in the same direction with the previous direction line. Then release the mouse.
- Continue dragging the Pen tool from different locations to create additional smooth curves. Note that you need to place anchor points at the beginning and end of each curve, not at the tip of the curve.
- Complete the path by doing one of the following:
- Move the pen over the first anchor point. Click or drag to close the path.
- To leave the path open, double-click anywhere on the canvas, select a different tool or choose Select.
Draw Straight Lines Followed by Curves
- Select Symbol > Pen Tool.
- Use the pen to click and create a straight segment.
- Position the pen over the end point that the curve starts. Click the anchor point and drag the direction line that appears.
- Position the pen where you want the next anchor point. Click and drag the new anchor point to complete the curve.
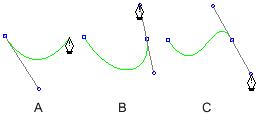
Draw Curves Followed by Straight Lines
- Select Symbol > Pen Tool.
- Use the pen to drag and create the first smooth point of the curved segment and release the mouse button.
- Reposition the pen where you want the curved segment to end, drag to complete the curve, and release the mouse button.
- Position the pen over the end point that the straight segment starts, move, and click to complete the straight segment.
A. Complete the curve; B. Move to the straight segment end; C. Finish drawing
Create Your Own Symbols
Make New Symbols
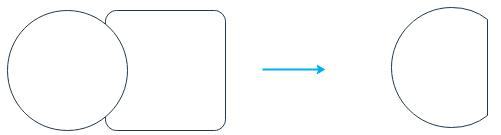
If the built-in symbol library in EdrawMax can't meet your needs, let's start making your own symbol! Navigate to the Symbols tab and select 2 or more shapes. Some options are used for making combined shapes.
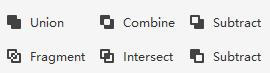
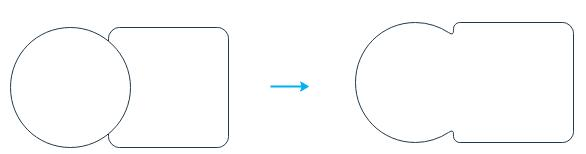
- Union: Make a symbol from several overlapping shapes, and the lines in the overlapped area will disappear.
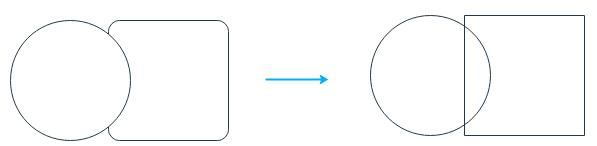
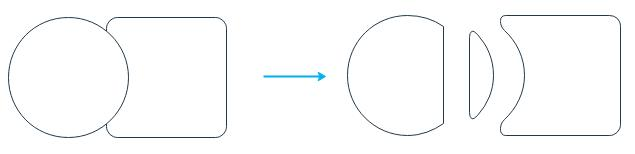
- Combine: Make a symbol from several overlapping shapes, and you can still see where these shapes are overlapped.
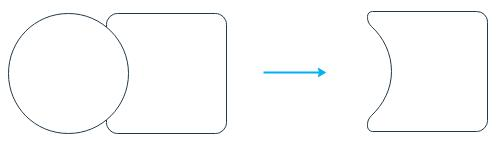
- Subtract (on the first line): Create a symbol by subtracting the overlapped area from the selected upper shape.
- Fragment: Divide multiple shapes into smaller parts based on intersecting lines or overlapping areas.
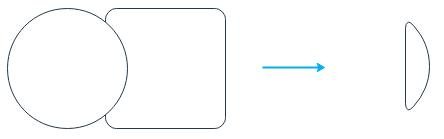
- Intersect: Create a symbol from the area where multiple selected shapes overlap.
- Subtract (on the second line): Create a symbol by subtracting the overlapped area from the selected lower shape.
Add Text Blocks
Select the symbol and do one of the following.
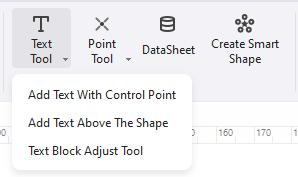
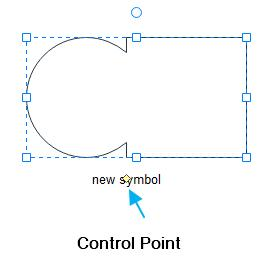
- Select Symbols > Text Tool > Add Text with Control Point, double-click the symbol, and a text block shows below. You can move the text box by dragging the control point.
- Select Symbols > Text Tool > Add Text Above the Shape; this option will add a text block above the symbol. You will not see the symbol, but the text block when you type words.
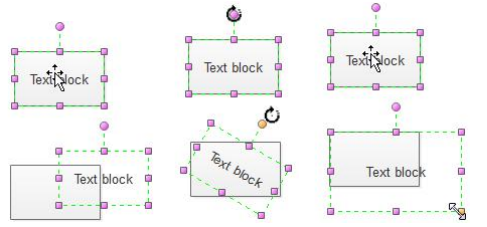
- Select Symbols > Text Tool > Text Block Adjust Tool, and you can move, rotate and resize the text block on the symbol.
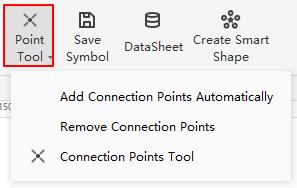
- Select Symbols > Point Tool > Add Connection Points Automatically, and four basic connection points will be added to the symbol.
- Select Symbols > Point Tool > Remove Connection Points. All connection points on the symbols will be removed.
- Select Symbols > Point Tool > Connection Points Tool, the cursor will look like a connection point, and you can choose to add additional connection points on the symbol.
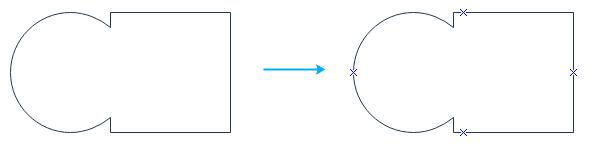
- Select Symbols > Save Symbol.
- The window for saving the symbol will open.
- Name the symbol and click Save.
- You will see a .ede file and a png file to save symbols. You can also import them into your symbol library.
Add Connection Point
Select the symbol and do one of the following.
Save Symbols
Don't forget to save your symbol when it is done!
Create Your Own Library
You can create your symbol library and add your favorite symbols to your editable libraries!
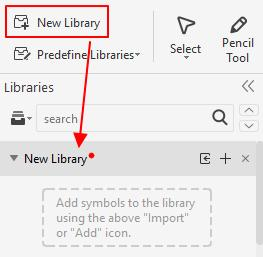
- Select Symbols > New Library.
- There will be a new blank library on the left library pane. (Rename it directly)
- Import your symbols by doing one of the following.
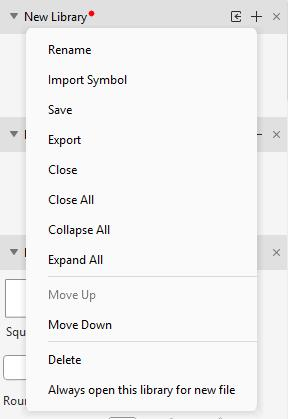
- Right-click the title and select Import Symbol on the context menu.
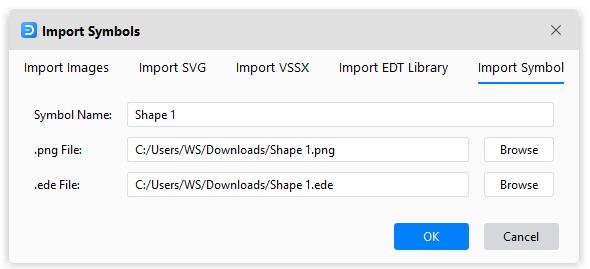
- Click the Import Symbols icon on the title bar to open the Import Symbols dialog box. In the Import Symbols dialog box, type the symbol's name, browse and select its .ede file and icon (.png). Click OK, and the new symbol will be added to the library. You can also import images, SVG files, and EDT/EDL files.
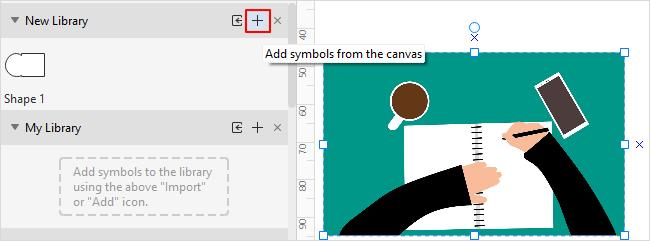
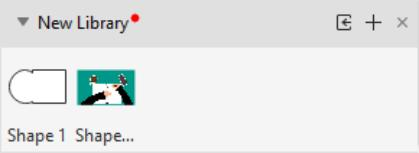
- Alternatively, another simple way is to add your symbols into the custom symbol library. Select the symbol, image, or SVG file on the canvas. Click the Add icon on the library pane.
- Right-click the title of New Library, and you can save and export the library as .edt files.
- When you open EdrawMax, you will see your custom symbol library on the top of the pane so that you can put your commonly-used symbols into your library.
Here, you can easily add all the symbols you want into your library!
Smart Shape
Create Smart Shapes by Yourself
EdrawMax makes it easy to create original smart shapes to enhance creativity in your diagramming, except for using built-in smart shapes.
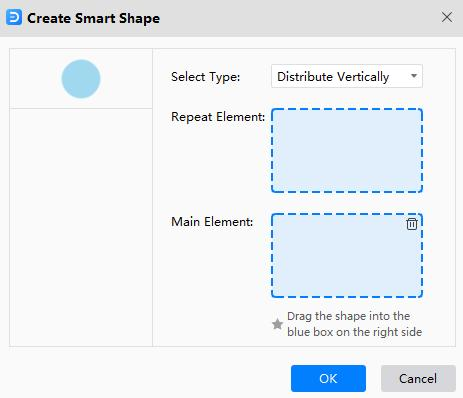
- Choose a basic shape and select Symbols > Edit Shapes > Create Smart Shape.
- Drag the selected symbols in the boxes, respectively. The Repeat Element means that the circle will be used several times. The Main Element will serve as the center in the formed smart shape.
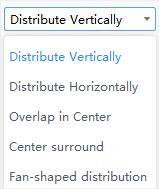
- Choose a custom type for your smart shape. Here I select the fourth one – Center surround.
- The new smart shape will look like the right part in the picture below. You can save it in your library when you finish making your smart shape.
Shape Data
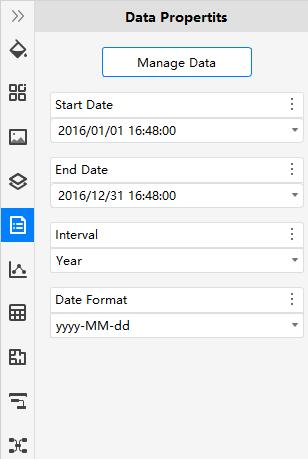
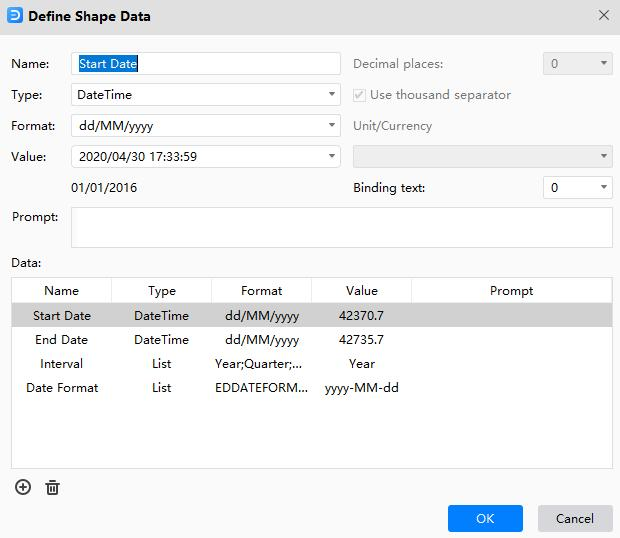
You will use this feature to add data or important information to symbols, which is useful for providing details. Shape data can show steps in a process or pieces of equipment in the diagram without filling up the diagram with text.
- Select a symbol on the drawing page.
- Right-click on the symbols and select Shape Data on the menu or press F8.
- The Data Properties pane opens.
- Click Manage Data, and the Define Shape Data window opens. Then you can build or change a data set for the selected symbol.
Format Symbols
Select the symbol you want to format and do one of the following.
- Select style options on the Home tab.
- Fill - Select a color or no fill to fill the symbol.
- Line Style – Select the line thickness or type of line.
- Line – Select the line color.
- Quick formatting – Quickly change the appearance of symbols in one click.
- Quick Style - Select a line and fill combination.
- Select a style option on the menu of the color bar. Position the cursor on the color and click to change the colors of fill, line, or both.
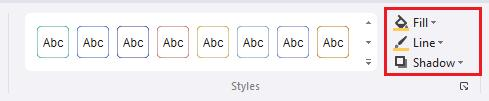
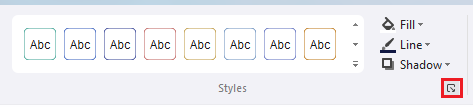
- Select Home > Styles > Dialogue launcher button to open the Style pane.
- Fill – Fill the selected symbol with a solid color, gradient, picture, or texture.
- Line – Pick the color, width, and line style for the symbol's outline.
- Shadow – Apply the shadow to the selected symbol.
Format Text
Add text to the drawing page and do one of the following.
- Double-click the area where you want to add text and type the text.
- Select Home > Text, drag to draw a text box, and type the text.
For adding text to symbols, see Add Text Blocks. Use these steps to set text formatting in a symbol, text box, or drawing page.
Format Text in One Symbol
- Double-click the text you want to edit.
- Select the text or specific sections you want to apply format changes. The selected text will be highlighted.
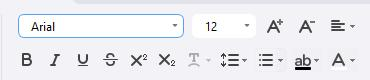
- Use the text format commands on the Home tab.
- Click a blank area on the page or press Esc to finish.
Format Text in Multiple Symbols
- To format specific symbols, select the first symbol by holding down Shift or Ctrl (Mac: ⇧ or ⌘ / shift or cmd) and clicking others. To format all the text, right-click on the canvas and choose All Texts.
- Use the text format commands on the Home tab.
- Click a blank area on the page or press Esc to finish.
Format Connectors
Format One Connector
- Select the connector.
- To change the look of the connector, do one of the following.
- Select Home > Quick Style and choose a style you want.
- Select Home > Line and choose a line color you want.
- Select Home > Line Style and choose width, begin/end arrow type, begin/end arrow size, dash type, and connector type.
- Open the Line tab on the Style pane and alter the look of connectors.
Format Multiple Connectors
- To format specific connectors, select the first connector by holding down Shift or Ctrl and clicking others. To format all connectors, right-click on the canvas and choose All Connectors.
- Use the line format commands on the Home tab or Style pane.
- Click a blank area on the page or press Esc to finish.
Themes
Apply a Theme to a Diagram
You can change colors and effects for all symbols at once by applying a theme.
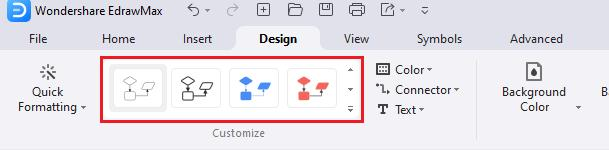
- Go to the Design tab.
- Hold your mouse pointer over a built-in theme to see a preview on the drawing page.
- Click the theme to apply it.
For preventing a theme from applying to a symbol, see Protect Symbols.
Create a Custom Theme
EdrawMax provides a set of built-in themes, but you can also create and edit custom themes. For example, you can create a custom theme to match your company's logo and branding.
- Select Design tab > Color > Customize Colors. In the Create New Theme Colors dialog box, select a combination of theme colors. In the Name box, type an appropriate name, and then click OK.
- Select Design tab > Color > Customize Connectors and choose the preset connector style or create a new one.
- Select Design tab > Color > Customize Text and choose the preset font style or create a new one.
Quick Formatting
Use Auto Formatting
The Auto Formatting feature enables you to automatically format your diagrams using the best possible theme style and colors.
- Open a file with the diagram.
- Select Design > Quick Formatting > Auto Formatting.
- Click the Auto Formatting option repeatedly to switch between themes and colors until you find the one that suits the project.
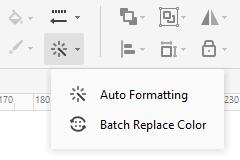
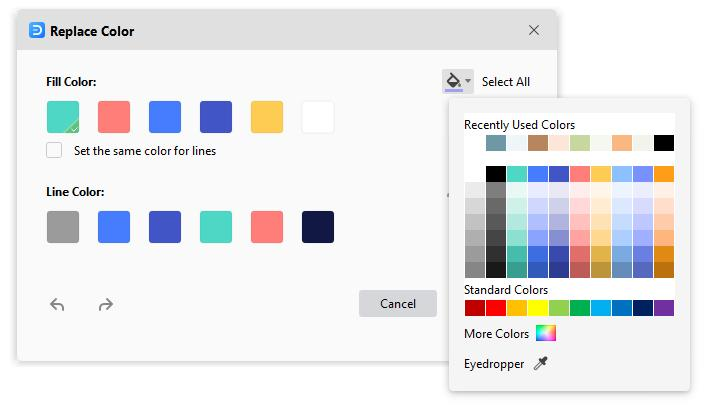
Batch Replace Colors
The Batch Replace Color enables you to change fill and line colors to all the symbols in the diagram in a single go. Furthermore, you can even choose whether the outlines (technically known as 'strokes') of the symbols should have the same or different colors than the one you used to fill symbols with.
- Open a file with the diagram.
- Select Design > Quick Formatting > Batch Replace Color.
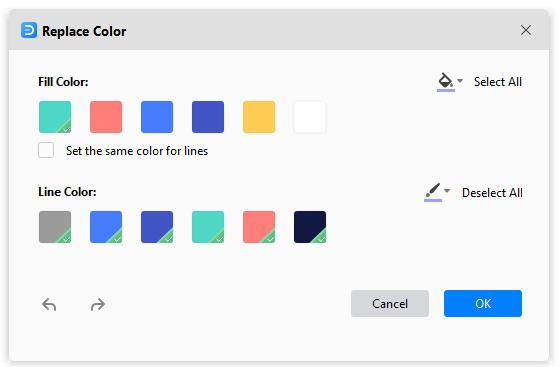
- Click and select a color from under the Fill Color section in the Replace Color dialog box. Optionally check the Set the same color for lines box to use the same color for the outlines of the symbols.
- Click the Bucket icon from the right side of the Fill Color section. Pick a color from the swatch to fill all the shapes at once.
- If you didn't check the Set the same color for lines box earlier, you could choose a different color for outlines by following the same procedure but using the options under the Line Color section. You can click Select All to select all colors once.
- Click OK to save the changes when done.
Insert Tables
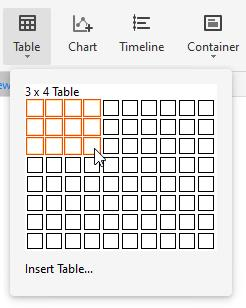
Insert a Table
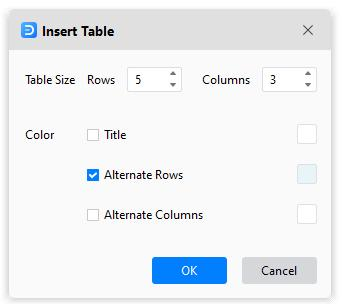
- Select Insert > Table .Move the cursor over the grid until you highlight the number of columns and rows you want.
- For a larger table or customize a table, select Insert > Table > Insert Table. In the Insert Table dialog box, type in the numbers of rows and columns you want.
Format a Table
Select the table, click the More icon on the mini toolbar, where you can
- Format the entire table by using options under Table Styles.
- Change table margins.
- Add or remove borders.
- Automatically add it up, calculate averages, pick up the maximum or minimum numbers.
- Add or delete a row or column.
- Merge or split cells.
- Distribute rows or columns.
Table Data
Select the table, click the More icon on the mini-toolbar, where you can
- Copy and paste data into the blank worksheet.
- Click cells of the worksheet and type numbers or text.
- Click Import to import the data file (XLSX, CSV).
- Click Export to export the table data into files (XLSX, CSV).
Insert Charts
Insert a Chart
- Select Insert > Chart.
- In the Insert Chart dialog box, choose a type of chart. These include column charts, bar charts, line charts, area charts, scatter charts, bubble charts, radar charts, pie charts, doughnut charts, rose charts, gauge charts, and funnel charts.
- Click OK.
Format a Chart
Select the chart, and you will see the mini toolbar where you can change the chart type, legend, axis color, label position and so on.
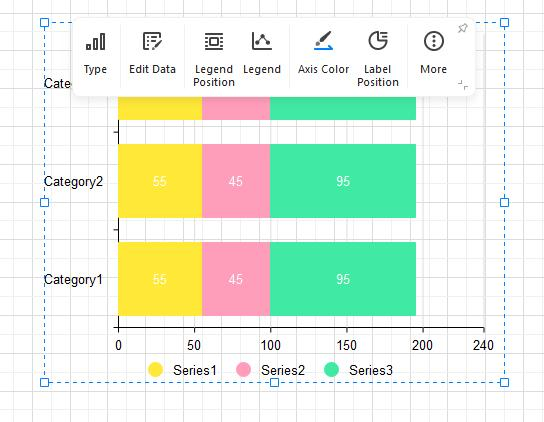
Chart Data
Select the chart, click the Chart icon to open the Data pane where you can
- Copy and paste data into the blank worksheet.
- Click cells of the worksheet and type numbers or text.
- Click Import to import the data file (XLSX, CSV).
- Click Export to export the table data into files (XLSX, CSV).
Insert Timelines
Inserting a timeline means creating a time-bound process workflow, where each date, month, or year in the timeline represented an instance when something noteworthy took place. For example, you can show how often the annual meetings were organized during the past decade.
Insert a Timeline
- Select Insert > Timeline.
- In the Insert Timeline dialog box, choose a horizontal or vertical timeline you want.
- Click OK.
Format a Timeline
Select the timeline, and you will see the Timeline mini toolbar. Depending on the timeline you create, the menus and options in the Timeline mini toolbar may vary. Choose the style options you want.
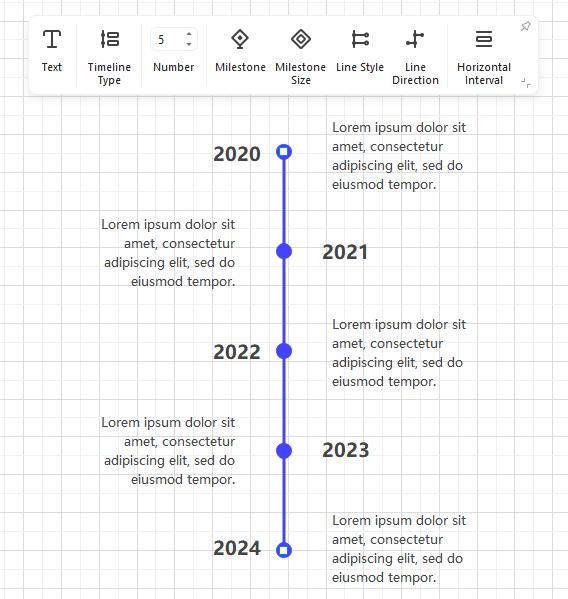
Nevertheless, some of the important input fields and menus that you can use include:
- Shape Numbers: This lets you add or remove the instances of the events from the timeline.
- Timeline Type: This lets you switch between horizontal and vertical timelines.
- Milestone Style: Enables you to choose between filled and hollow shapes representing milestones. This may vary. For instance, you will get the corresponding options if the diamonds represent milestones. Likewise, the 'Milestone Style' option will not be available if milestones are shown using other symbols or icons.
- Horizontal Intervals: These are available in some timelines and allow you to increase or decrease the horizontal spaces between the shapes that represent the instances.
- Vertical Intervals: Available in some timelines and let you increase or decrease the vertical spaces between the main Timeline and the labels or icons.
- Central Axis: This lets you choose the shape types for the instances in the relevant timelines.
- Symbol Inserter: This lets you choose the shapes of the symbols that represent the type of instances the timeline has. Some good examples of 'Symbol Inserter' would be an icon representing a Graduation degree, when a company was founded, etc.
- Connection Line: This lets you choose the type of connection lines used to connect the main timeline to the symbols representing the instances.
- Data: This option might be present under different labels and different names and lets you add or remove the instances from the timeline.
Insert Containers
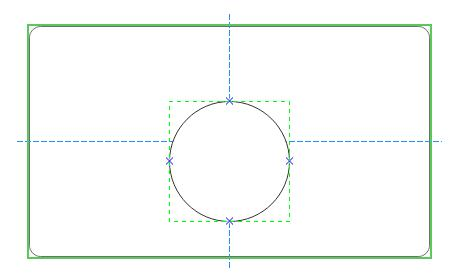
A container is a special symbol in EdrawMax that visually groups together logically-related symbols on the page. Visible grouping makes it easier to understand the structure of a complex diagram quickly.
Insert a Container
- Select the symbols you want to contain.
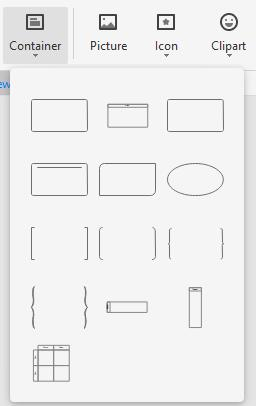
- Select Insert > Container.
- Hover the pointer over the container styles. Click to insert the container.
- To add symbols to a container, drag the desired symbol into the container – notice the green border – then drop the symbol in the container. The container's border highlight in green indicates that the symbol will be confined when you release the mouse button.
- You can format a container using the style options on the Home tab.
- Contained symbols have a specific relationship with the container and are affected by actions performed on the container.
Delete a Container
- To delete a container only, click on the container and press Delete.
- To delete shapes only, click on the shape with the container's border highlighted in green and press Delete.
- To delete a container and its shapes, select them all and press Delete.
Image Container
Except for the basic containers, EdrawMax also provides image containers (Symbol Library > General > Image Container), which will make it easy for you to make family trees and illustrate relationships between different people.
Simply add an image container on the page, select a picture and drag it into the container. The picture will fit into the container automatically.

Insert Pictures
Insert a Picture
- Select Insert > Picture.
- Locate the picture you want to insert, click the picture file, and click Open (the picture should be on your PC).
- If the image is oversized, there will be a dialog box that lets you decide whether to compress the image or not.
- Drag the picture to the location you want on the canvas.
- Drag a resize handle until the picture is the size you want.
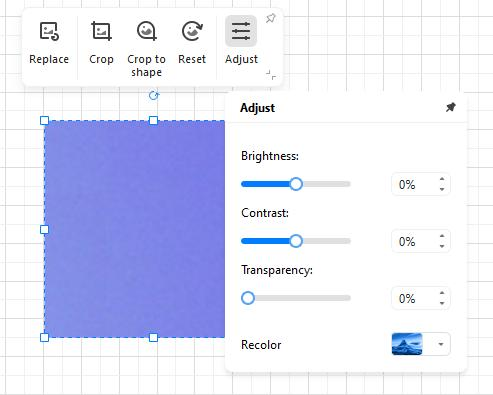
Adjust a Picture
Select the picture and you will see the Picture mini toolbar. You can change pictures, crop pictures to trim away unwanted parts, and adjust the picture's brightness, contrast, transparency, and color.
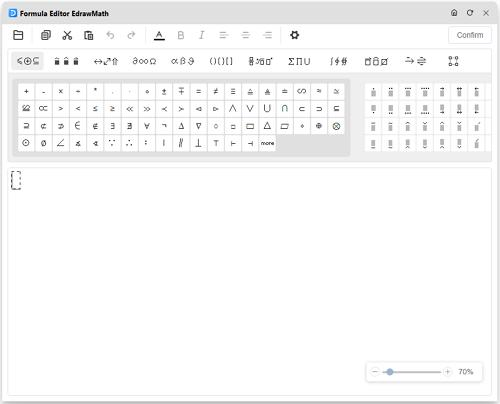
Insert Formulas
- Select Insert > Formula.
- In the pop-up Formula Editor window, type and edit the formula you need.
- Click Confirm.
- Double-click the formula on the canvas to open the editor again.
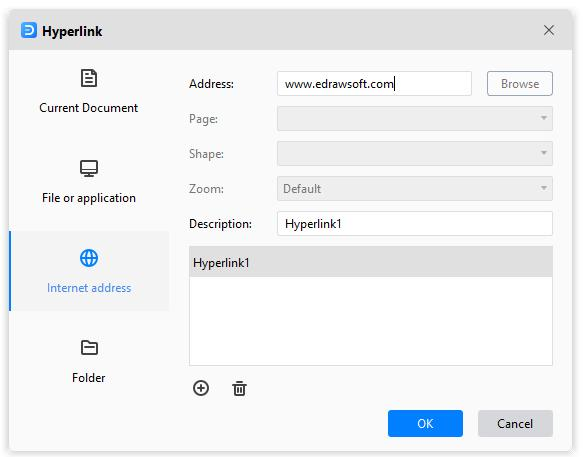
Insert Hyperlinks
- Select the symbol that you want to link.
- Select Insert > Hyperlink > Hyperlink or right-click on the symbol and select Insert > Hyperlink.
- In the pop-up Hyperlink dialog box, insert a hyperlink from the Current Document, File or application, Internet address, or Folder.
- Click the plus icon to add new hyperlinks and click the delete icon to delete hyperlinks.
- Click OK. You will see a web icon in the upper right corner of the symbol.
- To change a hyperlink, select the hyperlink in the hyperlink list, make the changes you want in the dialog box, and click OK.
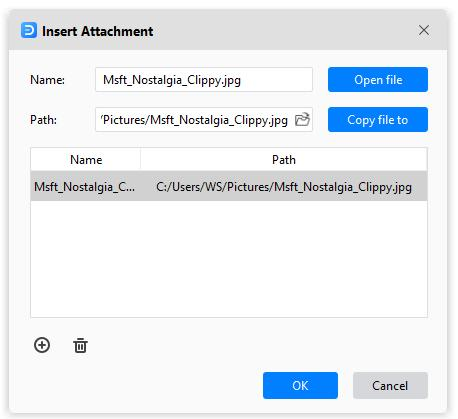
Insert Attachments
- Select the symbol that you want to insert a file.
- Select Insert > Attachment or right-click on the symbol and select Insert > Attachment.
- Click the folder icon, locate and click the file you want to insert, click the picture file, and click Open (the file should be on your PC).
- Click the plus icon to add new hyperlinks and click the delete icon to delete hyperlinks.
- Click OK. You will see a clip icon in the upper right corner of the symbol.
- If you don't need the attachment, just right-click on the icon and choose Remove.
Insert Notes
- Select the symbol that you want to insert a note.
- Select Insert > Note or right-click on the symbol and select Insert > Note.
- Type and format the text.
- Click OK. You will see a pencil icon in the upper right corner of the symbol.
Insert Comments
- Select the symbol that you want to add a comment.
- Select Insert > Comment or right-click on the symbol and select Insert > Comment.
- Type your comment.
- Click Send. You will see a comment icon in the upper right corner of the symbol.
- To read a comment, click the comment icon. The comment opens.
- To close the comment, click on a blank area of the page.
AI Flowchart/Mind Map/List/Table
AI Flowchart
EdrawMax harnesses the capabilities of artificial intelligence to effortlessly generate professional flowcharts, saving you time and effort.
Follow the steps below to generate flowcharts with Edraw AI, our AI assistant:
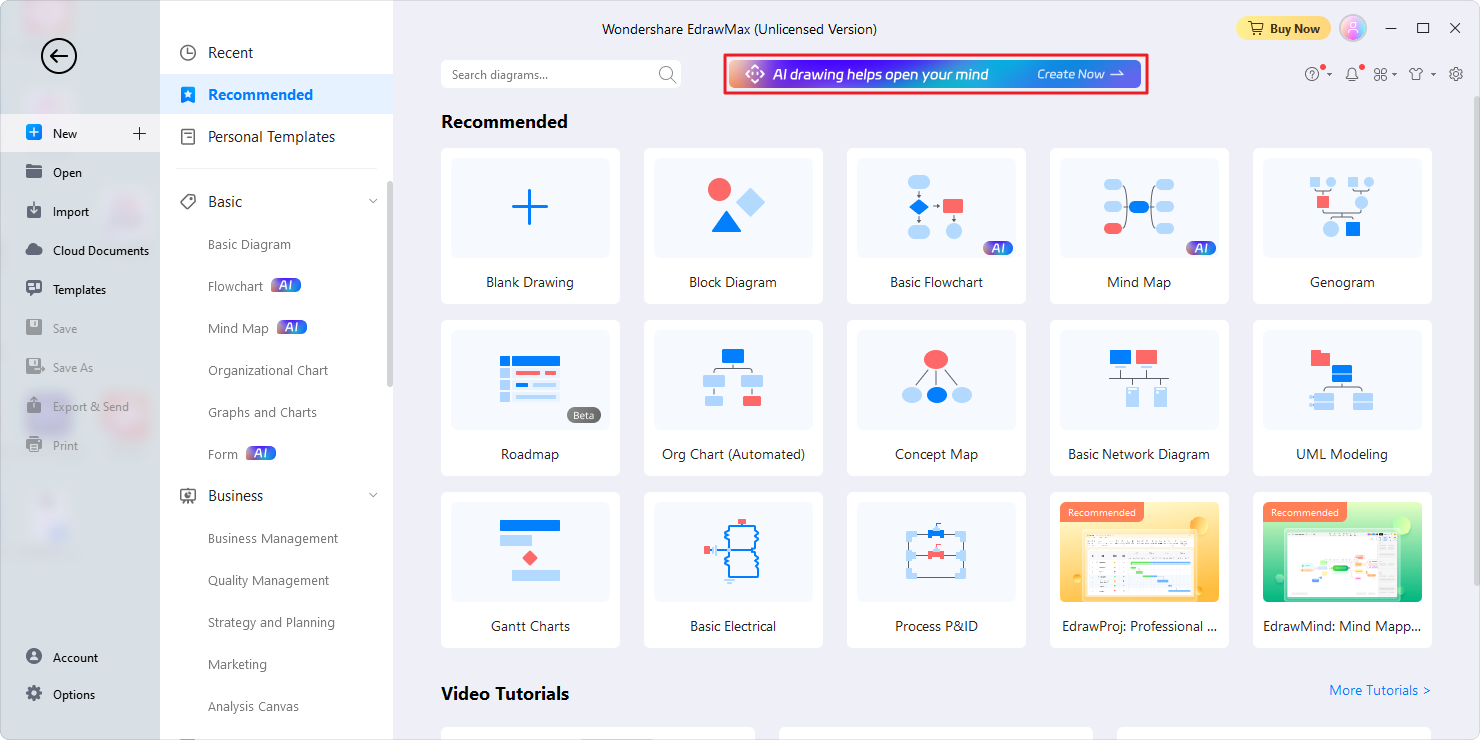
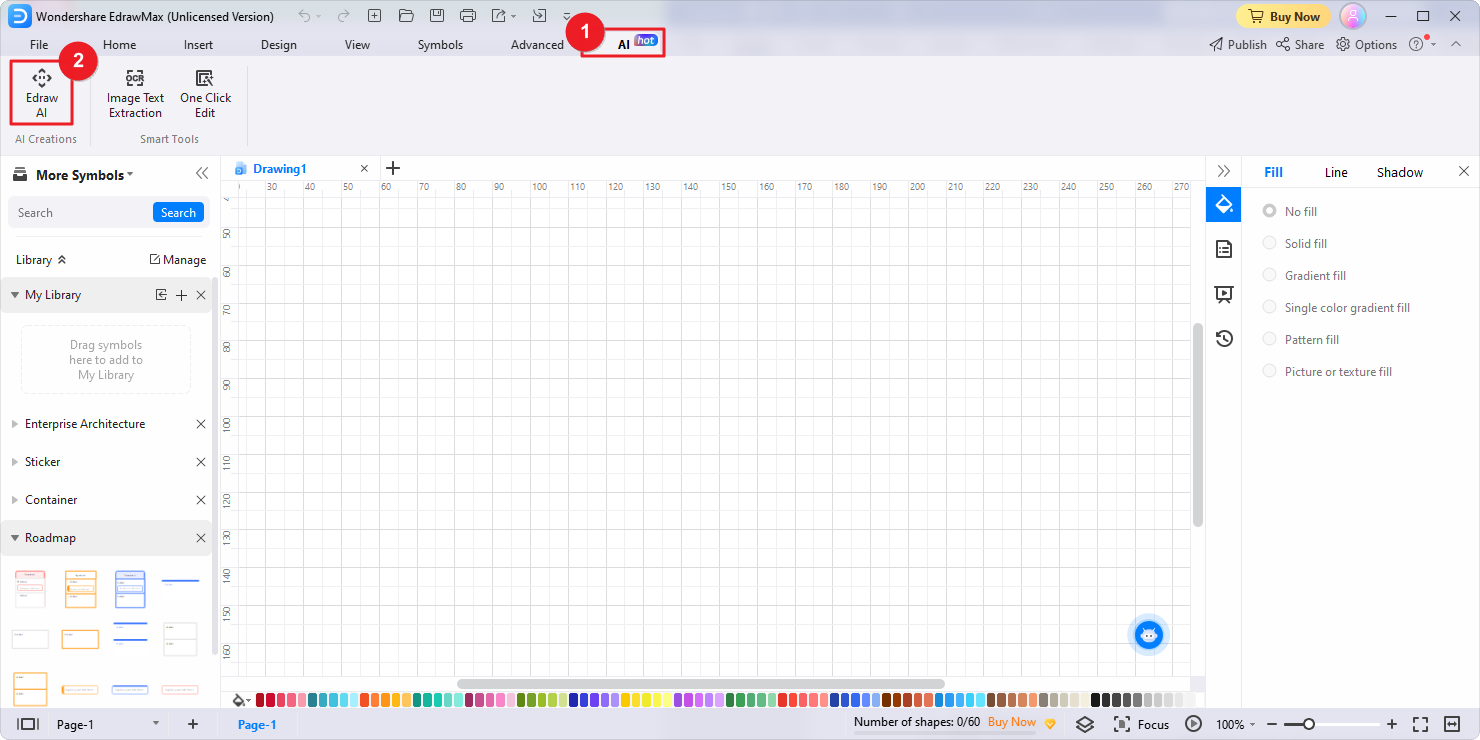
1. Access Edraw AI:
- To open the Edraw AI window, click on the Edraw AI tab located at the top of the homepage.
- Alternatively, you can initiate Edraw AI by selecting the AI menu from the top ribbon.
- Another option is to click on the Edraw AI icon positioned at the lower right corner of the canvas.
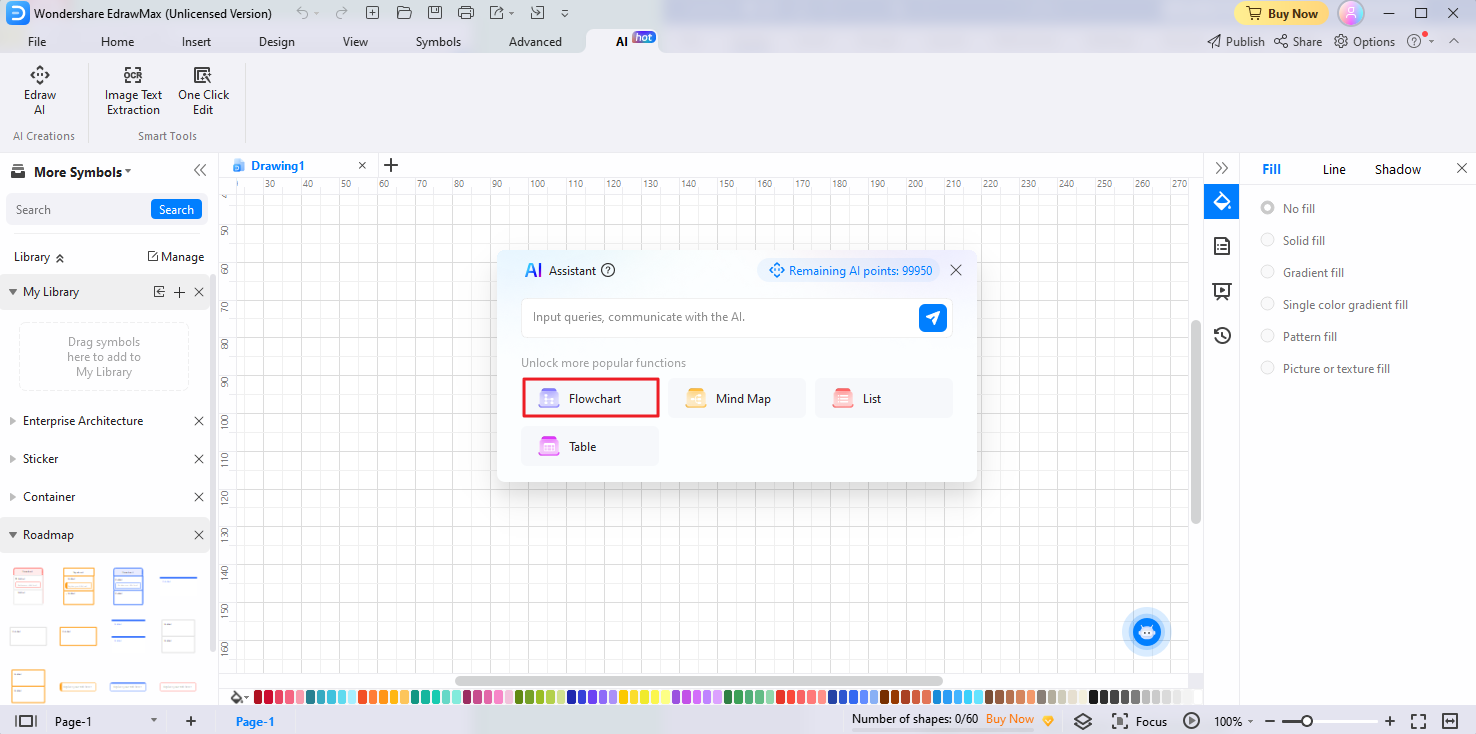
2. Select Flowchart:
In the popup Edraw AI window, click on the Flowchart option. This indicates that you want to create a flowchart.
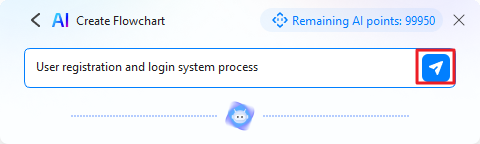
3. Enter Your Command:
Enter a descriptive command for your flowchart, such as "User registration and login system process." This helps Edraw AI understand your requirements. click the blue Send button.
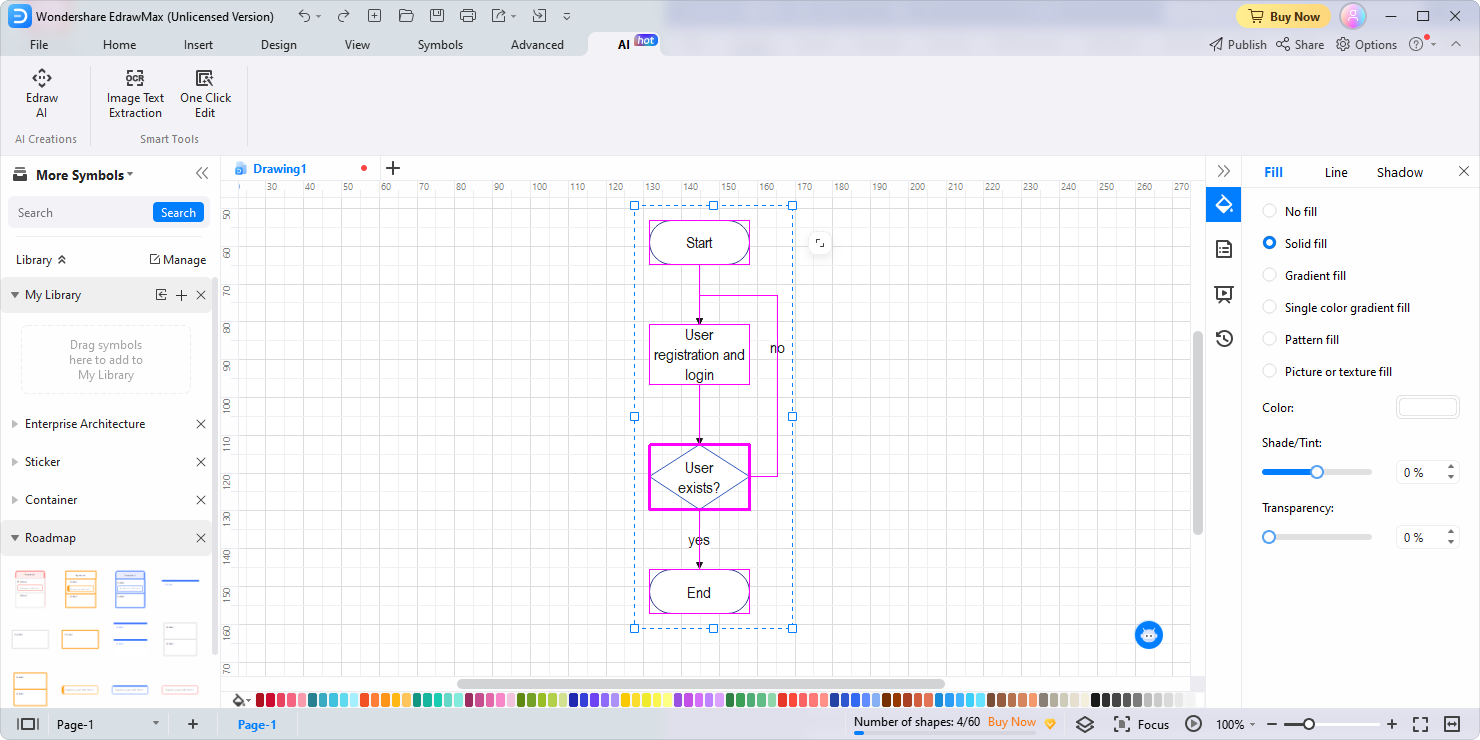
4. Tailored Flowchart Generation:
Edraw AI will process your command and generate a customized flowchart that aligns with your instructions. The AI algorithms intelligently arrange shapes, lines, and connectors to create a clear and concise flowchart. Once the flowchart is generated, you have the freedom to make any necessary manual edits to the generated flowchart, customize its appearance and add designs to enhance its visual appeal.
AI Mind Map
EdrawMax can also generate mind maps with artificial technology. Its AI assistant, Edraw AI enables users to transform their ideas into visually engaging and organized mind maps with ease.
Follow the steps below to create mind maps with ease:
- To begin, open the Edraw AI window using one of the three available methods mentioned above: a. Homepage Edraw AI Tab; b. AI Menu; c. Edraw AI Icon.
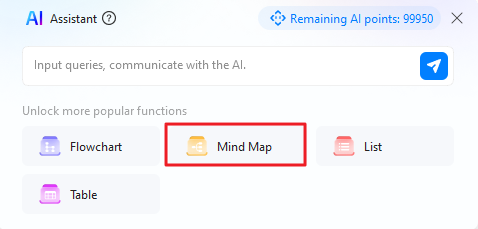
- Once you have opened the Edraw AI window, choose the Mind Map option.
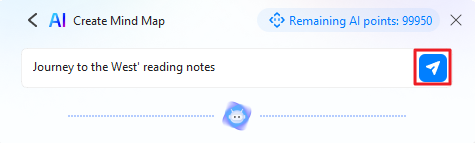
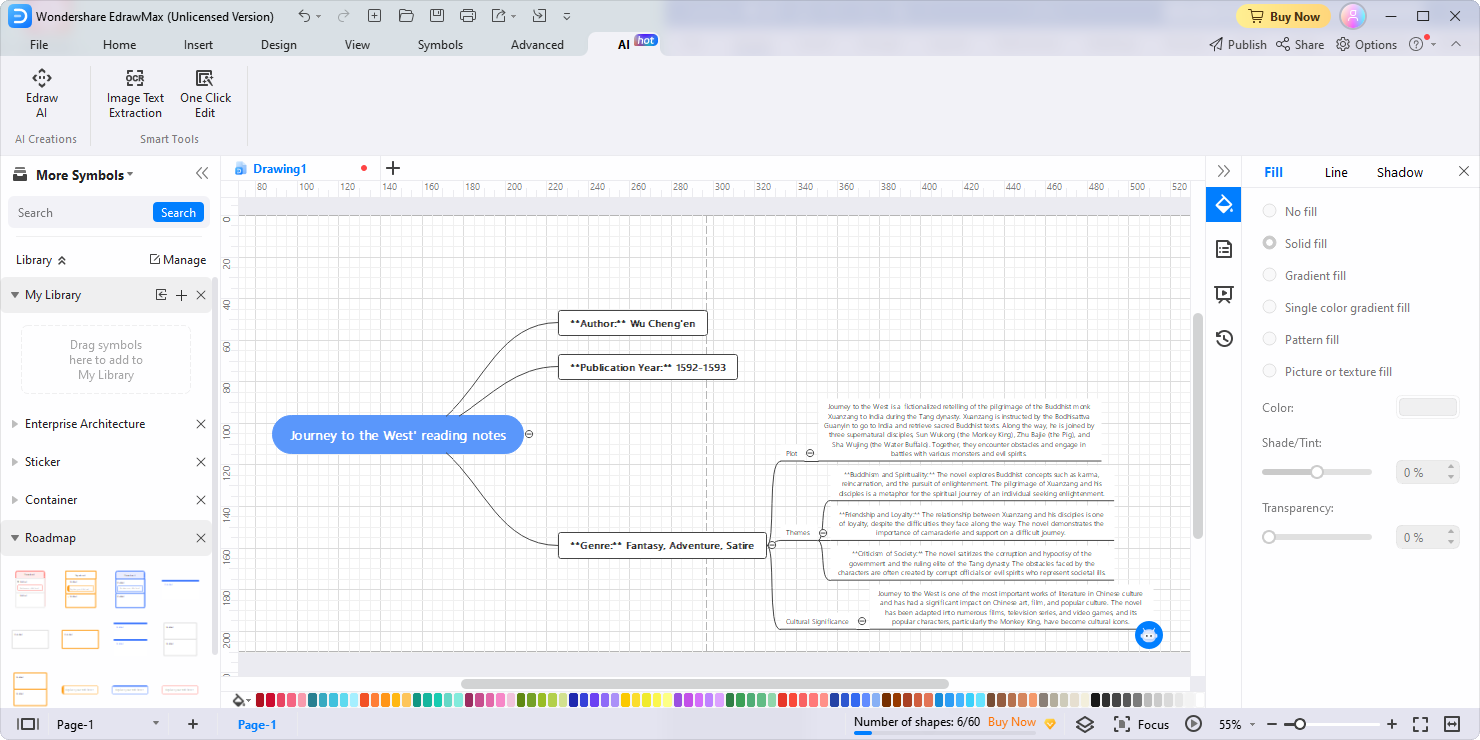
- Enter a descriptive command for your mind map, such as "Journey to the West' reading notes." Click the blue Send button to submit it to Edraw AI for analysis.
- Edraw AI will intelligently arrange nodes, establish connections, and organize information, resulting in a visually appealing and well-structured mind map.
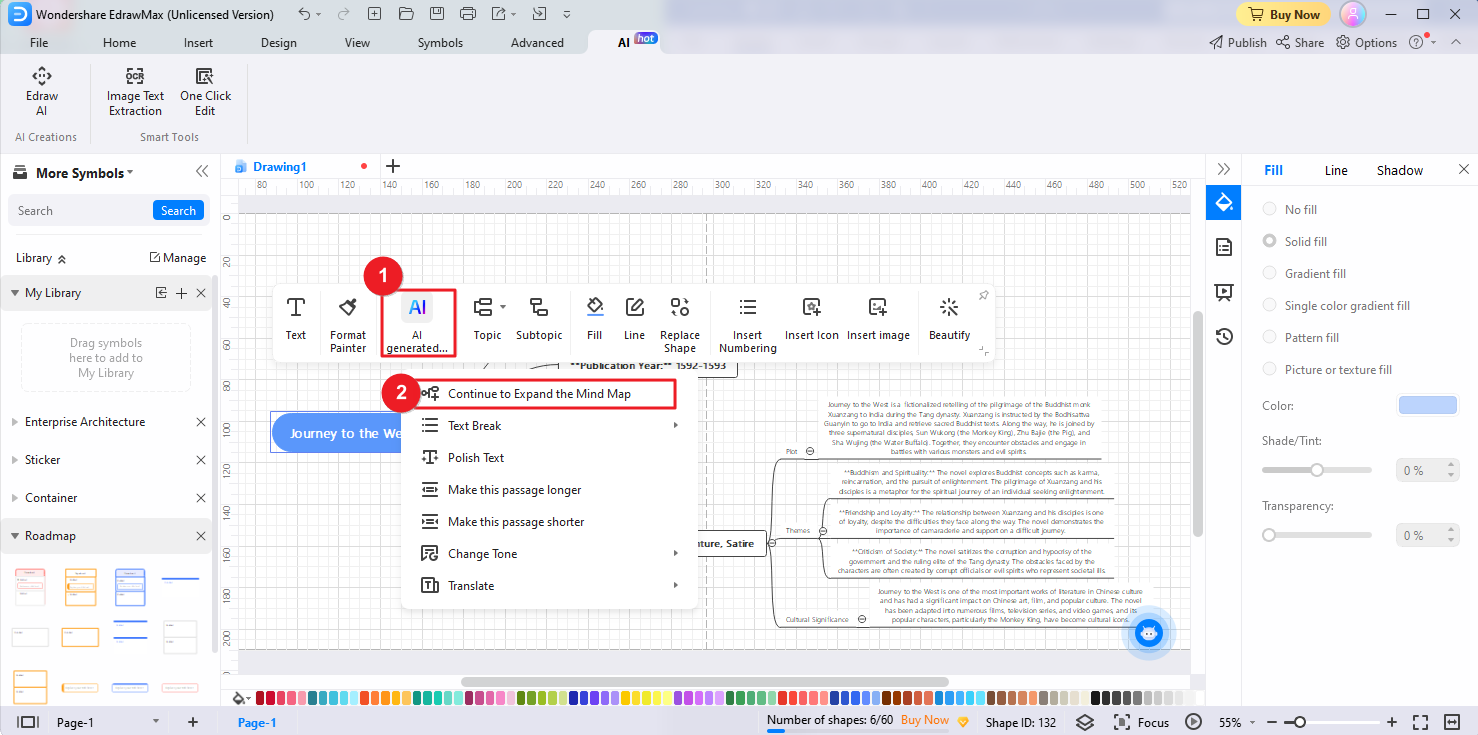
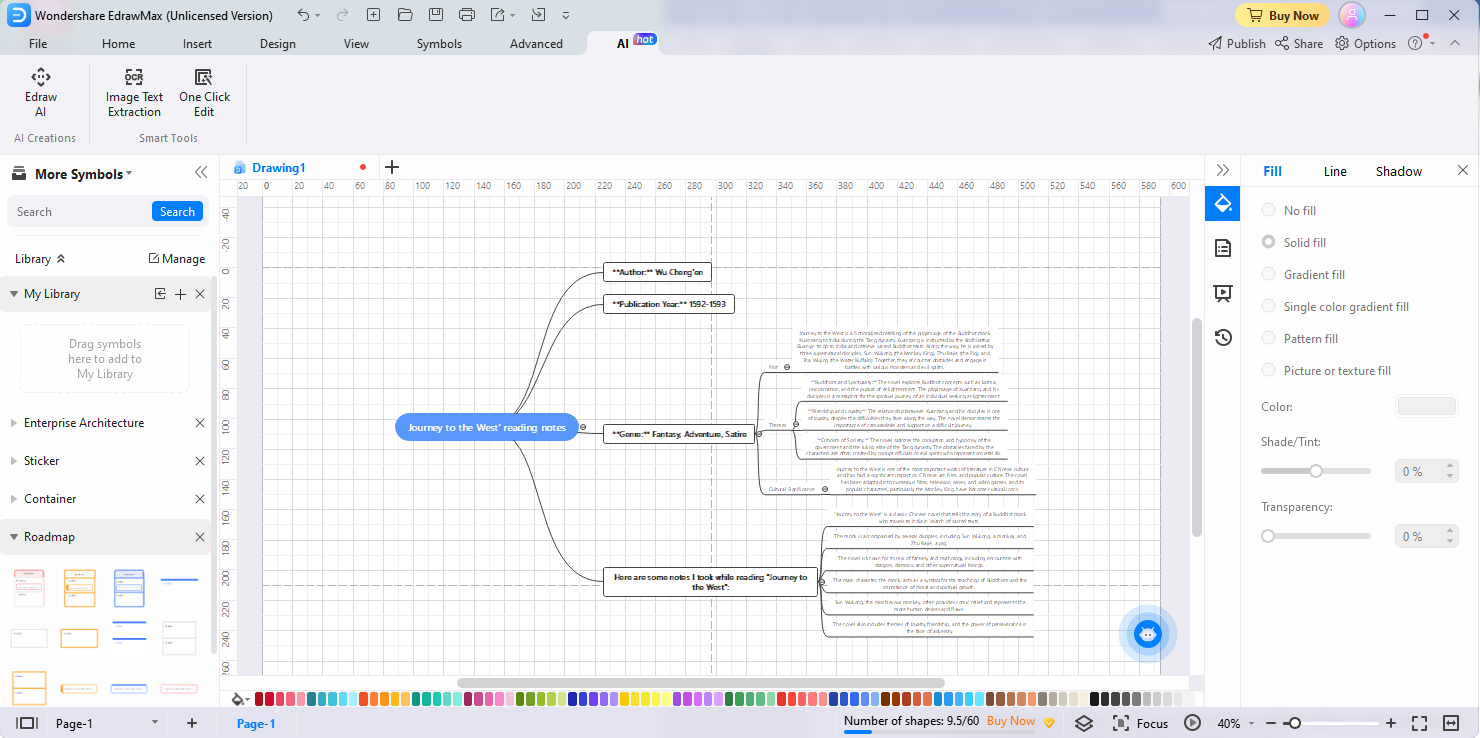
- After your mind map is generated, review the topics within it. Identify the specific topic you want to expand or explore further. In the floating bar of EdrawMax, click on the AI generated content option, and select Continue to Expand the Mind Map. Edraw AI will analyze the selected topic and generate new branches, subtopics, or connections to expand the mind map.
- EdrawMax offers a range of customization options to tailor your mind map according to your preferences. You have the flexibility to manually edit the mind map, making any necessary adjustments or additions. Moreover, EdrawMax provides design tools and features to allow you to modify the designs, styles, and formatting of your mind map.
AI List
With the assistance of Edraw AI, creating well-organized lists has never been easier. Follow the steps below to generate and customize lists with ease:
Follow the steps below to create lists with ease:
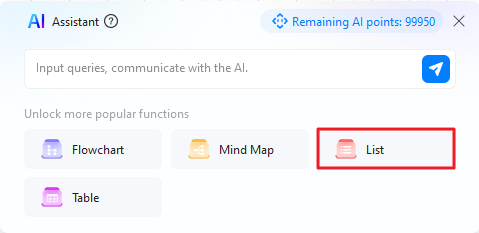
- Open the Edraw AI window using one of the three available methods mentioned earlier: a. Homepage Edraw AI Tab; b. AI Menu; c. Edraw AI Icon.
- Once you have accessed the Edraw AI window, choose the List option.
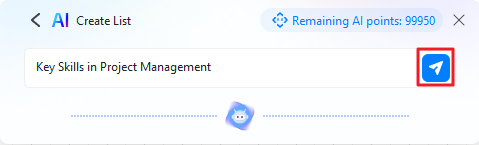
- Enter a descriptive command for your list, e.g. "Key Skills in Project Management." Click the blue Send button to submit the command.
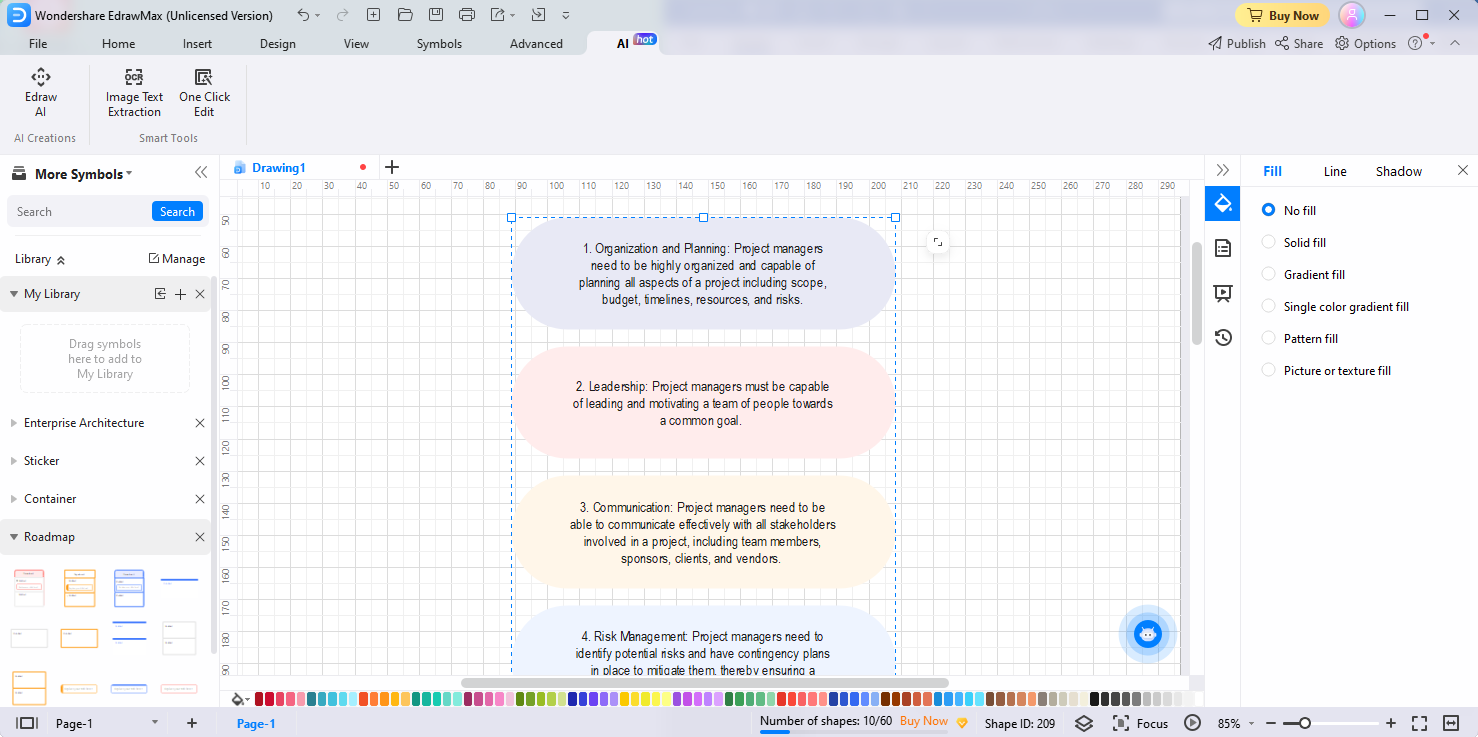
- Edraw AI will intelligently analyze the input data and patterns to generate a well-organized and structured list.
- Once the list is generated, you can use the customization options of EdrawMax to make manual edits to the list and use the design tools and features to modify the designs, styles, and formatting of your list, creating a visually appealing output.
AI Table
Edraw AI enables you to create tables with just one command. Whether you need to create data tables, comparison tables, or any other type of table, EdrawMax's AI-driven table generation feature has got you covered.
Follow the steps below to create and customize tables:
- Open the Edraw AI window using one of the three available methods mentioned above: a. Homepage Edraw AI Tab; b. AI Menu; c. Edraw AI Icon.
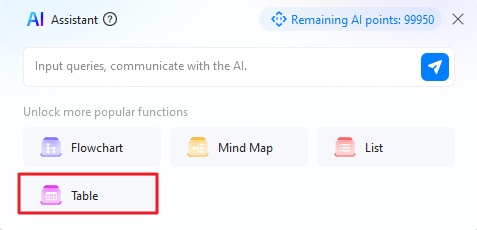
- In the popup Edraw AI window, choose the Table option.
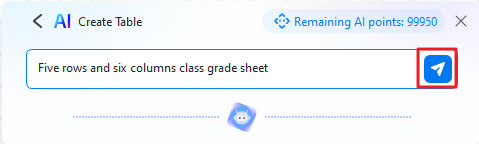
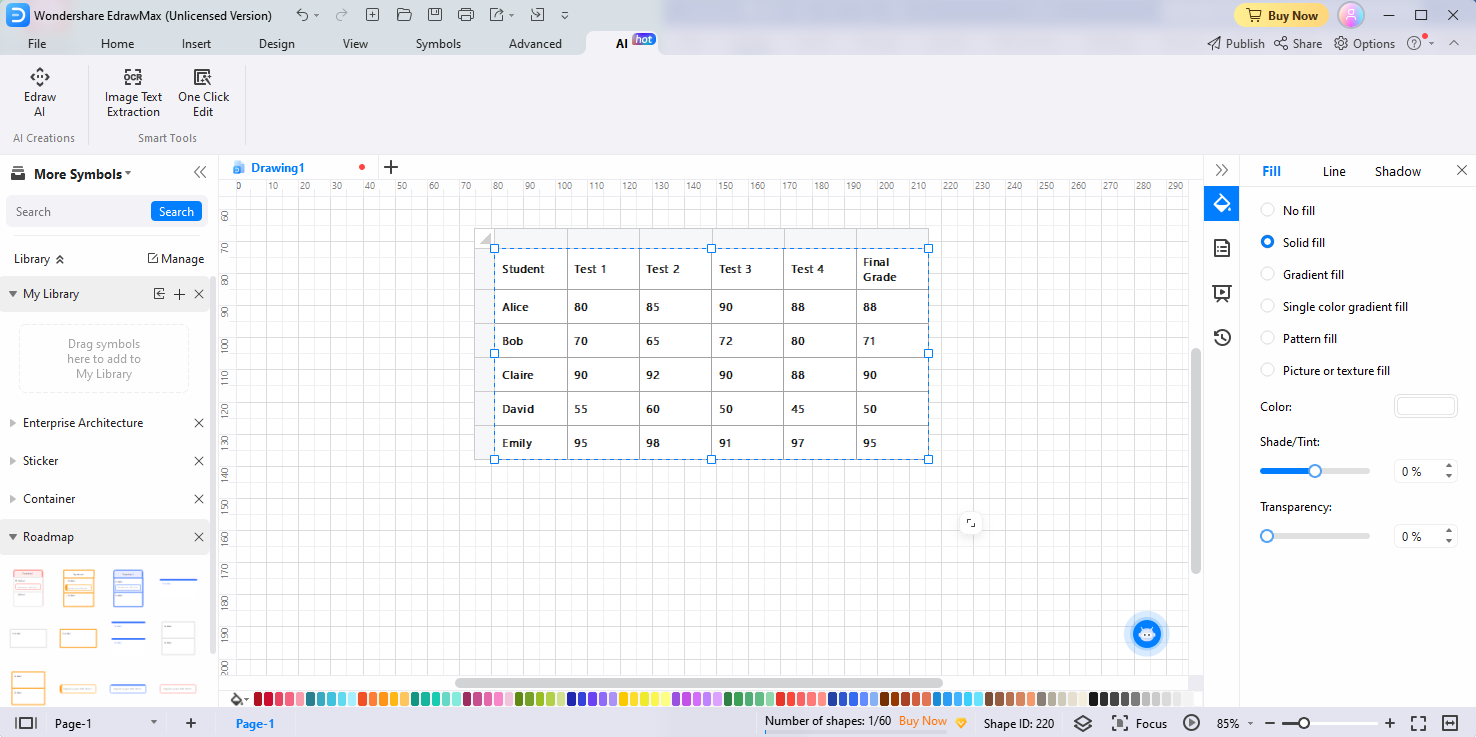
- Enter a descriptive command for your table, e.g. "Five rows and six columns class grade sheet." Click the blue Send button.
- Edraw AI will intelligently analyze the input and generate a well-structured table.
- Once the table is generated, you have the flexibility to make manual edits and optimize the designs to enhance its appearance.
AI Generated Content
EdrawMax's AI generated content feature helps you generate and edit text in your diagrams with artificial intelligence.
Continuous Text
Continuous Text in the AI generated content feature enhances the text by analyzing and expanding selected content. This powerful tool enables you to effortlessly add more information and expand a snippet of text into a longer, more comprehensive paragraph.
Here's how the Continuous Text feature works:
- Select the specific content in your diagrams that you want to enhance and add more information to.
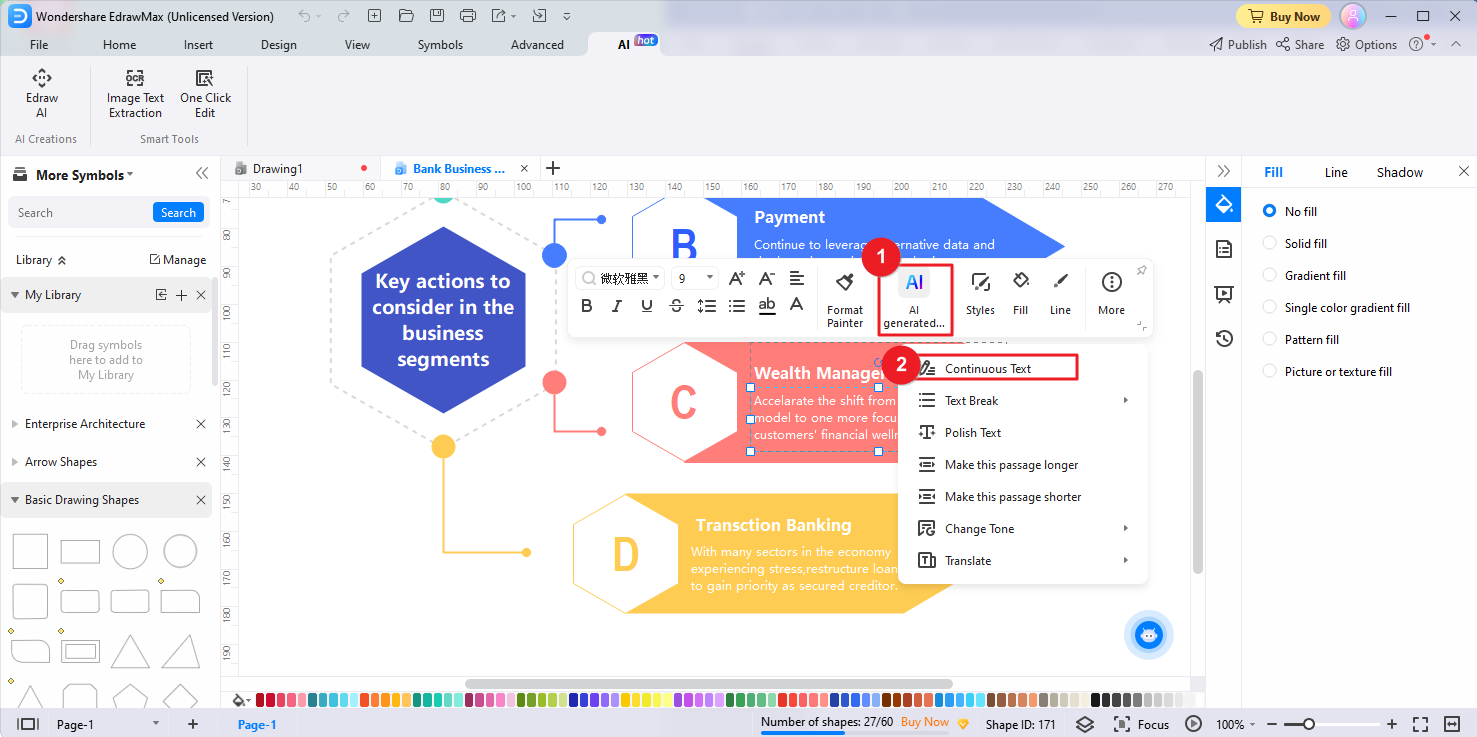
- Click the AI generated content button located in the floating bar. Alternatively, you can quickly tap the Space Bar twice to activate the AI generated content tool. Then, locate the Continuous Text tool.
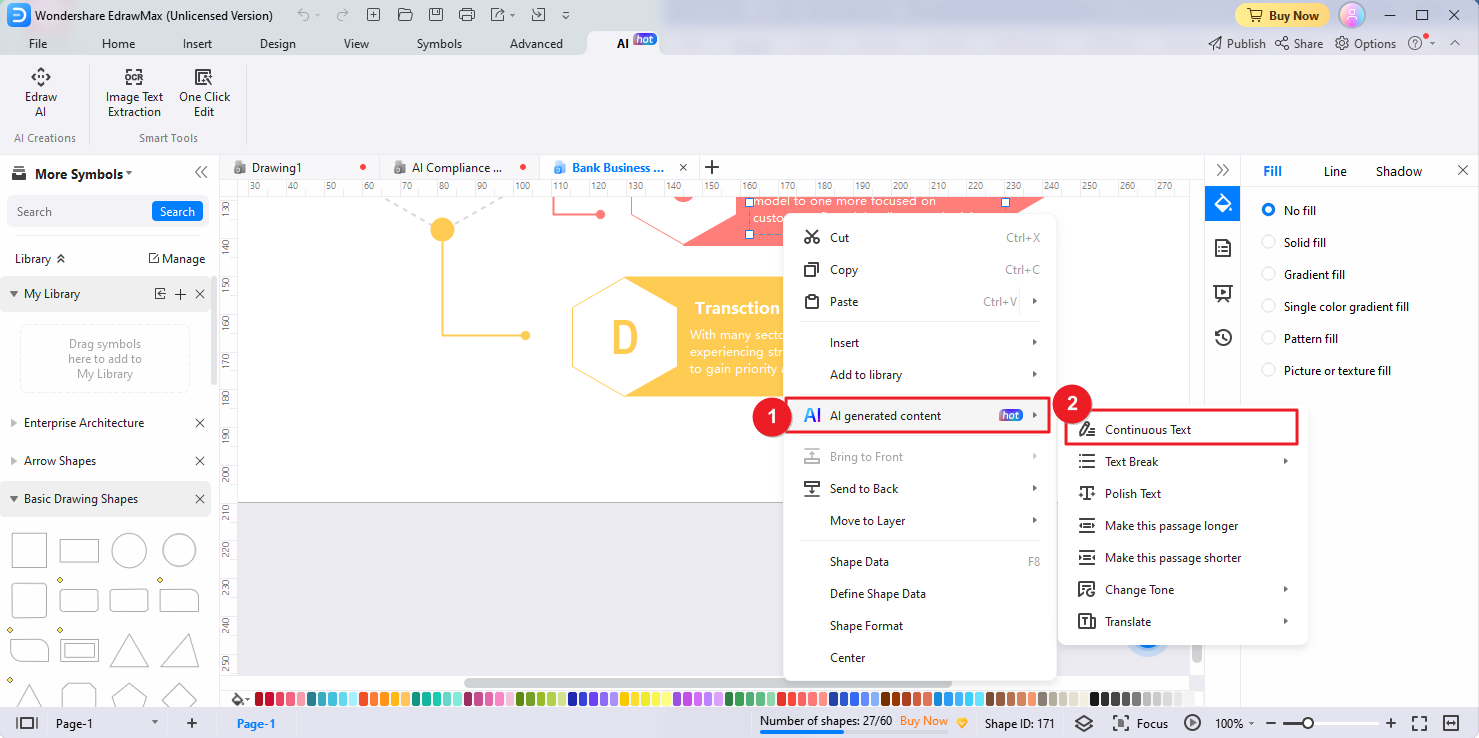
- Or, you can right click the text you wish to expand and select AI generated content > Continuous Text.
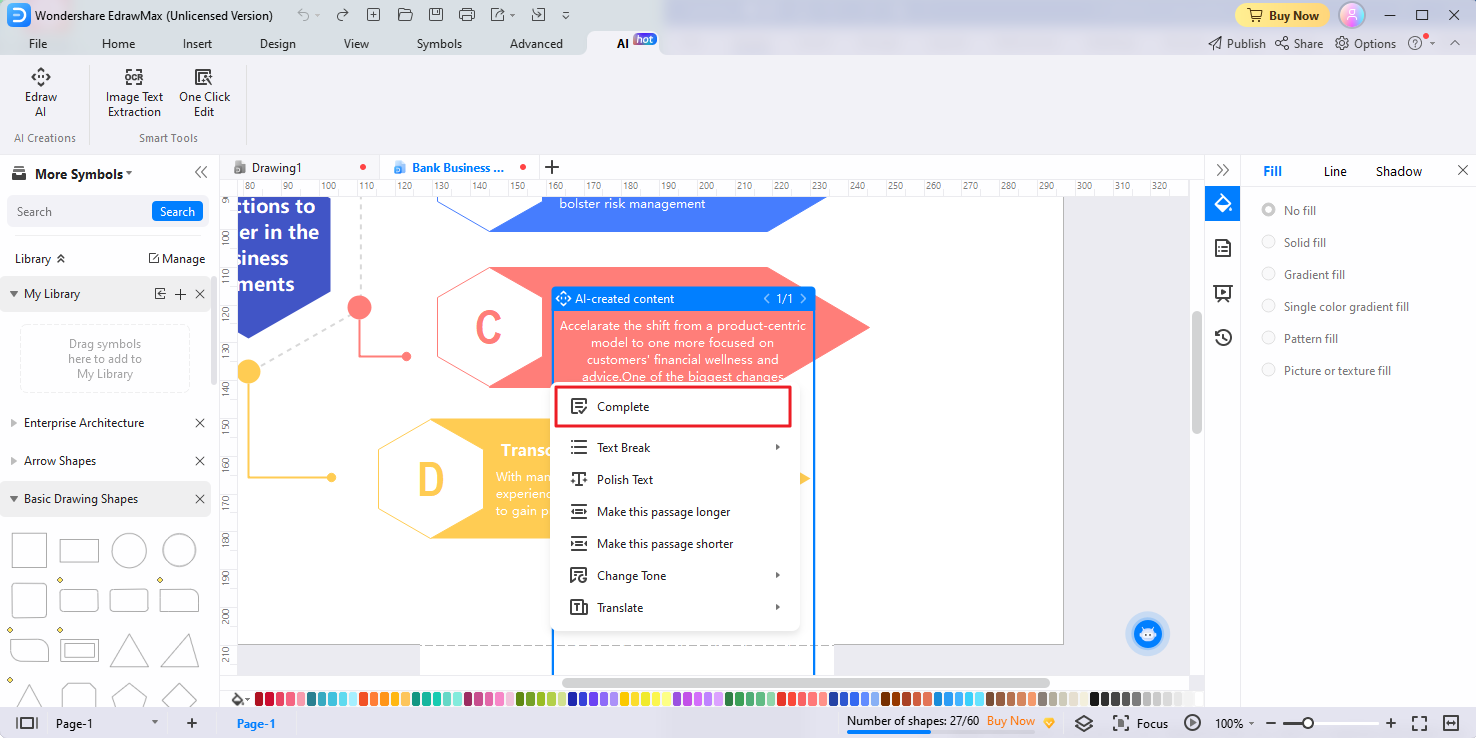
- Activate the Continuous Text tool to initiate the analysis process. Edraw AI will analyze the context and meaning of the text, generates additional information, and expands the selected text into a longer, more detailed paragraph. After the process, click Complete.
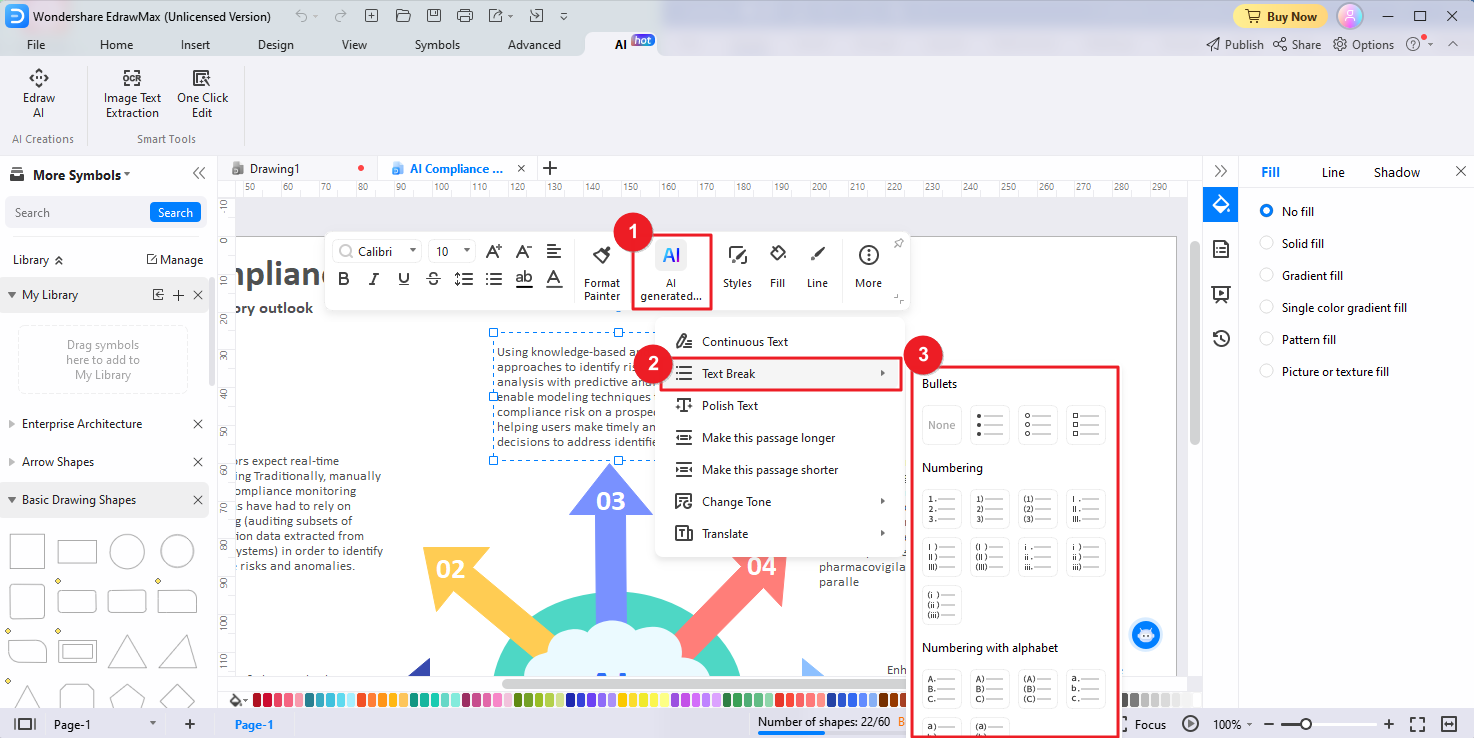
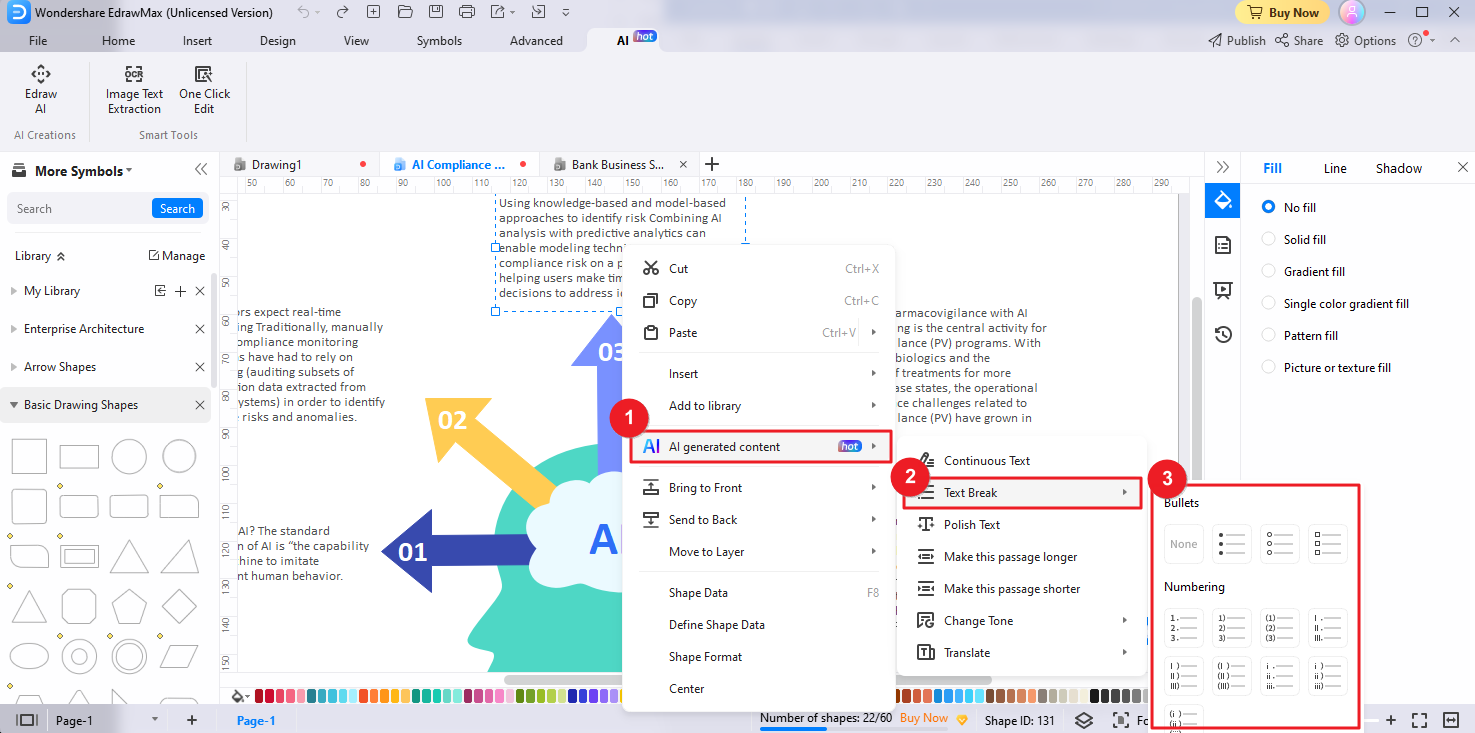
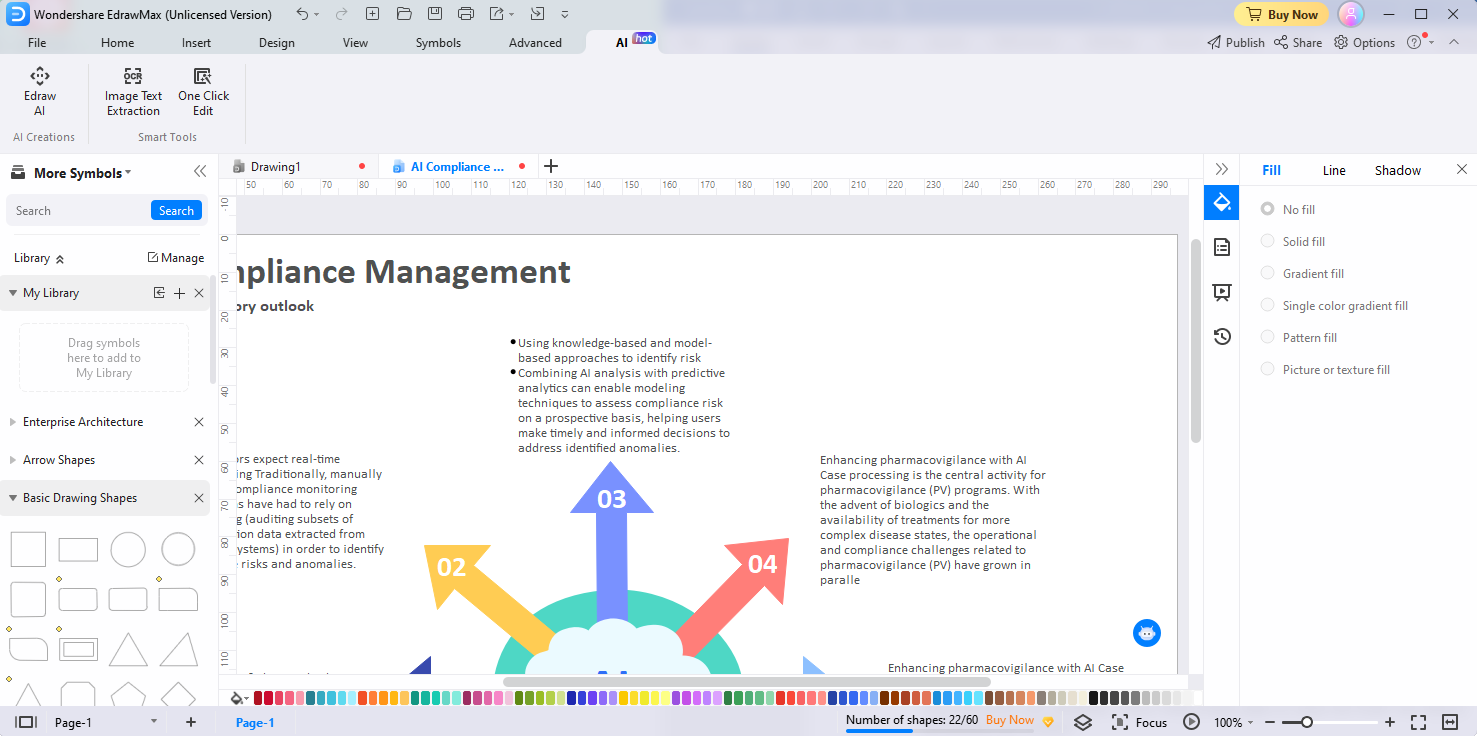
Text Break
The Text Break feature allows you to effortlessly break long text into concise and well-structured bullet points or numbered lists. Here's how you can utilize the Text Break feature to enhance your content:
- Select the specific long text in your diagrams that you want to organize and break into bullet points or numbered lists.
- Click the AI generated content button located in the floating bar. Or, quickly tap the Space Bar twice to activate the AI generated content tool. Locate and select the Text Break option from the available menu options. Choose the desired format for breaking the text, such as bullet points, numbering, or numbering with alphabet.
- Alternatively, right-click the text you wish to break and select AI Generated Content > Text Break.
- Then Edraw AI will automatically break the selected text into the specified format. The tool intelligently organizes the text, ensuring clarity and structure.
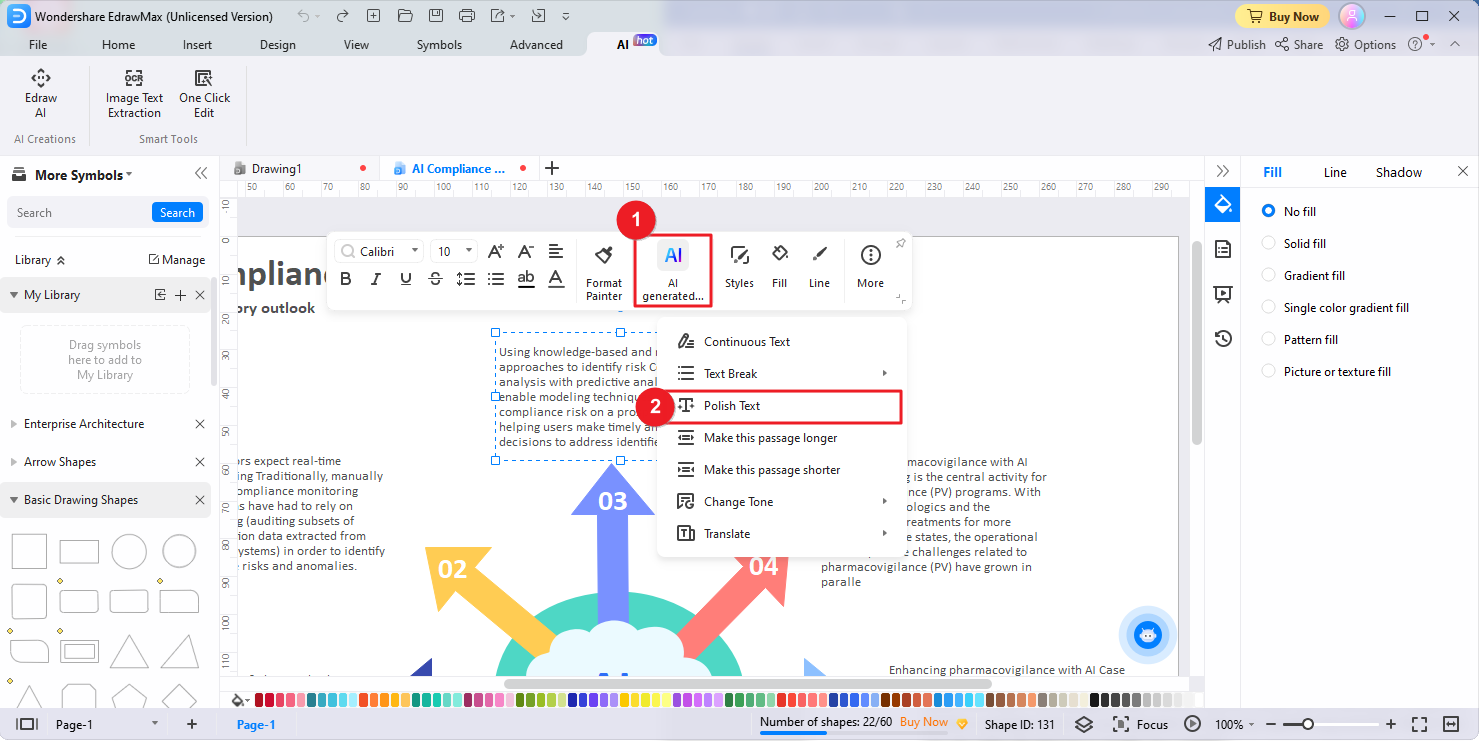
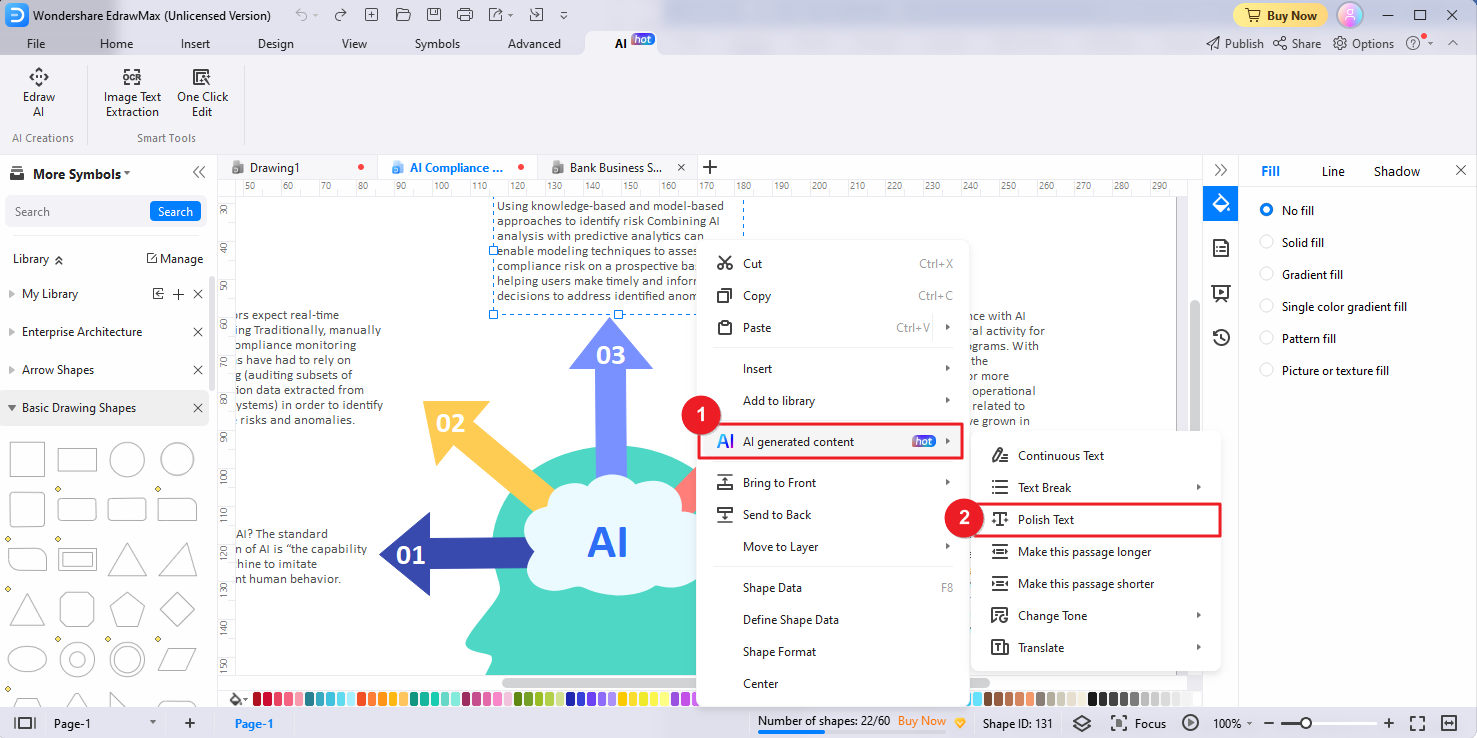
Polish Text
EdrawMax's Polish Text feature allows you to effortlessly refine and enhance your text for improved clarity and readability. Follow these simple steps to utilize the Polish Text feature and perfect your content:
- Identify and select the specific text on the canvas that you want to polish and refine.
- Click the AI generated content button in the floating bar. Alternatively, you can quickly tap the Space Bar twice to activate the AI generated content tool. Locate and select the Polish Text option from the available menu options.
- Or, right click the text you want to polish, select AI generated content > Polish Text.
- Edraw AI will automatically analyze the text, make improvements to ensure clarity, readability, and coherence, and replace the original text with the polished version.

Make This Passage Longer/Shorter
Edraw AI's Make This Passage Longer/Shorter features enable you to effortlessly expand or shorten a passage of text in your diagrams to meet your specific requirements. Here's how you can utilize the features to modify your content:
- Identify and select the specific passage of text that you want to expand or shorten.
- To initiate the AI generated content process, click the AI generated content button in the floating bar. Alternatively, quickly tap the Space Bar twice or select the AI generated content option from the right-click menu. From the available menu options, locate and select the Make This Passage Longer or Make This Passage Shorter option.
- Edraw AI will automatically analyze the selected text and perform the requested action, expanding or shortening the text accordingly.
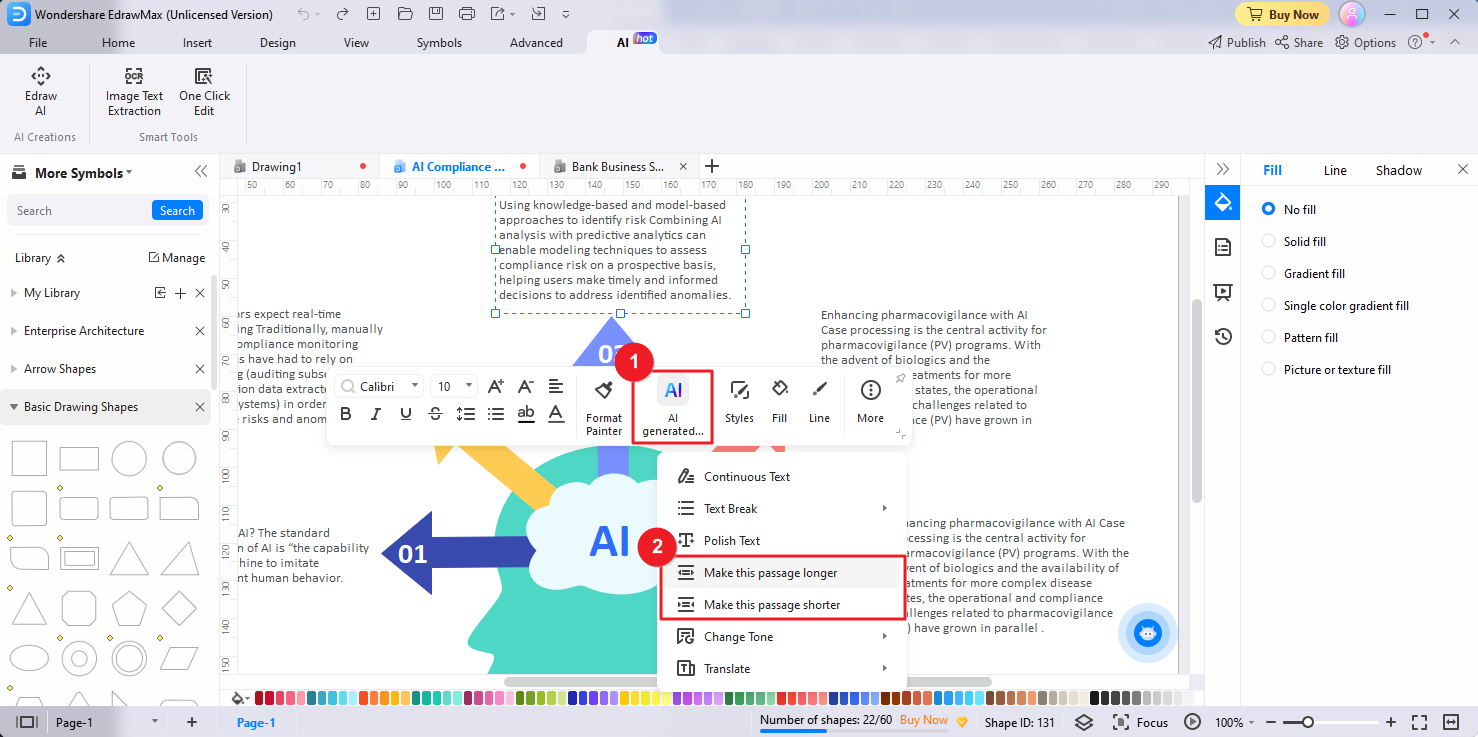
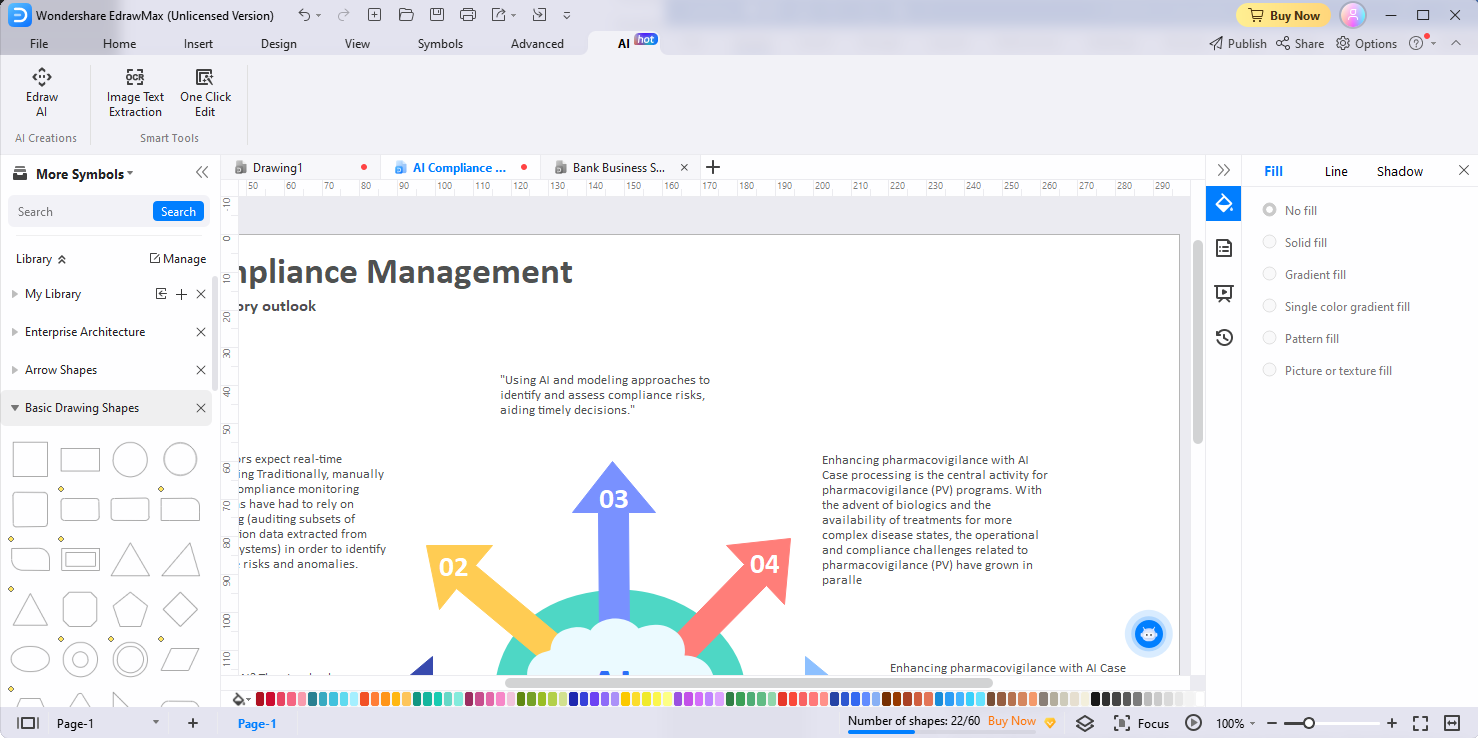
Change Tone
EdrawMax's Change Tone feature allows you to adjust the tone of a passage of text within your diagrams to align with your desired style or mood. Here's how you can use the Change Tone feature:
- Within your diagrams, identify and select the specific passage of text that you want to adjust the tone of.
- Click the AI generated content button located in the floating bar or in the right-click menu. Alternatively, you can quickly tap the Space Bar twice to activate the AI generated content tool. Then, locate and select the Change Tone option from the available menu options. Choose the desired tone for the text: Professional, Informal, Direct, Confident, or Friendly.
- Edraw AI will then apply the changes to the text accordingly, adjusting its tone to match your selected style or mood.
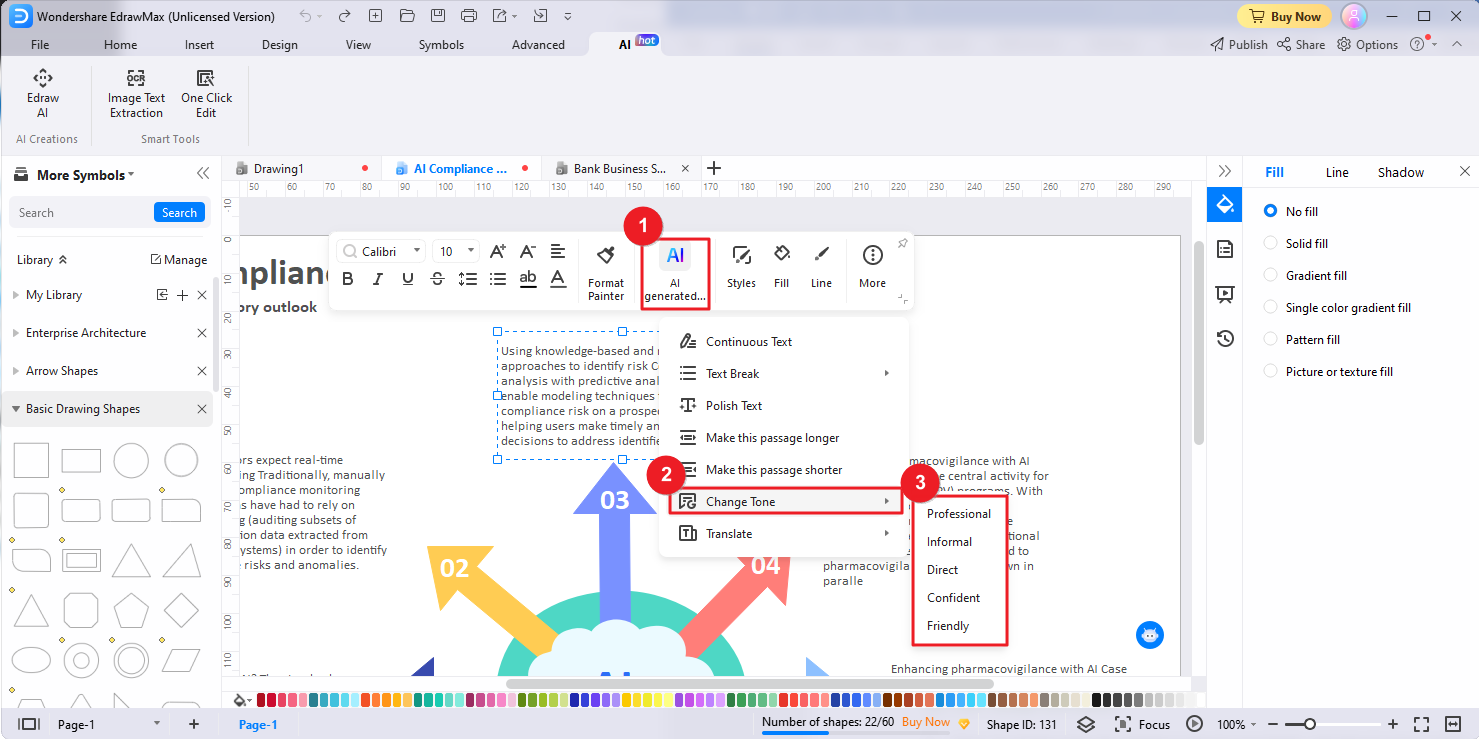
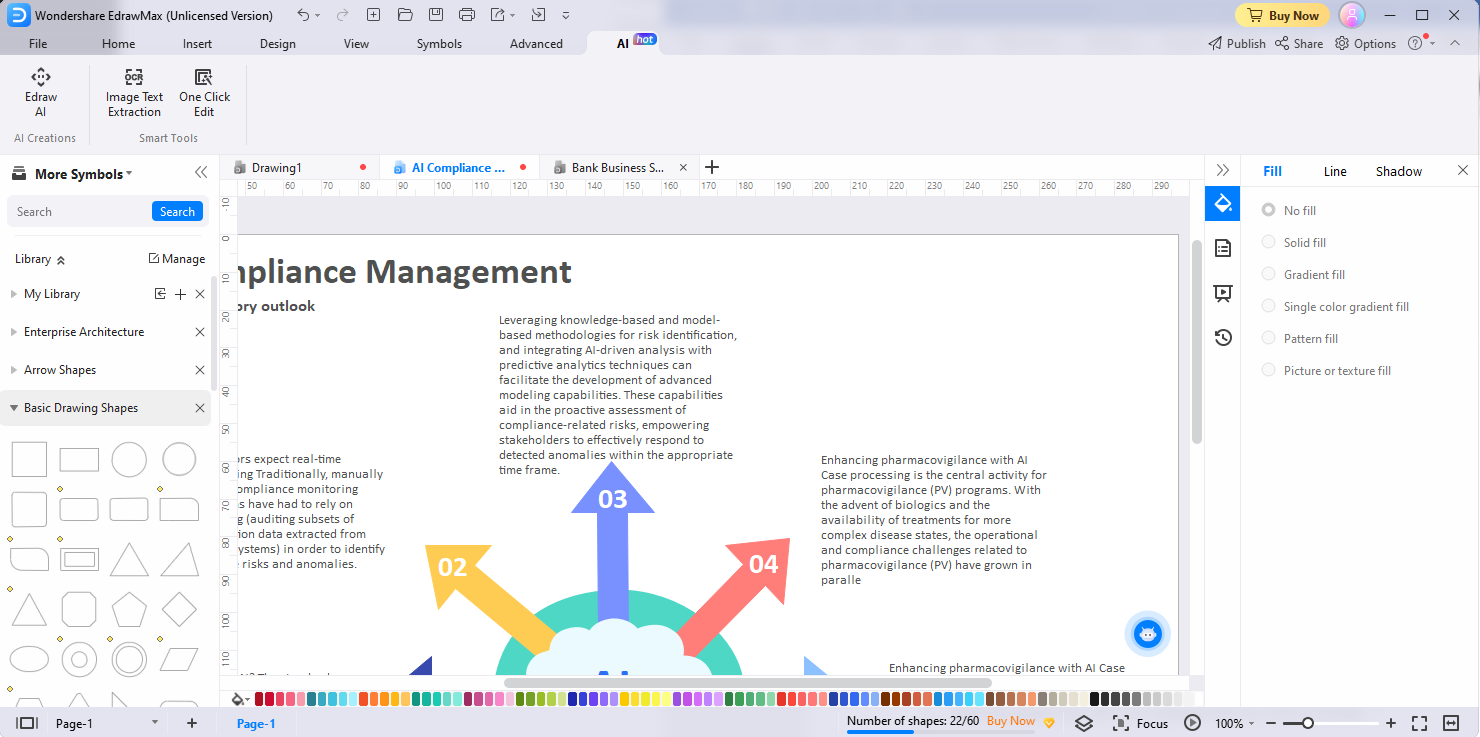
Translate
With the Translate AI-powered feature, you can effortlessly translate text within your diagrams into different languages. Here's a step-by-step guide:
- Select the specific text within your diagrams that you want to translate.
- To access the Translate feature, click the AI generated content button located in the floating bar or the AI generated content option in the right-click menu, or quickly tap the Space Bar twice to activate the AI generated content tool. Locate and select the Translate option from the drop-down menu and choose the target language.
Edraw AI supports translating text into multiple languages, including English, Simplified Chinese, German, Japanese, French, Spanish, Italian, Portuguese, Traditional Chinese, Korean, and Indonesian. - Edraw AI will then process the translation accordingly and replace the source text with the translation.
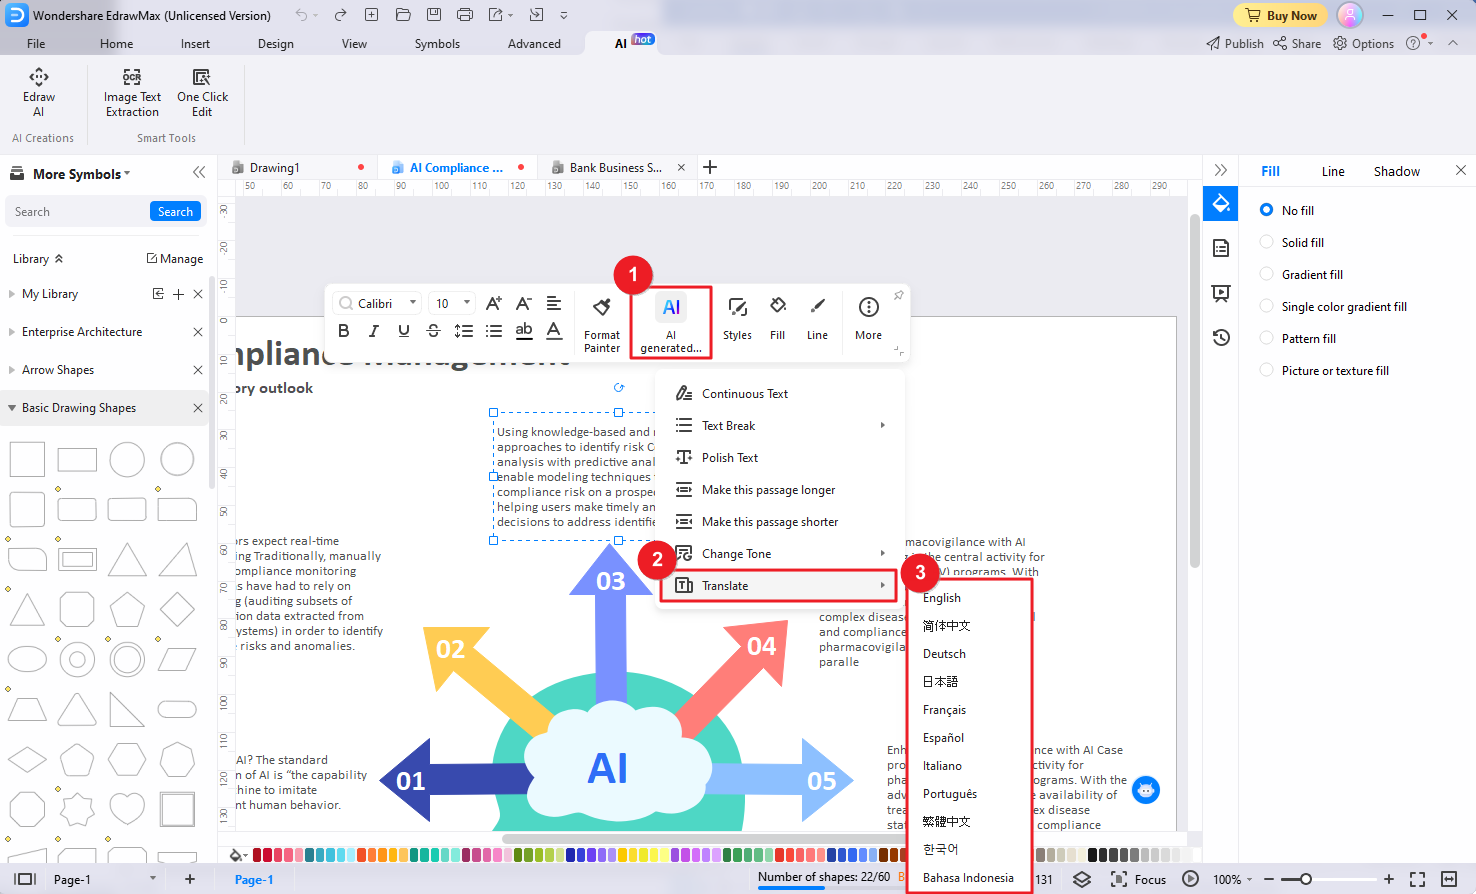
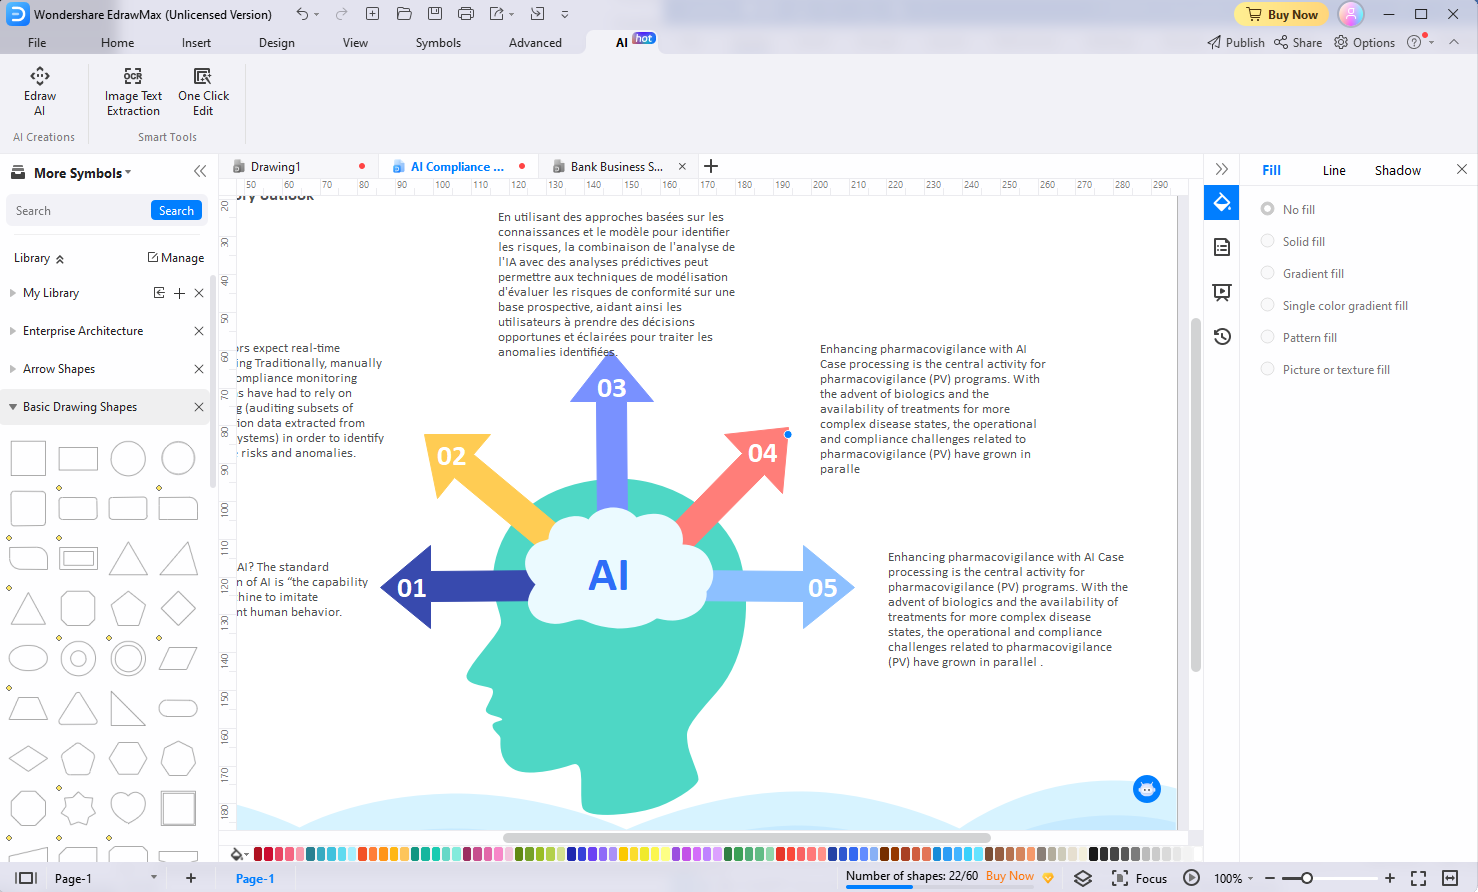
One-Click Edit
EdrawMax's One-Click Edit feature helps you easily make global style changes to your diagrams, ensuring a consistent and professional look.
Change Global Style
This feature enables you to apply a desired global design to your diagram.
- Navigate to the AI menu option in EdrawMax and click the One-Click Edit button.
- In the popup One-Click Edit window, choose the Change Global Style tab.
- Choose the desired global design to instantly apply it to your entire diagram, giving it a cohesive and unified look.
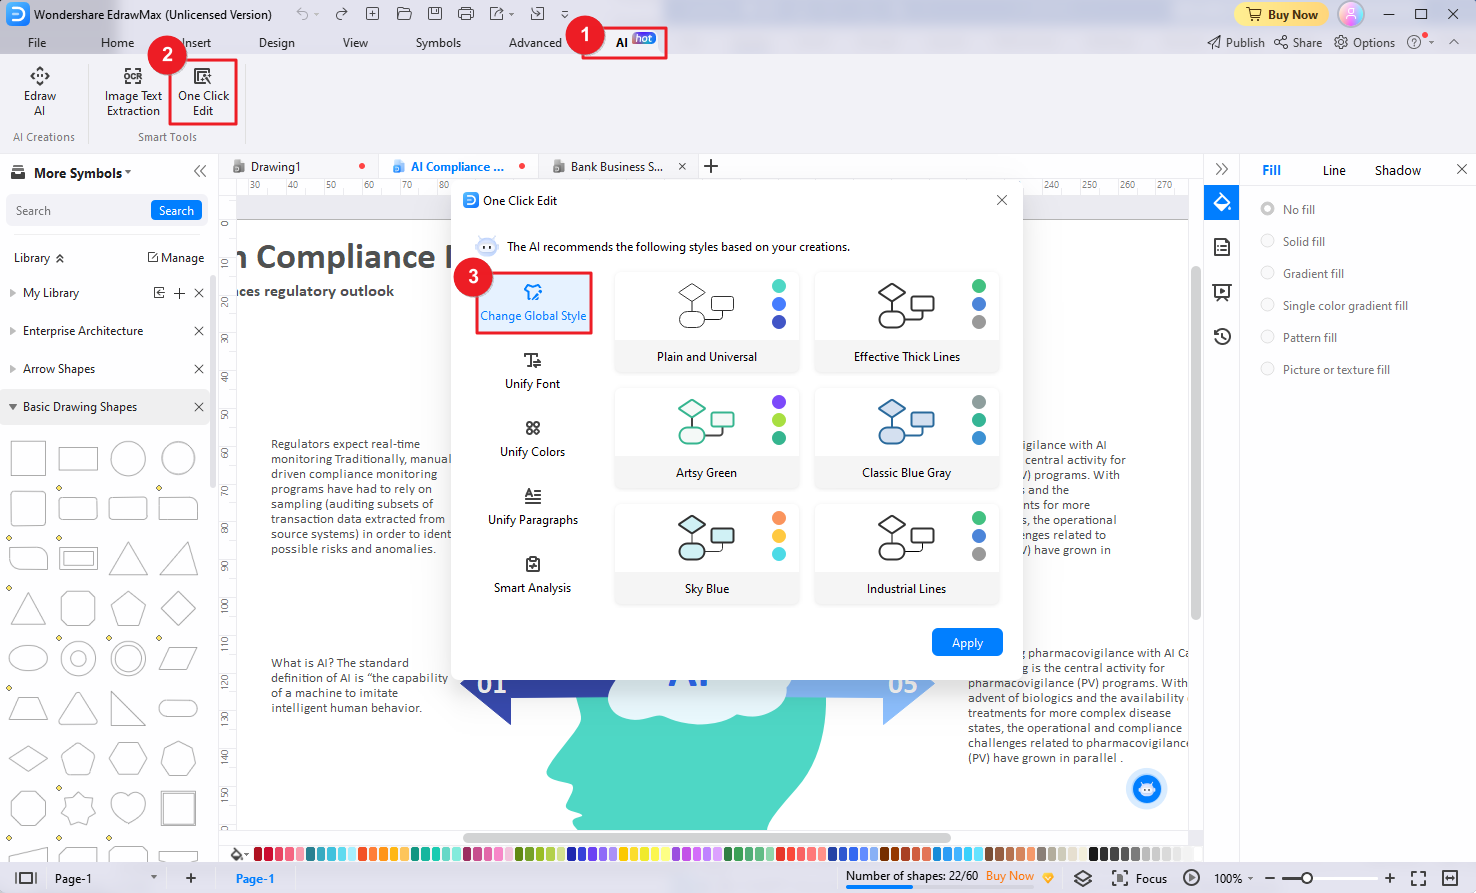
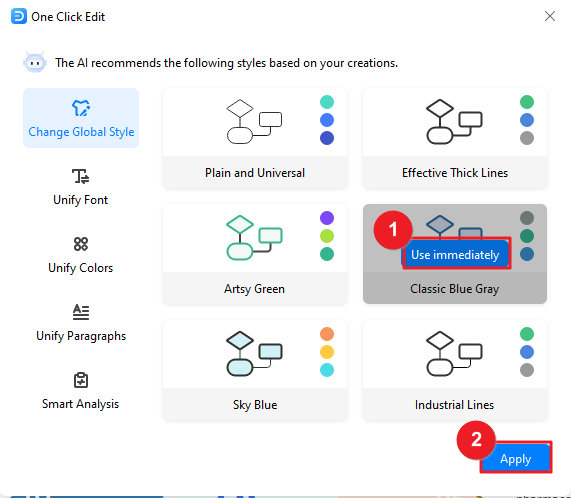
Unify Font
The Unify Font feature ensures consistency in the font styles used throughout your diagram.
- In the One-Click Edit window, choose the Unify Font tab.
- Choose the desired font and apply a single font style to all text elements.
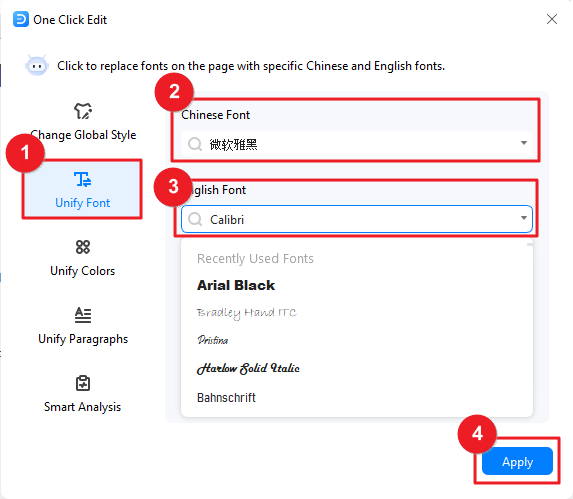
Unify Colors
The Unify Colors feature helps you easily apply a consistent color scheme to all shapes and lines in your diagram.
- In the One-Click Edit window, choose the Unify Colors tab.
- Set up the colors of the shapes and lines in your diagram to maintain visual coherence and a professional appearance.
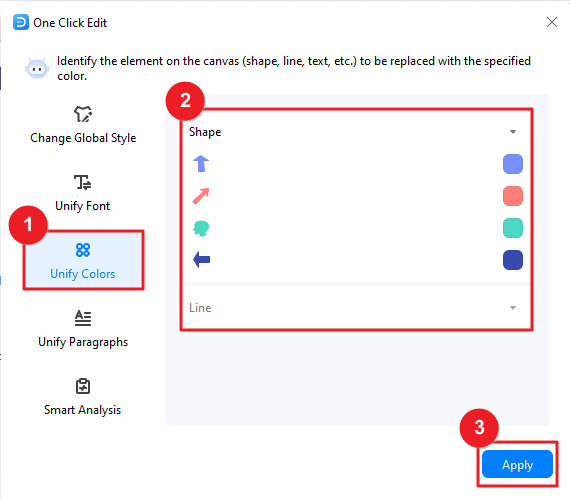
Unify Paragraphs
The Unify Paragraphs feature allows you to standardize the alignment, indentation, and spacing of paragraphs within your diagram.
- In the One-Click Edit window, choose the Unify Paragraphs tab.
- Set up the alignment, indentation, and spacing of text paragraphs in your diagram to can ensure that all paragraphs are uniformly aligned and formatted.
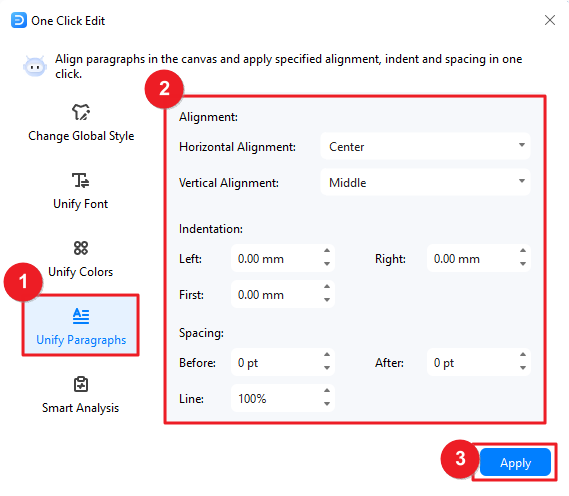
Smart Analysis
Edraw AI can detect possible design problems in your current diagrams, and mark targeted suggestions, and you can make adjustments with one click.
- In the One-Click Edit window, navigate to the Smart Analysis tab. Click the Analyze button to initiate the detection process.
- Edraw AI will scan your diagram for potential issues such as multiple fonts, alignment problems, color specification inconsistencies, or large pictures. Click the Optimize button to apply improvements and address the detected design problems. After optimization, you can click Repeat Analysis to make Edraw AI detect again.
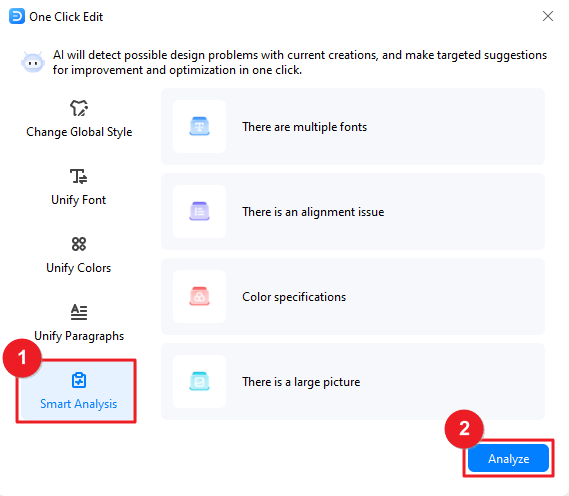
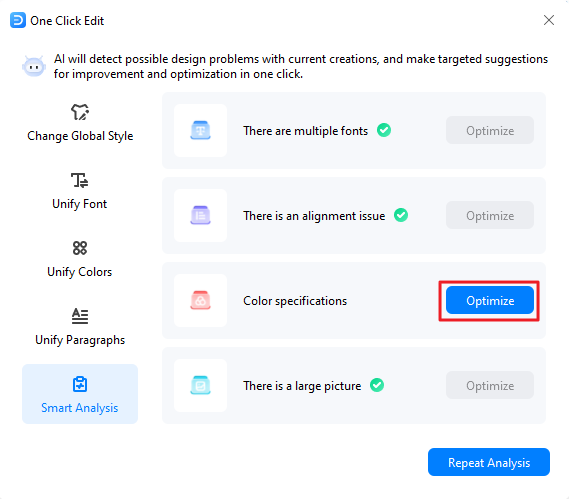
OCR Image Text Extraction
EdrawMax's OCR Image Text Extraction feature empowers users to extract text directly from images, saving time and effort in manual transcription.
- Access the AI menu and locate the OCR Image Text Extraction button.
- Drag and drop the image containing the desired text into the OCR Image Text Extraction window that appears, or click Select a document to import the image and upload it here.
- Click the Start button to initiate the OCR process, allowing EdrawMax to analyze and extract the text from the image.
- Once the text extraction is complete, you have two options:
- Copy the extracted text and paste it directly into your diagrams.
- Click the Create button to insert the extracted text as a text box onto the canvas, making it easily editable and manipulable.
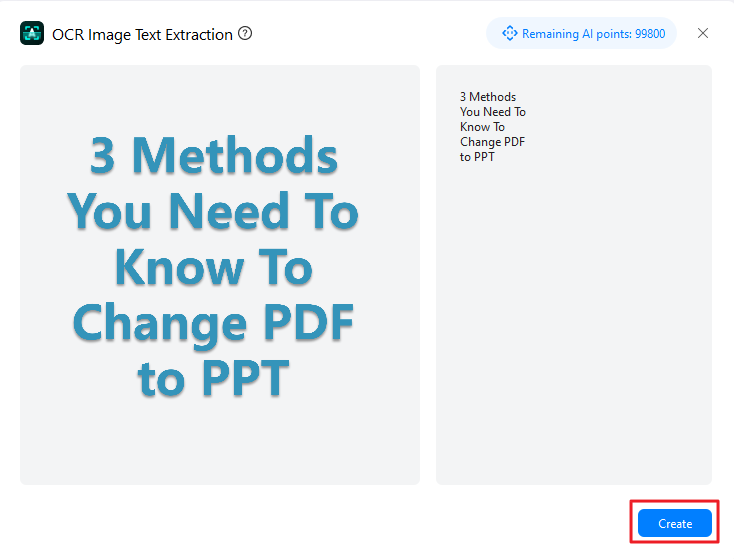
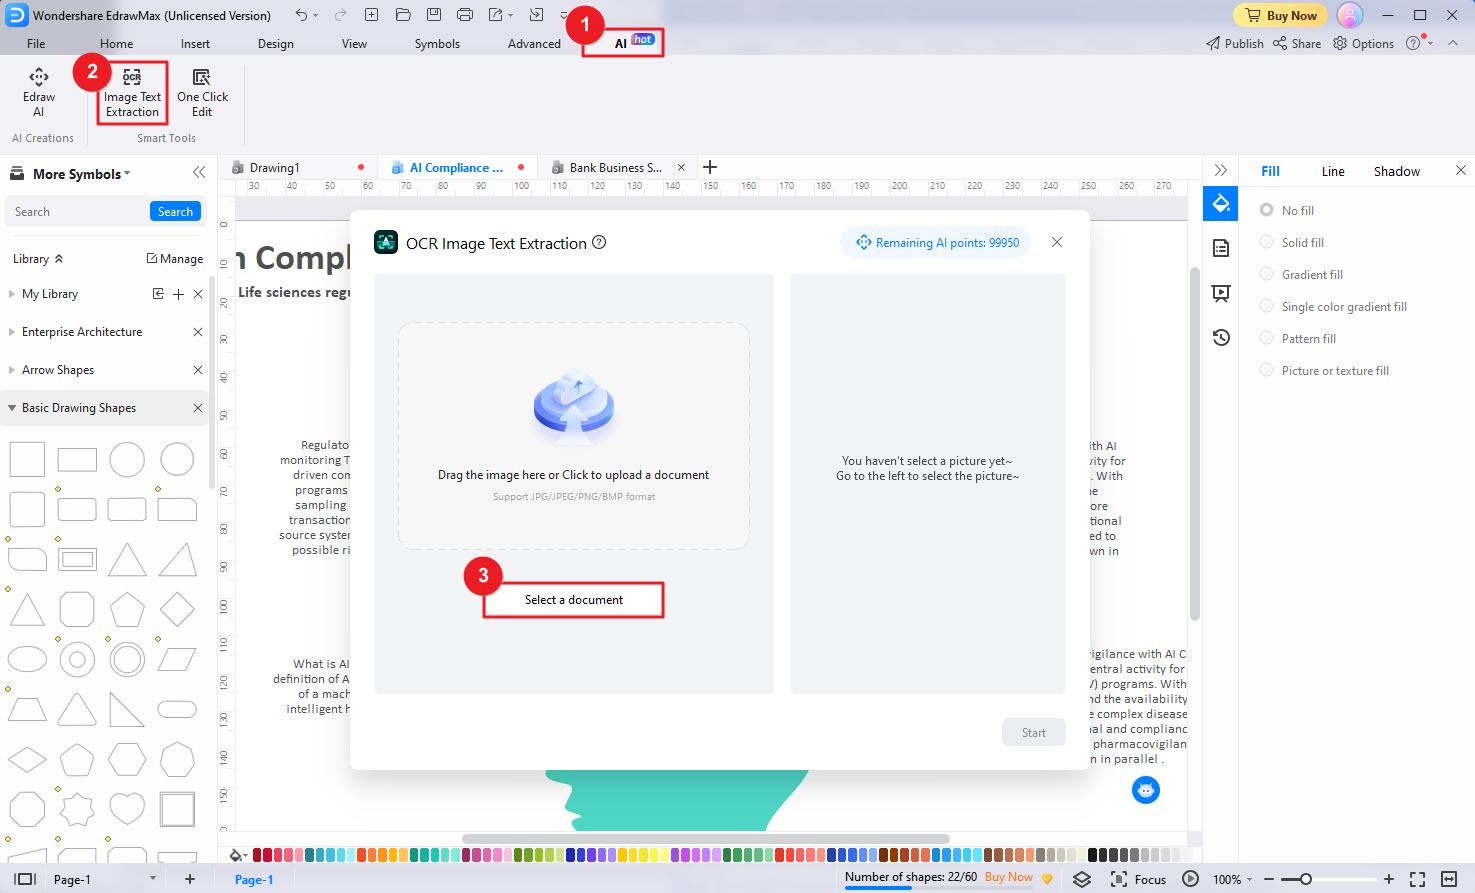
Keyboard Shortcuts
Select File > Options > Shortcuts. You will see the inbuilt shortcut key list. Click Customize Shortcuts, and you can set custom shortcut keys for any function.
The keyboard shortcuts refer to the U.S. keyboard layout. Keys on other keyboard layouts may not correspond exactly to the keys on a U.S. keyboard.
Quick Access Toolbar
| Goal | Shortcuts: For Win (Mac) |
| Undo | Ctrl + Z (⌘ + Z) |
| Redo | Ctrl + Y; Ctrl + Shift + Z (⌘ + ⇧ + Z) |
| Create a new document | Ctrl + N (⌘ + N) |
| Open | Ctrl + O (⌘ + O) |
| Save | Ctrl + S (⌘ + S) |
| Save as | Ctrl + Shift + S (⌘ + ⇧ + S; Fn + F12) |
| Ctrl + P (⌘ + P) | |
| Close | Ctrl + W (⌘ + W) |
Home
| Goal | Shortcuts |
| Cut | Ctrl + X (⌘ + X) |
| Copy | Ctrl + C (⌘ + C) |
| Paste | Ctrl + V (⌘ + V) |
| Paste as special formats | Ctrl + Alt + V (⌘ + ⌥ + V) |
| Format painter | Ctrl + Shift + C (⌘ + ⇧ + C) |
| Increase font size | Ctrl + Shift + .( period) / ⌘ + ⇧ + . ( period) |
| Decrease font size | Ctrl + Shift + ,(comma) / ⌘ + ⇧ + , (comma) |
| Make the selected text bold | Ctrl + B (⌘ + B) |
| Italicize the selected text Ctrl + I | Ctrl + I(⌘ + I) |
| Underline the selected text | Ctrl + U (⌘ + U) |
| Subscript | Ctrl + Alt + - (⌘ + ⌥ + -) |
| Superscript | Ctrl + Alt + = (⌘ + ⌥ + =) |
| Select tool | Ctrl + 1 (⌘ + 1) |
| Select all shapes | Ctrl + A (⌘ + A) |
| Text tool | T; Ctrl + 2 (⌘ + 2) |
| Text block adjust tool | Ctrl + Alt + 2 (⌘ + ⌥ + 2) |
| Add right-angle connectors | Ctrl + 3 (⌘ + 3) |
| Add curved connectors | Ctrl + 4 (⌘ + 4) |
| Add straight connectors | Ctrl + 5 (⌘ + 5) |
| Rectangle tool | R; Ctrl + 8 (R; ⌘ + 8) |
| Oval tool | O |
| Bezier tool | Ctrl + 7 (⌘ + 7) |
| Repeat a command | F4 (⌘ + Y) |
| Connection points tool | Ctrl + Shift + 1 (⌘ + ⇧ + 1) |
| Bring to front | Ctrl + Shift + ] (⌘ + ⇧ + ]) |
| Bring forward | Ctrl + ] (⌘ + ]) |
| Send to back | Ctrl + Shift + [ (⌘ + ⇧ + [) |
| Send backward | Ctrl + [ (⌘ + [) |
| Group shapes | Ctrl + G (⌘ + G) |
| Ungroup shapes | Ctrl + Shift + G (⌘ + ⇧ + G) |
| Make selected shapes in the same width | Ctrl + Shift + W (⌘ + ⇧ + W) |
| Make selected shapes in the same height | Ctrl + Shift + H (⌘ + ⇧ + H) |
| Make selected shapes at the same angle | Ctrl + Shift + A (⌥ + ⇧ + A) |
| Make selected shapes in the same size | Ctrl + Shift + Z (⌥ + ⇧ + Z) |
| Align shapes by left | Alt + L (⌥ + L) |
| Align shapes by center | Alt + C (⌥ + C) |
| Align shapes by right | Alt + R (⌥ + R) |
| Find & Replace | Ctrl + F (⌘ + F) |
| Spelling check | F7 (Fn + F7) |
| Capture screen | Ctrl + Shift + R (⌘ + ⇧ + R) |
| Capture screen with the interface hidden | Ctrl + Shift + X (⌘ + ⇧ + X) |
Insert
| Goal | Shortcuts |
| Insert a blank page | Shift + F11 (⇧ + F11) |
| Insert a table | Ctrl + Alt + T (⌘ + ⌥ + T) |
| Insert a chart | Ctrl + Alt + P (⌘ + ⌥ + P) |
| Insert pictures from files | Ctrl + Alt + I (⌘ + ⌥ + I) |
| Insert a formula/td> | Ctrl + Alt + E (⌘ + ⌥ + E) |
| Add vector text | Ctrl + Shift + V (⌘ + ⇧ + V) |
| Insert hyperlinks | Ctrl + K (⌘ + K) |
| Insert attachments | Ctrl + H (⌘ + H) |
| Insert notes | Ctrl + Alt + Z (⌘ + ⌥ + Z) |
| Insert comments | Ctrl + Alt + X (⌘ + ⌥ + X) |
| Insert QR codes | Ctrl + Alt + Q (⌘ + ⌥ + Q) |
Page Layout
| Goal | Shortcuts |
| Open page setup dialog box | F6 (Fn + F6) |
View
| Goal | Shortcuts |
| Present from the beginning | F5 (Fn + F5) |
| Present from the current page | Shift + F5 (⇧ + F5) |
| Zoom in | Ctrl + =; Ctrl + Mouse scroll wheel (⌘ + =) |
| Zoom out | Ctrl + -; Ctrl + Mouse scroll wheel (⌘ + -) |
| Show or hide shape data pane | F8 |
Symbols
| Goal | Shortcuts |
| Open pencil tool | Alt + P (⌥ + P) |
| Open pen tool | P |
| Open move anchors tool | Ctrl + M (⌘ + M) |
| Open convert anchors tool | Ctrl + Shift + M (⌘ + ⇧ + M) |
| Save the selected shape as a new symbol | Ctrl + F11 (⌘ + F11) |
| Open or hide datasheet | F9 |

