UML State Diagram: A Useful Guide
Part 1: What is a UML State Diagram?
Have you tried drinking ice or breaking water? It's not practical, and steam will burn you if you get too close unless it's cold, right? Of course, when it's cold, it won't be steam anymore because generally, objects have different states. Furthermore, from one state to another, an object will depict a different behavior in each case.
However, not all objects are like water. Some have very complex behaviors depending on their current state. Such complexity makes it difficult for developers, scientists, or generally researchers to understand. To understand them, you should use a UML state diagram.
A UML state diagram also referred to as a state machine, holds information of an object with regards to the state the object is in and the transitions in between. By visualizing an object's behavior and its possible transitive states, a state diagram, also a statechart diagram gives you a better understanding of an object's behavior. You can say, it defines an object's status.
You can see that a state chart is much like a flowchart. However, the former focuses on the changes in the state rather than how the system causes change.
Part 2: When to use UML State Diagrams
A UML state diagram has its uses for specific purposes:
1. When you want to model a system's dynamic behavior
A statechart diagram will offer you great insight into the system and understand how its components affect one another.
2. To visualize an object's life cycle
When it comes to life cycles, a state chart lets you see the possible lifetime of an object under certain conditions. With this avenue, you can make the necessary adjustments.
3. To illustrate an object's use case in a business context
In the corporate environment, it is essential for investors and stakeholder alike to know the working of an item, e.g., the ATM concerning how it improves on operations.
4. If you want to understand how a system responds to various input
The use of a UML state diagram lets you visualize how your order can be affected by several input conditions. You, therefore, get room to make tweaks and improvise where possible.
5. Where you want to describe a state change of an object
When it is necessary to make a form of follow up on how objects in a system transit from one state to another, a state chart can come in handy. In this case, you can see how the state changes and what exactly is causing the said change.
Part 3: Basic concepts of a state diagram you must know
When structuring a state diagram, there are several notations and symbols you can use. With these tools, you can have an excellent presentation and also a better understanding of the system you are trying to project.
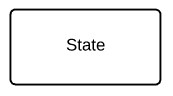
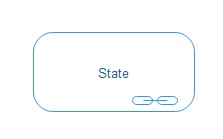
1. A state
It is the current physical situation of an object. A rounded edge rectangle usually represents it, and in the middle of it is a labeling option. You can also fill it with a color of your choice. The state of an object will generally change due to changing events.
2. Start state
It is the point from which a state diagram's flow begins. It's the initial step or stage before any events start happening. The symbol is indicated by a plain circle that you can fill with any color on Edraw Max

3. End state
The flow of a state diagram will always come to an end. This endpoint is indicated by the end state, a circle with a round border. In the current Edraw Max version, it appears as a plain circle when filled with color.

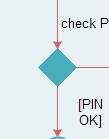
4. Decision
In a statechart diagram, there are points where you can see several options. It is the decision point, indicated by a diamond shape. From the shape, arrows can be attached on the pointed edges to signify a decision route.
5. History
Shows how object-oriented methods and their notations develop. On it is a label H.

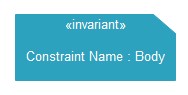
6. Constraint
With a constraint, you can modify and improve on elements in a UML State diagram.
7. Note
Having a note on a state chart diagram allows for comments you can use as explanations to what is happening.

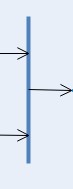
8. Transition joint
It has a bar with a purpose to join together a change into one that promotes a single state.
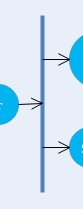
9. Transition branch
You can use a transition branch where one transition results in two states.
10. Transition
An indicator of changing states in the shape of an arrow pointing from one state to another.
11. Transition Arc
You can have a transition arc where the flow of events takes a curvature.
12. Submachine state
In a submachine state, states are connected to symbolize the current state of a machine. It is much like a composite state but without a start or end state.
13. A composite state
A composite state is where a state has sub-states nested into it. It is so because it's composed of another state within it.
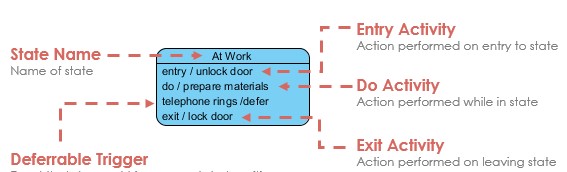
14. State notations
In a state are various types of notations that define it including the state name and other possible dimensions such as an entry activity, exit activity, a trigger, and a do activity. They all are self-explanatory. As for the trigger, also referred to as a deferrable trigger, is an event that doesn't initiate any transition instead stays in place for activation in another state.
Part 4: UML State Diagram: Learn by Examples
Now let's dive into some of the state diagram examples below. These are made using Edraw UML Diagramming Tool., a state diagram tool that is efficient in the modeling of state diagrams and more.
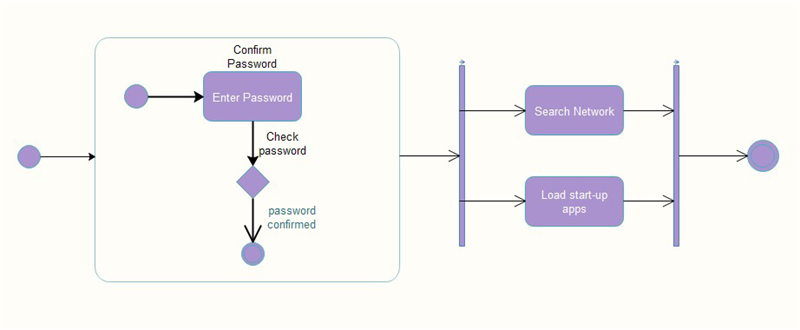
1. PIN Authentication
The focus with this state diagram here is to look into the developments taking place in an authentication process. The first stage is a composite state. Within it, the process has to be completed before you can transit into another state
Power off is the final state here. Thus no other development can take place.

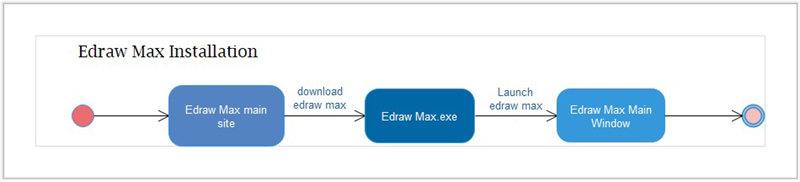
2. Edraw Max Installation
The state diagram example below demonstrates the stages you can take in the installation of Edraw Max up to the point of the main window. The transitions in the middle show what causes the change in states. Also, you can add a hyperlink to the site directly from the first state. Clicking on this state takes you to where you can download it.
3. Butterfly life cycle
As you know, a butterfly goes through different stages in its growth process. These stages are illustrated through the use of a UML state diagram.
The diagram below shows the stages as they move from being an egg until it is a butterfly. However, the stages are not all that can take place. From the decision point, you can see the triggers that might arise and lead to death.

Part 5: How to Create a UML State Diagram
Creating a state diagram is not as complex at all. If you use a state diagram tool like Edraw Max, you’ll have at your disposal a variety of templates you can build on.
The software admittedly feels complicated at first glance. However, you can quickly identify your field from the template categories and work from there.
The steps include:
Step 1: Download, install and launch Edraw Max.

An all-in-one platform for 210+ diagrams.
・ Simple alternative to Visio
・ 26k+ symbols
・ 10K+ free templates
・ 10+ AI diagram generators


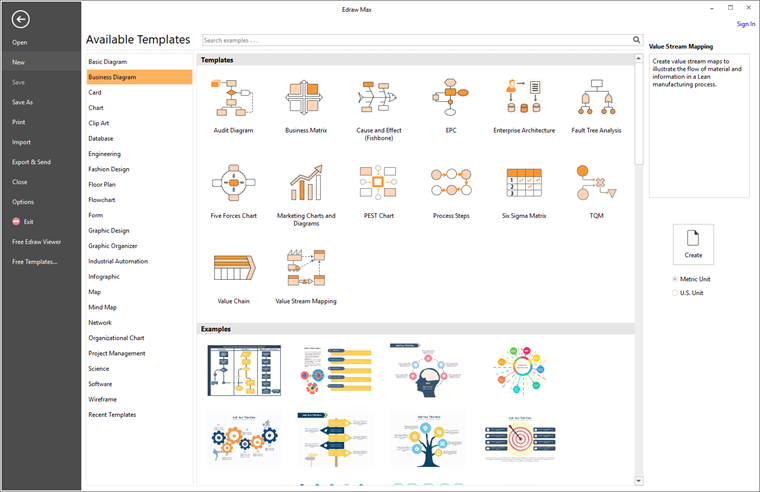
Step 2: Find and click on “Software” under the “Available Templates” option. In the middle column, a list of templates appears.
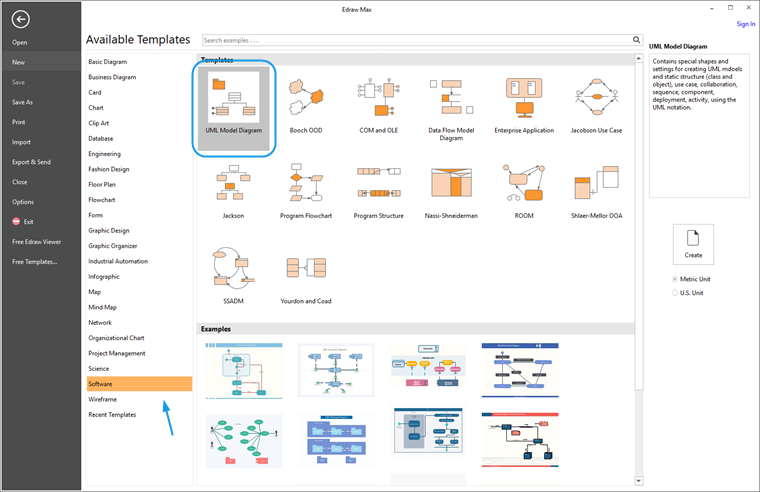
Step 3: Click on “UML Model Diagram” then on the lower right is the create option. Click on it to open a blank window.
Step 4: Drag and drop symbols from the libraries on the left into the blank window depending on what you want to create. On the right are the tools to customize the logos to give the state diagram a more personalized feel.
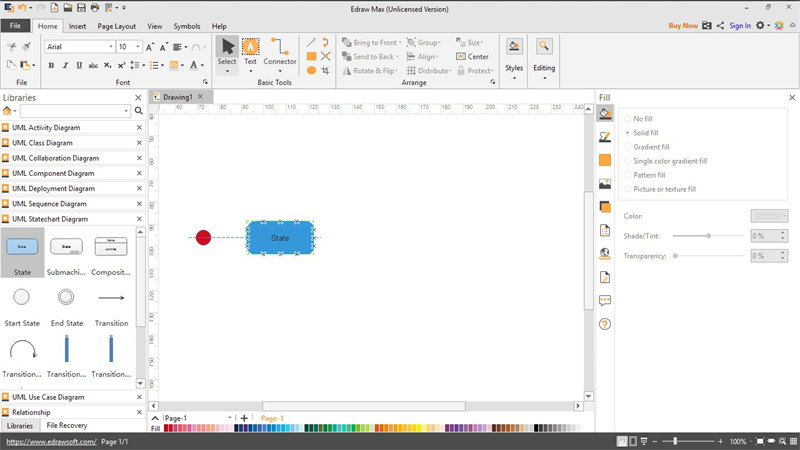
Step 5: To save, click on “file” then select “save as” or use the keyboard shortcut “CTRL + S.”
Part 6: Conclusion
Isn't it fun working with state diagrams? I bet it's even better when using Edraw Max UML state diagram tool.
With state machine diagrams, you can see how neat your presentations come out. Using state diagram tools, you are also able to work fast and efficiently without any constraints. All you need is a great idea! And wouldn't it be great to go at it with your colleagues?
Collaboration is technology's weapon today. So, share this article with friends, colleagues, and anyone who can better their work with UML state diagrams.
Related Articles:


