Comparison Infographic
Edraw Content Team

Have you ever come across a Subway sandwich advertisement when you are driving your car to grab a burger for lunch? This ad says the calories of the Subway sandwich is half of the quarter-pound burger in McDonalds. Suddenly, you changed your mind and drove the car to the other direction because you were afraid of the “extra” calories. If this happened to you, then congratulations to Subway, because that ad proves to be successful.
If you have read the Heart of Darkness, you must know this sentence - “The tranquil waterway leading to the uttermost ends of the earth flowed somber under an overcast sky—seemed to lead into the heart of an immense darkness.” At the other end of the earth, there are two countries share the same name – Congo. One is the Democratic Republic of the Congo (Congo-Kinshasa) and the other one is the Republic of the Congo (Congo-Brazzaville). It is not surprising that you are probably confused with the two countries. However, find an infographic that can visualize their comparison seems to be the quickest way to solve your problem and get a better understanding of Joseph Conrad’s dark tale.
As a methodology, comparison has reached to nearly every aspect of life. Sometimes using comparative images to tell the differences between two events or the two sides of one event tends to be more popular. This article is a simple yet comprehensive guide that you will know what a comparison infographic is and how to create an awesome comparison infographic for dummies.
What is Comparison Infographic?
Firstly, we need to figure out what an infographic is. Just look at its term, you will find it means information is combined with graphic. Therefore, an infographic is a visual representation of information designed to make the data clear at first sight. As a matter of fact, infographic has gained more attention in recent years so that it has been recognized as a means of mass communication. Due to its extreme intuitiveness and visually appealing graphics, people realize that sharing infographics on social media is not just a way of communication. Moreover, it is an irreplaceable tool to help you attract a wide range of audiences wherever on the internet or around you.
As one of the infographic types, the comparison infographic has covered all features of infographic but it focuses on comparison. Normally, you can compare the similarities and the differences of two or more things from different aspects, but you need to remember one thing – keeping an eye on variables, which is the core of a comparison infographic.
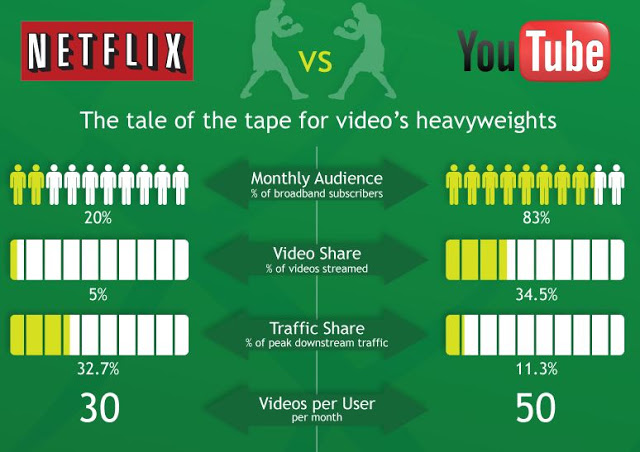
Image Source: broabandtrafficmanagement.blogpost.com
Why do We Need Comparison Infographic?
Scientific researches show that people rely on reading various images to perceive the environment and obtain information during the whole time of human existence, while written languages didn’t appear until 5000 years ago. Therefore, from the perspective of biological evolution, our brain is more sensitive to images instead of written languages.
With the outbreak of social media, looking through Facebook, Twitter, Instagram or many other social media has become a routine, as a result, the amount of information people are exposed to is growing exponentially. Hence, it is much more difficult for marketers to attract the attention of their target audiences than before. Don’t be frustrated, we have infographics. The reasons why infographics are important can be concluded as the following:
- Infographics are more interesting than texts.
- An infographic is an effective tool to simplify complex knowledge and opinions, which is easier for audiences to understand.
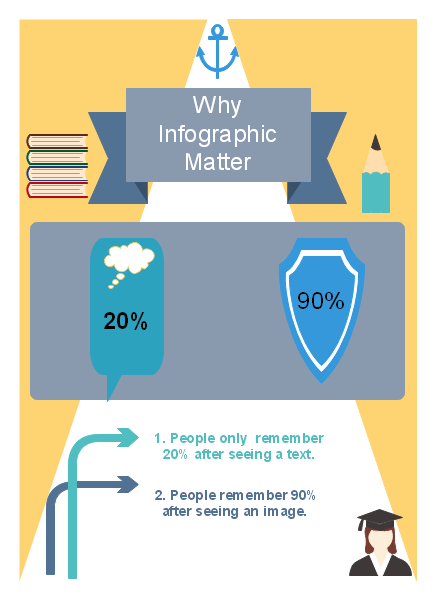
- Data shows people can remember 90% of the information on an image; however, people can merely remember 20% of the text information.
Not only having the same features as general infographics, the comparison infographic has more functions.
- When you find it hard to describe a rare product or explain an obscure concept, using comparison infographics to compare them with the common things is a smart choice.
- Using the comparative method in your infographics will make them look more professional, insightful and creative.
Funny Comparison Infographic Examples
Since you have read the definition and the functions of comparison infographic examples, now, let’s take a look at several comparison infographic examples.
1. How Californians See America VS How New Yorkers See America
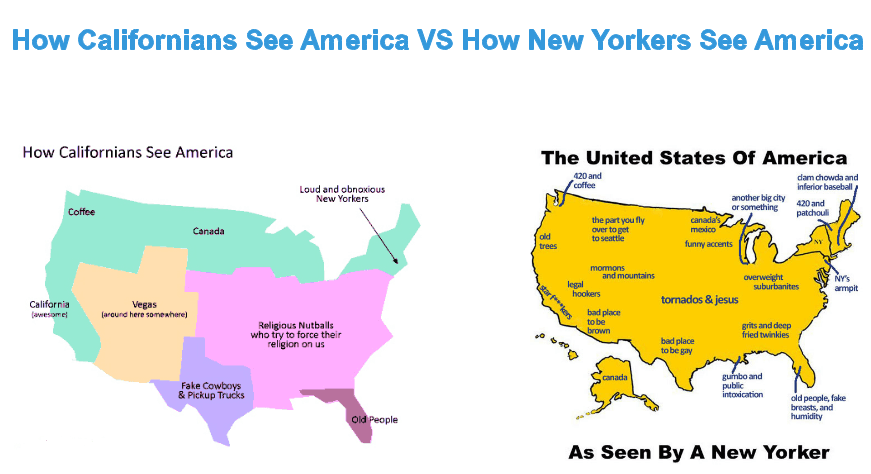
Image Source: Graphjam.com
This example reveals the difference and similarities between Californians and New Yorkers’ perspectives on America in a humorous way. From this example, we can see Californians and New Yorkers “stuck up their noses to each other”, but they achieve consensus on the impression of Florida. To put it simply, the whole infographic focuses on one variable – the perspectives on America. It has to be pointed out that selecting the comparative objects are so important that the comparison might be meaningless if you choose a group of improper comparative objects. For example, if the comparative objects are Californians and Canadians, there might be fewer people interested in this topic. On the contrary, if the theme is “Canadians see America VS Mexicans see America”, the infographic seems to be more reasonable.
2. What is the difference between the proteins in various foods?
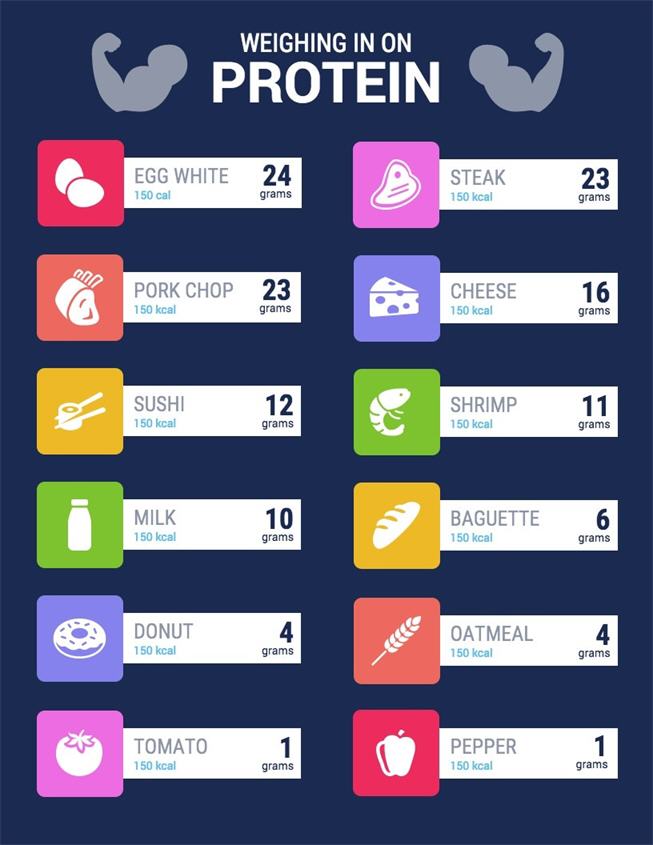
Image Source: Venngage.com
Are you on a diet? When talking about a healthy lifestyle, many people may suffer from drinking skimmed or low-fat milk instead of whole milk. Many people, however, are getting used to check the calories, proteins, and vitamins before buying foods or drinks, even it is the yummiest food on earth. Comparing with plain text or a tedious form, an eye-catching infographic is capable of attracting people’s attention immediately to help them find what is the best food for today’s dinner and make the reading experience more relaxing because of using a contrasting color and appealing symbols.
As you can see, the amount of comparative objects is unlimited, you can add as many items as you want. However, clarifying the variable is the very first step in creating a comparison infographic. From this example, we can find the variable is the weight of protein, so the comparative objects have one thing in common – they are foods containing protein. It should be noted that there is only one variable in a group of comparative objects, otherwise, the whole comparison will be meaningless.
3. Raising a Baby VS Raising a Fur baby
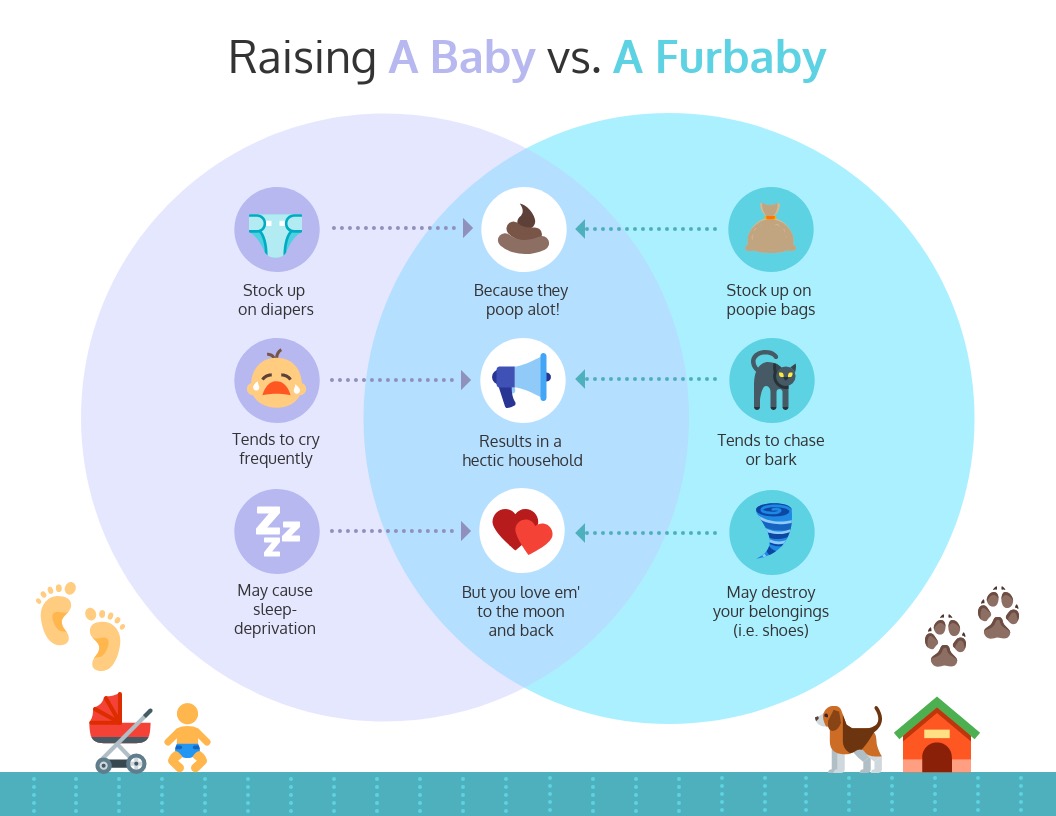
Image Source: Venngage.com
Have you ever had an unforgettable pet-owning experience? From the day the little cutie came into your house, you started to take responsibility for the health and welfare of it. To some extent, raising a fur baby is similar to raising your baby. Simply take a look at the picture above, it’s not difficult to summarize the similarities by comparing the ways of caring for them. Even though we can compare both differences and similarities of two items, there is only one variable – the way of raising.
How to Create a Marvelous Comparison Infographic?
After learning the basic knowledge of comparison infographics, are you ready to create a stunning infographic? Wouldn’t it be amazing if designing a comparison infographic was as easy as writing an article? Actually, you can make it because all you have to do is to download EdrawMax and register an account to get started.
Before creating your own comparison infographic, several aspects should be taken into consideration:
- Set a clear goal for your comparison infographic; it can be educational, entertaining or promotional
- Identify your target audience
- Select the topic you’re going to share, collect relevant facts or opinions, and prepare the content
- Always remember the comparison is closely related to the variable
Miguel de Cervantes said, “To be prepared is half the victory.” Thus, creating a marvelous comparison infographic is no more difficult. Here is a step-by-step guide for you:
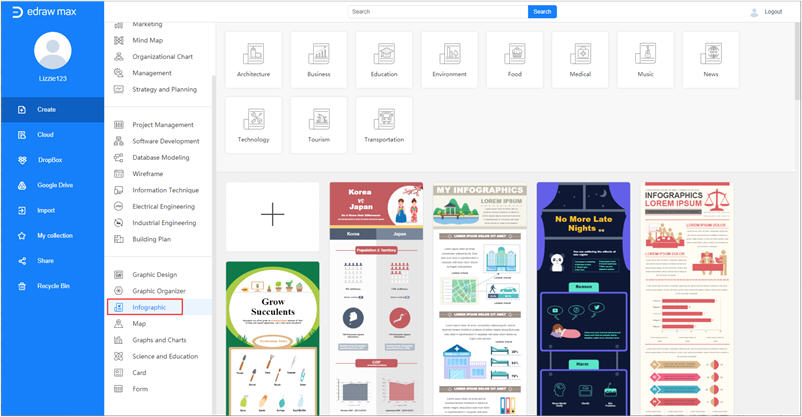
Step 1: Choose your desired infographic template
The quickest way to get started is to choose your desired comparison infographic template from Edraw’s library. No matter your topic is, you can find one template that can match your needs.
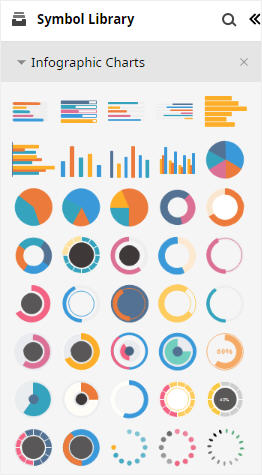
Step 2: Add your symbols, shapes, icons, and contents
Looking through Edraw’s symbols library, you will be surprised by its abundant appealing symbols, which can help you save a lot of time. Simply drag and drop the ones that you need, add your content, you can effortlessly create a comparison within minutes.
Step 3: Customize every detail according to your needs
EdrawMax’s powerful customizability is one of the features that should be praised about. Feel free to adjust text, font, style, background to satisfy your needs and you are also allowed to add images from your local disks and design your own symbols.
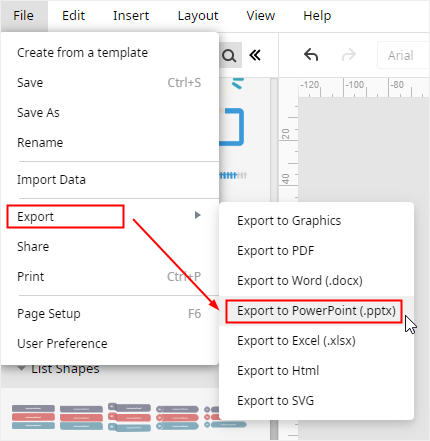
Step 4: Export, Print, and Share
After finishing your stunning work, just go to the File tab to save it. Simply choose the file format you want and export it. At the same time, you can click the Share or Print tab to promote it to a wider audience.
John Muir said,“In every walk in with nature one receives far more than he seeks.” In every step in the process of creating your own comparison infographics, you receive far more than you can imagine. Why hesitate? Let's start it now!
Edraw Content Team

