Accounting Flowchart Complete Guide
Edraw Content Team
Do You Want to Make Your Accounting Flowchart?
EdrawMax specializes in diagramming and visualizing. Learn from this accounting flowchart complete guide to know everything about the accounting flowchart. Just try it free now!
Flowcharts have a way of presenting processes, workflows, and plans in a way that most people can understand. If you’re working in the accounting department, there’s a lot that a flowchart can help you with.
The fact is most accounting processes include a lot of complex steps. Accounting flowcharts help you slow down and identify bottlenecks. This way, you can look for ways to streamline existing workflow or add new ones. Not only that, but these flowcharts also improve communication and collaboration between members of the department. This article further explains more about accounting flowcharts with examples and outlines the best practices when creating one.
1. How Does an Accounting Flowchart Work?
Keeping everyone on the same page is critical to achieving accounting department goals. Visual representations can help to simplify information with complex workflows. An accounting flowchart helps you swiftly evaluate a process and consider important activities you may have neglected.
In short, a Accounting Flowchart is simply an illustration that shows the layout of a rack. However, keep in mind that this is not just any of those racks found in the office or at home. Instead, they are those racks that are used to organize and hold servers and other information technology equipment. Creating a Accounting Flowchart will help you plan and document your server rack. It will also help reduce errors, save space, help you handle any changes, especially if you will add any equipment, and prevent unnecessary equipment purchases.
Here are some ways your team can benefit from an accounting flowchart:
- Facilitates visual clarity for continuous improvement
- Improves communication
- Establishes training materials
- Assists with documentation and compliance
The key to bringing ideas into your teams is ensuring the processes work together. With an accounting flowchart, you can identify repetitive, divergent, and contradictory steps more easily. Looking at your plans and workflow might also provide insights for improvements. With an accounting flowchart in front of you, you can handle all questions and guarantee the team moves forward in unison.
The accounting department must have a clean audit trail. That means your team should have a tool to communicate processes, actions, and directions. It's good that you can use accounting flowcharts to give your team a starting point. This way, you let everyone knows their tasks.
An accounting flowchart serves as a teaching tool for you and your team. You can use this to develop best practices based on your most successful ventures. You can also use them to teach and train new hires. By doing so, the accounting workflow won't overwhelm new employees.
Organizations frequently document processes to comply with industry requirements and support implementations and configurations of accounting processes. In some instances, accounting flowcharts provide customers with the assurance that a company is dependable, secure, and on top of its game.
2. Accounting Flowcharts Symbols
Online accounting flowchart examples all have one thing in common: symbols. These are separate and serve predefined functions.
You can go to Flowchart Symbols and Their Usage to learn more about flowchart symbols.
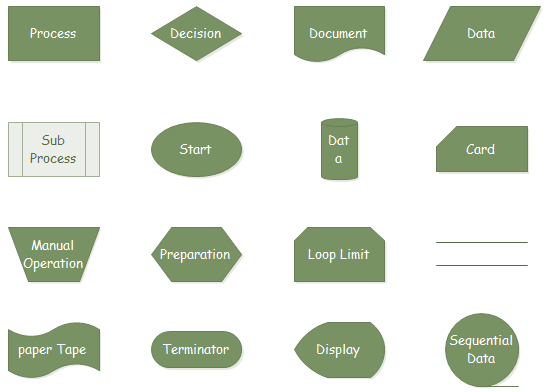
- Process: This represents any processing function
- Decision: This symbol is used to check any condition or make a decision with two probable outcomes. For example, true or false.
- Data Shape: This indicates whether the information is entering or exiting the process from outside sources.
- Terminal Points: This indicates the beginning or end of the flowchart, such as in the accounts receivable process flowchart.
- Delay Shape: This represents a period of inactivity during which no activity is performed.
- Off-page Reference: This uses a series of hyperlinks to connect two flowchart pages. It also connects a sub-process shape to a separate flowchart page that shows the stages in that sub-process.
- Document: This shows data that is readable by humans, such as printed output.
- Magnetic Disk: This is a method of computer storage that stores data on magnetic disks.
- Punched Card: This is a method of computer input in which data is entered via a punched card.
- Punched Tape: This is a method of computer input in which data is entered via punched tape.
- On-page Connector (Sequential Data): This shows a transfer of data.









3. Accounting Flowchart Examples
There are different ways you can use a flowchart in business. See the accounting flowchart examples below.
- Accounting Process Diagram
- Accounting Receivable Flowchart
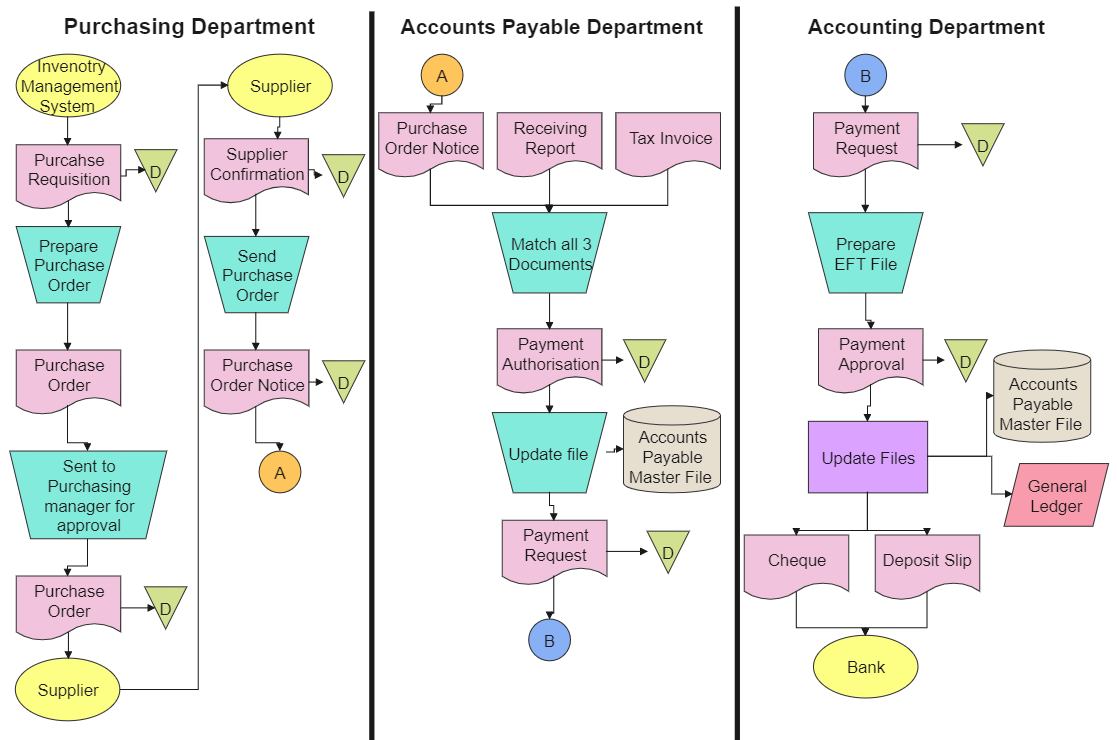
- Accounts Payable Flowchart
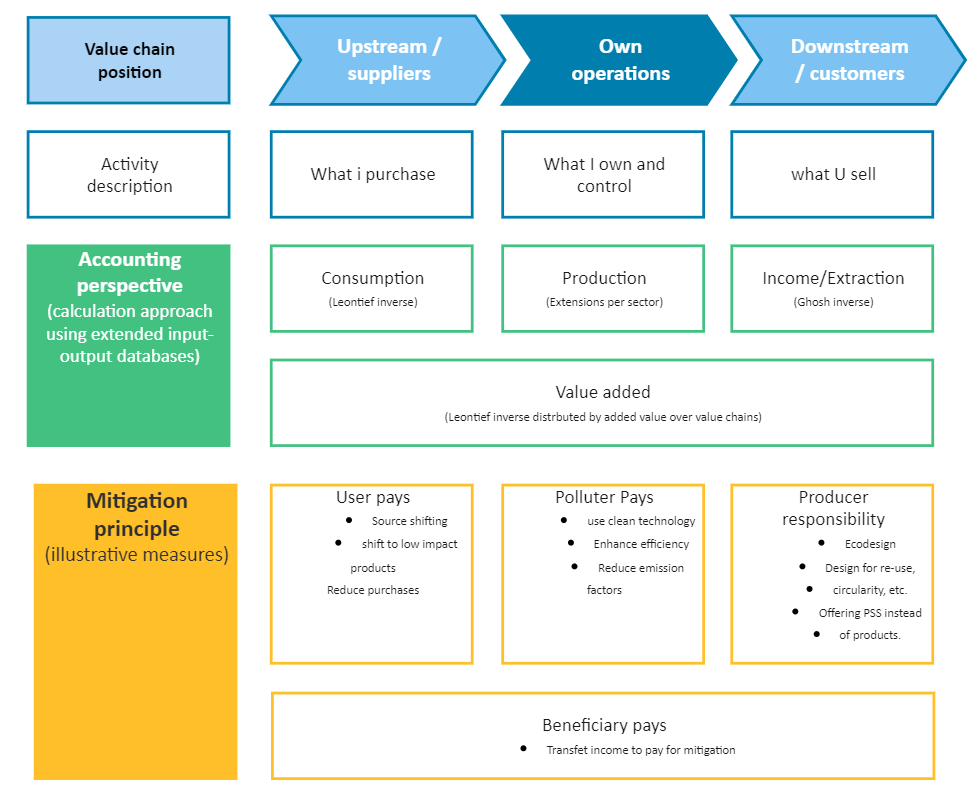
- Accounting Value Chain
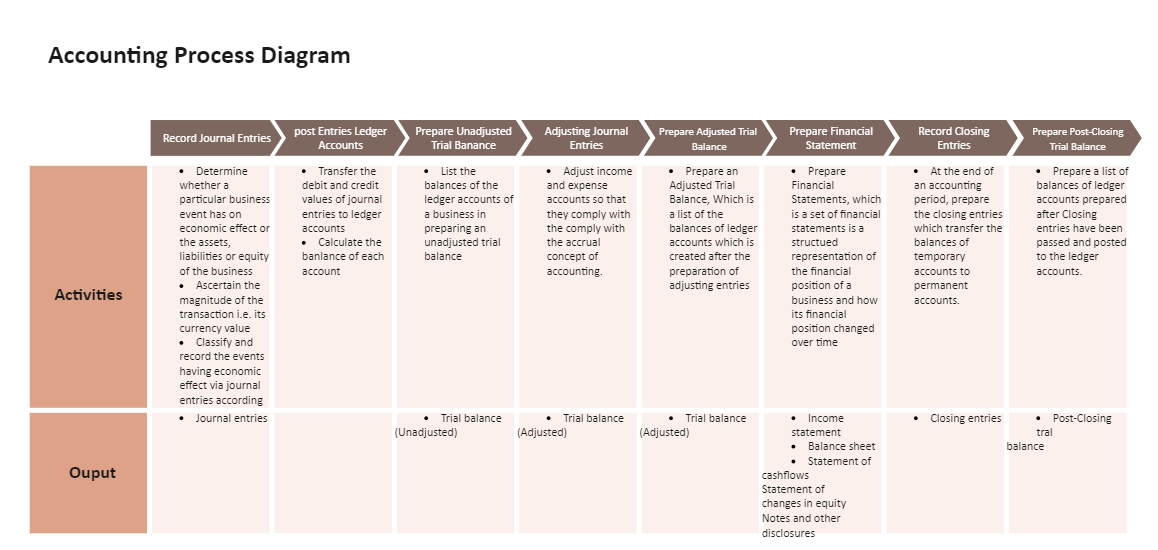
Example 1. Accounting Process Diagram
This accounting flowchart example shows the most crucial steps for recording the financial transactions of a business. A complete accounting cycle starts with recording journal entries and ends with a post-closing trial balance.
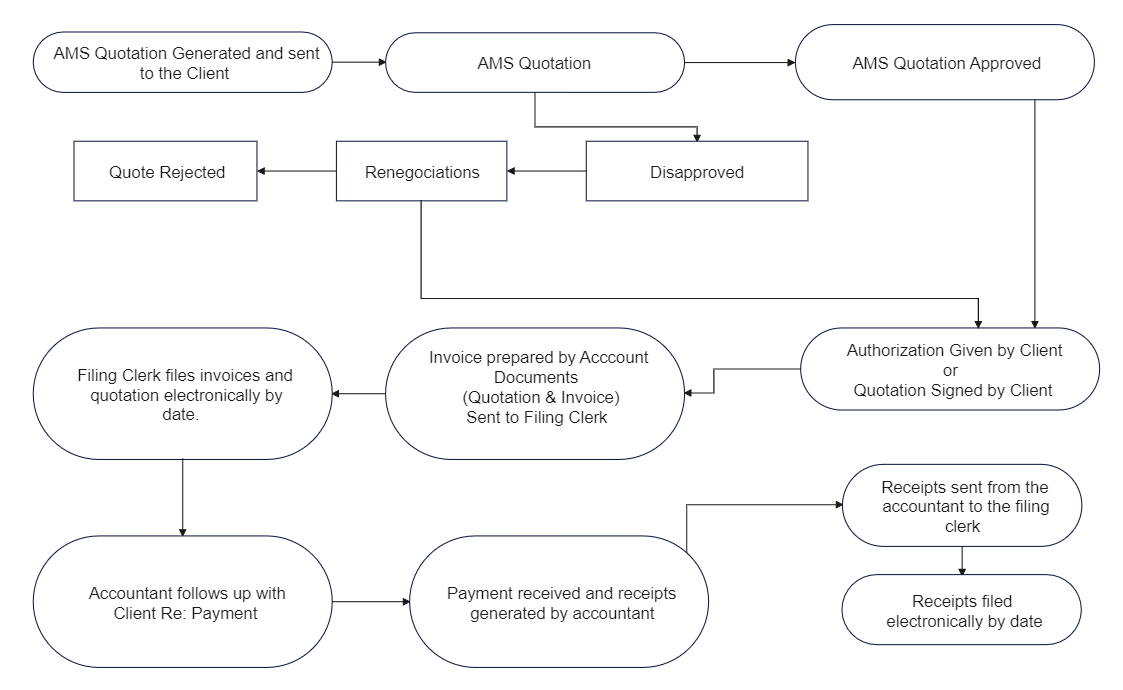
Example 2. Accounting Receivable Flowchart
An accounts receivable flowchart is a step-by-step process for recording and collecting a debt. A company's A/R collections approach is frequently a circle rather than a straight line because the workflow repeats when the consumer makes a new purchase.
Example 3. Accounts Payable Flowchart
This accounting flowchart example shows the whole cycle of the accounts payable process. It includes gathering invoice data, encoding invoices with appropriate records and cost centers, authorizing invoices, matching invoices to purchase orders, and posting payments. The accounts payable procedure is simply one component of what is known as procure-to-pay (P2P).
Example 4. Accounting Value Chain
A value chain is a step-by-step business model for taking an idea and turning it into a product or service. Businesses can increase their workflow efficiency using this accounting flowchart example. Also, this accounting value chain can provide the most value at the lowest possible cost.
4. EdrawMax: an Easy-to-Use Tool to Visualize Your Accounting Workflow
An accounting workflow allows you to know what projects are ongoing, who is working on them, and their timetables. It helps any department, especially the accounting or finance department, to simplify processes and task assignments.
For this reason, you would need a flowchart maker to visualize your department’s workflow easily. EdrawMax is an easy-to-understand solution for creating professional and attractive charts, diagrams, and more. It helps businesses illustrate processes, organizational charts, and even floor plans in a simplified way. Understanding its best features will help you create an effective
Wide Range of Customizable Accounting Flowchart Templates
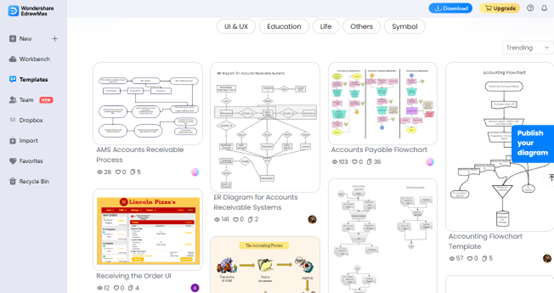
Using EdrawMax, whether online or through an application, can save you a lot of time working on an accounting flowchart. It is an all-in-one online solution and software tool that lets you build accounting flowcharts. You can create your flowchart or choose from their library of free accounting workflow charts.
User-friendly Interface
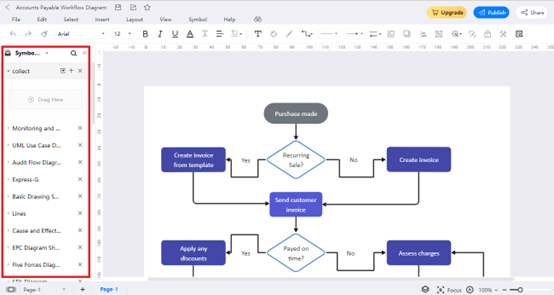
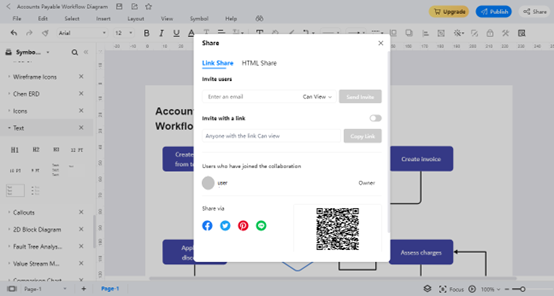
The software has a user-friendly interface, making it easier for you to understand its features and functions. The responsive toolbars are positioned on the left to help you customize the features. Here, you can choose shapes, diagrams, symbols, lines, and images to add to your flowchart. You can also drag and drop images from your device to personalize your drawing. Here is what your accounting workflow will look like in EdrawMax Online:
Design Management
Built-in Connector Tools
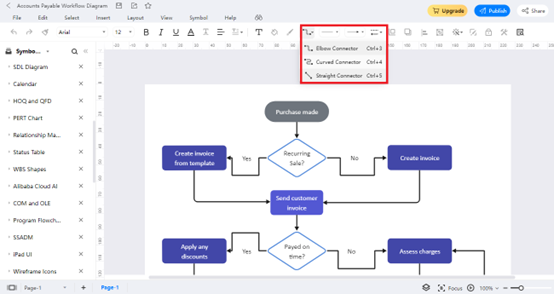
Connect your processes with EdrawMax built-in connector tool that you can find in the toolbar on top. This allows you to organize your flowchart better, so readers understand the processes easily. You can use elbow connectors, curved connectors, or straight connectors, depending on what you need.
Different Shapes Available
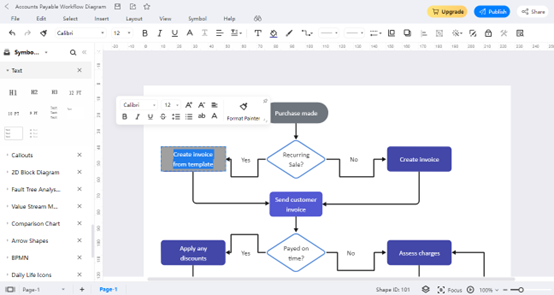
Add text to your shapes by double-clicking your selected shape. You can also format the text with the menu that appears after double-clicking the shape.
Text Toolbar for Formatting
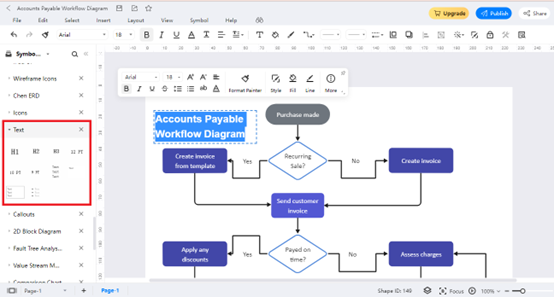
Once you’re done with your flowchart, don’t forget to add a title. Choose Text from the toolbar beside the page and drag and drop any Heading on your drawing. This way, you and your readers will know what flowchart they’re looking at.
Save or Export to Different File Formats
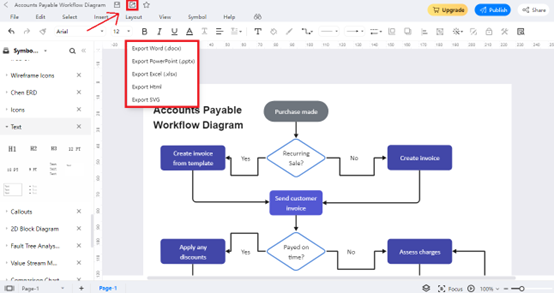
When you’ve covered everything in your flowchart, you can save the drawing and export it to different file formats. Click Export at the topmost part of the page and choose a file format you want the drawing to have when you save it to your device. This feature lets you view the flowchart either in Word, PowerPoint, and Excel, or convert it to an HTML file or vector file (SVG).
5. Best Practices in Creating an Accounting Flowchart
The main purpose of flowcharts is to make concepts a lot easier to understand. If it made the accounting process complicated, then you need to revise the whole flowchart. To make it a more effective tool for the department, you need to follow some best practices when it comes to creating flowcharts.
Determine Why You’re Creating the Flowchart
This is the most important tip when you’re creating a flowchart. You need to know why you’re drawing one in the first place. It can be that you’re documenting processes or managing workflow among members of the department.
You also need to know who your audience will be. For instance, if you’re presenting the flowchart to your coworkers, you need to use standard flowchart symbols. And if you’re presenting to top management, you need more technical symbols.
Create Multiple Sub-flows
Your flowchart should be short and simple. If not, readers will lose track of the information you’re trying to convey. EdrawMax has a built-in connector feature that lets you link sub-flows automatically.
Include Teammates in the Process
You need more than one team member to document the processes and planning steps in the department. There will be times when you overlook things, so having someone review the flowchart helps in its accuracy. The collaboration feature in EdrawMax can make it simple to get this process started.
Take Advantage of the Colors
The best way to present flowcharts is to use colors to distinguish different concepts in the chart. Fortunately, it’s easy to color-code elements in your accounting flowchart with EdrawMax. Just remember to put a legend below or beside the chart so that everyone can understand how to read it.
6. Final Thoughts
Understanding how to process flowcharts to help in accounting is the first step to an effective system within the department. With a dedicated solution like EdrawMax, you can make accounting flowcharts that are attractive, interactive, and easy to understand. Take advantage of this flowchart-making tool for better and more productive accounting processes and procedures.
Flowchart Complete Guide
Check this complete guide to know everything about flowchart, like flowchart types, flowchart symbols, and how to make a flowchart.
You May Also Like
Personal SWOT Analysis Complete Guide
Knowledge
Human Anatomy Complete Guide
Knowledge
Digestive System Diagram Complete Guide
Knowledge
Programming Flowchart Complete Guide
Knowledge
Organizational Chart Complete Guide
Knowledge


