What is a Physical Map?
Know it All about Physical Map
Physical maps are what we usually could see when having a geography class or going traveling, they use different colors on heights to clearly show the topography of the area. If you want to know more about the physical map, keep reading.
A physical map tries to replicate and display the physical features of a terrain displayed on the map. They are designed in such a manner that the natural landscape features of Earth are quite apparent and easy to read. Color grading along with keys are used to provide more context to the 2-D paper map.
A physical map as discussed tries to replicate all the visual information regarding the terrain. They clearly show topographical features even in a 2-D form. By the use of colors and specialized key, Physical Maps are the best source to understand a terrain if an individual seeks to use a paper map. Moreover, other things such as elevation of the land, important borders, waterbodies and deserts are clearly highlighted, which helps a lot in geological studies too.
EdrawMax Map Software helps to create interactive map drawings for free with easy-to-edit templates. Make it easier to find the right way on your journey.
A physical map as discussed shows geographical features, thus it can be used to identify deserts, plains, mountains, and waterbodies. If you are out on a trip and want to be well known about the terrain, you should use a physical map.
Some modified versions of a physical map also show things such as rainfall and temperature of a place. Such a physical map can be used to deduce different calculations that you may want to make, or perhaps to choose the perfect place for you to visit that is within your bearable weather conditions.
You May Also Wonder: How to Use Weather Clipart
A Physical Map has a key that is used to read the map and have a better understanding of the Map that is in front of you.
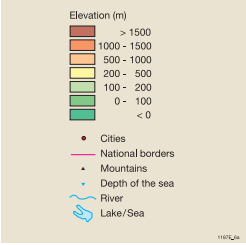
A normal Physical Map consists of a key mostly at the bottom in a horizontal position or on the side in a vertical position. The next step is to understand the meaning of what the symbols represent and mean.
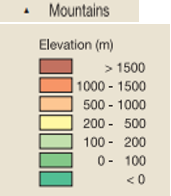
The most important part is the elevation of the topographical features represented on the map. The map uses colors to demarcate the difference in altitude of different features. The spectrum starts with blue and slowly turns towards bright red as the elevation increases. Usually since the bright red shows all elevations above 1500m, a black arrow facing upwards is placed with a numerical value on its side, the numerical value shows the height of the mountain.

National borders present on the map are usually shown with a red line, if any other color is used, it is shown in the key. While the city names are written with pink in most cases.

Rivers are usually shown with a simple line to give emphasis on the land features around it. While the lakes and seas are shown on a larger scale as they are bigger waterbodies. Another key feature about waterbodies such as the Sea and Oceans is that a small blue arrow facing down is usually found on the waterbody, with a negative numerical value, this numerical value shows the depth of the waterbody.

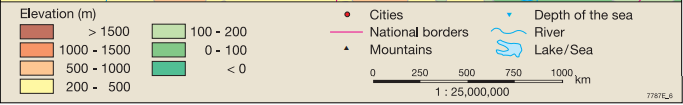
One of the most important components of a map is the scale. A scale is used to measure distances easily, since you cannot replicate the exact same distance on a map, a scale is used to calculate its size in real life. In this particular case it means that 1 cm on the map is equal to 25,000,000 or 25 million centimeters in real life.
Using this key, Physical Maps can easily be read and interpreted.
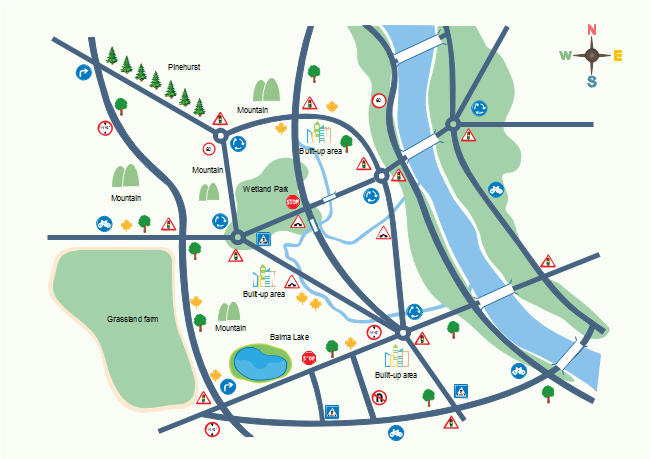
In this Physical Map of the world the different topographical features can be clearly seen due to the different colors used. On the bottom left you can see the key while on the right bottom corner, the scale to be used. On this map a lot of the features my not be highlighted, as only important mountains and their elevation is mentioned. The world Physical Map aims to provide an overall picture of the world, so all the key features of all the areas might not be highlighted.
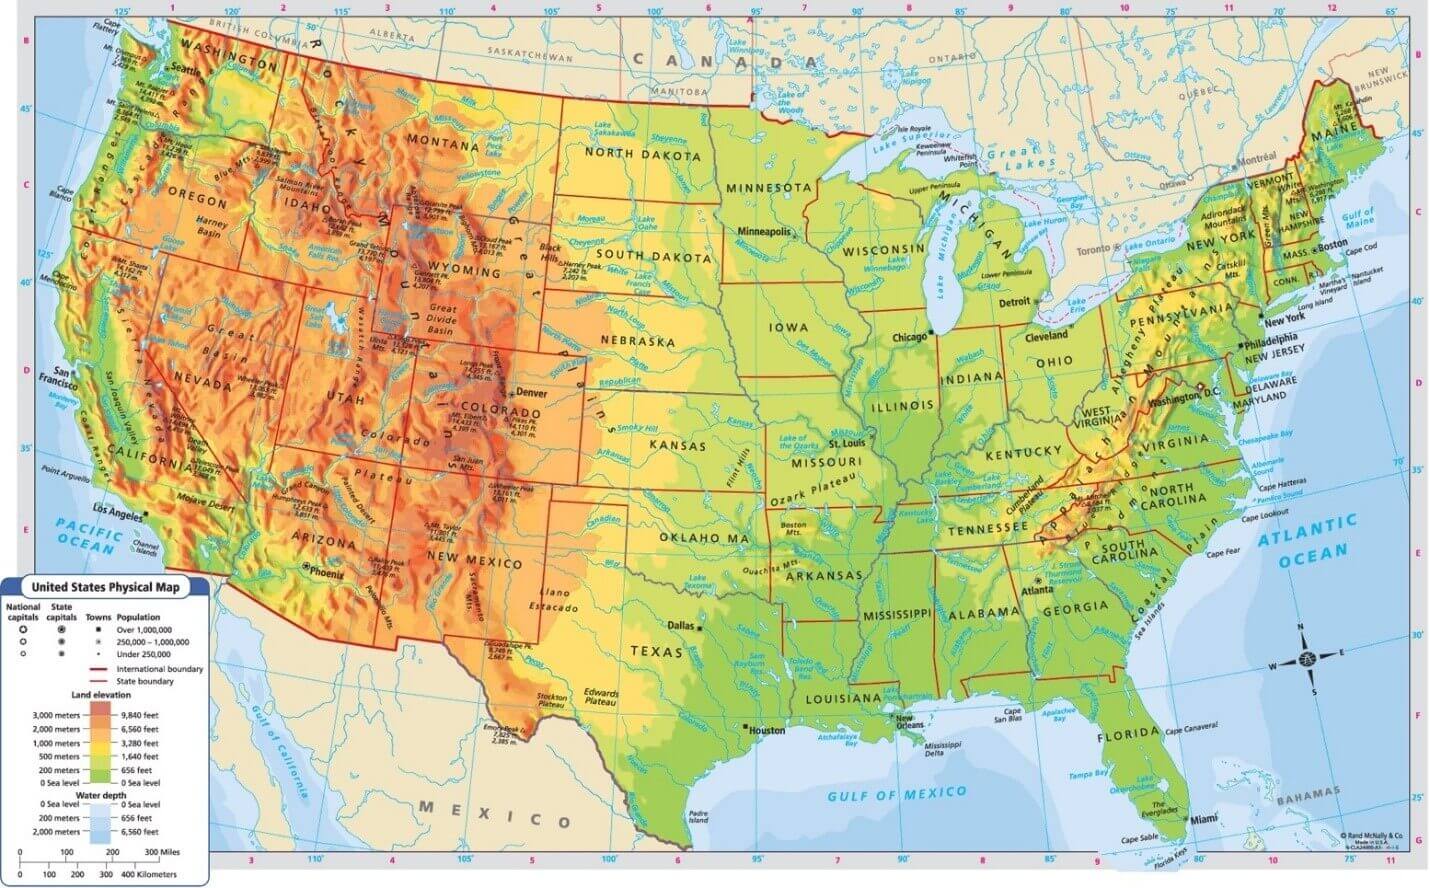
In this Physical Map it can be seen how the topographical features are outlined much more efficiently. There is also a detailed key in the bottom left, showing how many features can be added, if a physical map is focused on one specific area. Even the sea level of the waterbodies is differentiated on the basis of shades of blue. Almost all the important heights on the map are recorded and shown. The state lines are also visible.
Both these examples show the two different degrees in which physical maps are used, if the area is specified further, more features can also be identified.
Physical maps are an important paper map that is very useful for case studies. In the absence of a 3-D Map, this 2-D maps visualizes the landmarks one seeks to see. They are also the basis on which political maps are drawn and made. All together Physical Maps are important for topographical understanding and of great use to geologists and pilots.