UML Activity Diagram
- Part 1: What are UML activity diagrams?
- Part 2: Purpose and Benefit
- Part 3: Activity Diagram Components
- Part 4: What do We Use Activity Diagrams for?
- Part 5: Activity Diagram Notations
- Part 6: Tips for Creating Activity Diagram
- Part 7: How to Create an Activity Diagram in EdrawMax?
- Part 8: Classic Activity Diagram Examples
- Part 9: Summary
Part 1: What are UML activity diagrams?
UML (Unified Modelling Language) Activity Diagrams are used to illustrate how actions flow in a system while referring to its steps during the execution. The focus is on how events around the steps create a smooth workflow.
These diagrams come in 2 types:
- Structure diagrams
- Behavioral diagram
A UML activity diagram is, in this case, a behavioral diagram. It is because the general UML diagram depicts the system's behavior in the decision-making process as it responds to events surrounding the steps involved.
These activity diagram tools are standard in business and engineering environments as they all work with systems.
Part 2: Purpose and Benefit
Activity diagrams are used to show the dynamic nature of a system. They are also used to describe the executable system by using forward and reverse engineering techniques.
Activity diagrams provide various benefits to users. For example:
- Activity diagrams are essential to demonstrate the logic of an algorithm for all stakeholders. Furthermore, it helps in controlling errors and deviations in the implementation phase.
- Activity diagrams extend the use case diagrams to clearly illustrate the business process and workflow between end-users and the system. Activity diagrams also help simplify and improve the route to analysis to implementation by clarifying any complex use cases.
- Activity diagrams provide details of the steps performed to complete the use case functionality.
- They are also valuable for modeling software architecture artifacts, including methods, functions, and operations.
Part 3: Activity Diagram Components
Since UML consists of many types of diagrams, it is essential to know the basic notation of every diagram separately to create relevant drawings. In addition, activity diagrams also have a couple of essential components. These components are discussed in detail here.
Activities
An activity represents the non-interruptible action of objects. Activity may consist of one or more steps. For example, action nodes show action, control nodes that show control flow, or object nodes that describe objects used inside an activity.
Activity partition
An activity partition, also called a swimlane, is a high-level grouping of related actions. For example, a swimlane may refer to classes, use cases, components, or interfaces.
Fork and Join nodes
Fork and join nodes are used to represent concurrent flows within an activity. A fork node has an incoming edge and multiple outgoing edges, just like decision parameters. When the input comes at the incoming edge, it is duplicated and transferred to various outgoing edges simultaneously. Hence, a single incoming flow is divided into multiple parallel flows.
A join node is the opposite of a fork node in concept. It has multiple incoming edges and a single outgoing edge. It performs a join of all incoming edges through a logical AND operation.
Pins
An activity diagram can get very complicated and challenging to read if they have many paths of flow. Pins help in making the charts neat and clear. Pins are object nodes that represent one input to or an output from an action.
Part 4: What do We Use Activity Diagrams for?
You'll meet activity diagrams in various corporate structures and engineering fields of expertise. They are very useful:
- Understanding a system's functionalities
- Predetermining future outcomes
- Strategizing
- Identifying a system's requirements
In this case, a method is illustrated with its components labeled as objects for study. The flow from one point to another is also indicated. Through such, you will be able to gain insight into how, for example, various departments relate
Your purpose here could be to establish certain managerial concepts and how to complement or improve them. Even in engineering designs, the use of activity diagram examples gives you the benefit of having full control over a system's efficiency.
You can use an activity diagram to look into the work prospects. As you take note of all the possible outcomes, you will be able to make present decisions more effectively.
It also has an added advantage of giving you the capacity to make more realistic goals that are both inexpensive and achievable.
Because of competition, the strategy has become a pivotal component to the growth and survival of a business or sustenance of a project. With an activity diagram, you can get the upper hand.
A UML activity diagram can be used to showcase key components of your environment and how they possibly relate, and you can then use the information to enhance your advantages. From this, both analysts and stakeholders will be able to draw reliable conclusions.
Where a system seems slow, faulty, or needs an upgrade, looking at an activity diagram will show you any possible gaps that may need restructuring. These could be in hierarchical management or responding time, for example, in emergency cases.
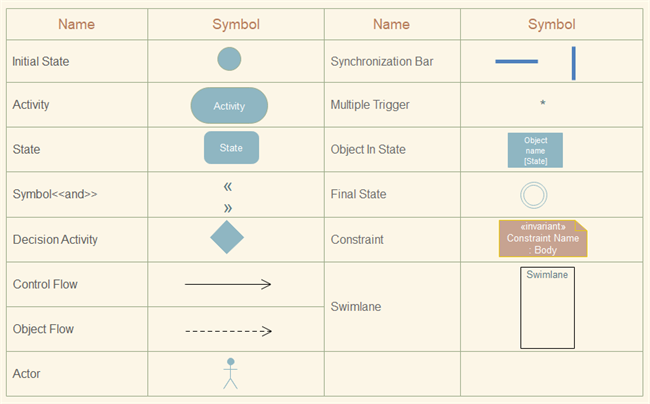
Part 5: Activity Diagram Notations
Take a look at an activity diagram, and you'll find a variety of symbols. Just like with every layout, these symbols are called notations. The basic components include:
- The Initial state
- The Action
- A decision state
- Flow Controls
- The Final state
In every process, there is a point of origin. Where it all starts in the activity diagram is marked by a plain circle.
Action is an activity. When executed or rather triggered, there is a systematic roll of events that follow. All these are the actions and get represented by round-edged rectangles.
It is the point at of decision and is generally indicated by a diamond shape to symbolize the possibility of taking various directions in the decision-making process. There's usually input and output.
Also known as connectors, these indicate the flow in-between steps in the activity diagram.
It is the final step in the flow of an activity diagram. A circle with an outline represents it.
Let's look at these notations and their meanings.
Part 6: Tips for Creating Activity Diagram
Like other diagrams, you cannot just rush and start drawing. Some groundwork needs to be done for an accurate chart. The main element of an activity diagram is the activity which is a function performed by the system. Once you identify the exercises, you will understand how they are associated with constraints and conditions.
Once all the parameters are identified, you will have to make a map of the entire flow. This map is then transformed into an activity diagram. However, it is essential to note that you cannot translate the complete activity diagram into concrete code. This is because the activity diagrams are meant to understand the flow of activities geared towards the business users while code is for the developers.
Here are the basic steps for creating activity diagrams.
Step 1: Study the use case and identify the action steps
In this step, you will figure out what steps are required to complete the functionality of your use case. You will locate various activities and actions that are part of your business process.
Step 2: Identify the actors
You can take the basic concept from the use case diagram. However, you might find more actors when looking into it in detail.
Step 3: Find a flow among the activities.
Once the activities and actors are identified, this is time to put them in order. Here you will see the dependencies and conditions that have to be met before approaching specific processes.
Step 4: Add swimlanes
Once you figure out who is responsible for each action, group each action they are responsible for under them.
Part 7: How to Create an Activity Diagram in EdrawMax?
EdrawMax supports you in creating activity diagrams with ease and time-saving. You can use it to create an activity diagram. Follow these steps, and then your creativity can take you anywhere you want to go.
Step 1: launch the EdrawMax software.
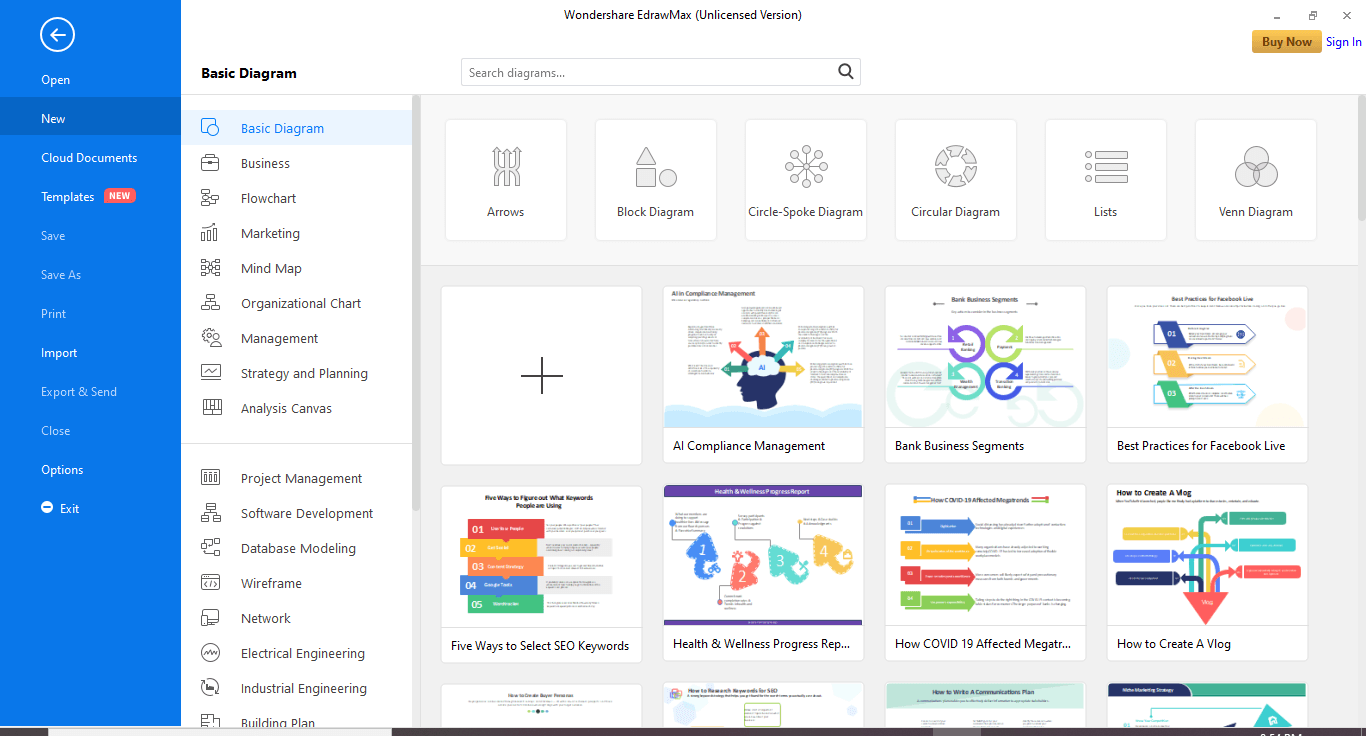
Step 2: In the left-hand sidebar, click on Software Development> UML Modelling.
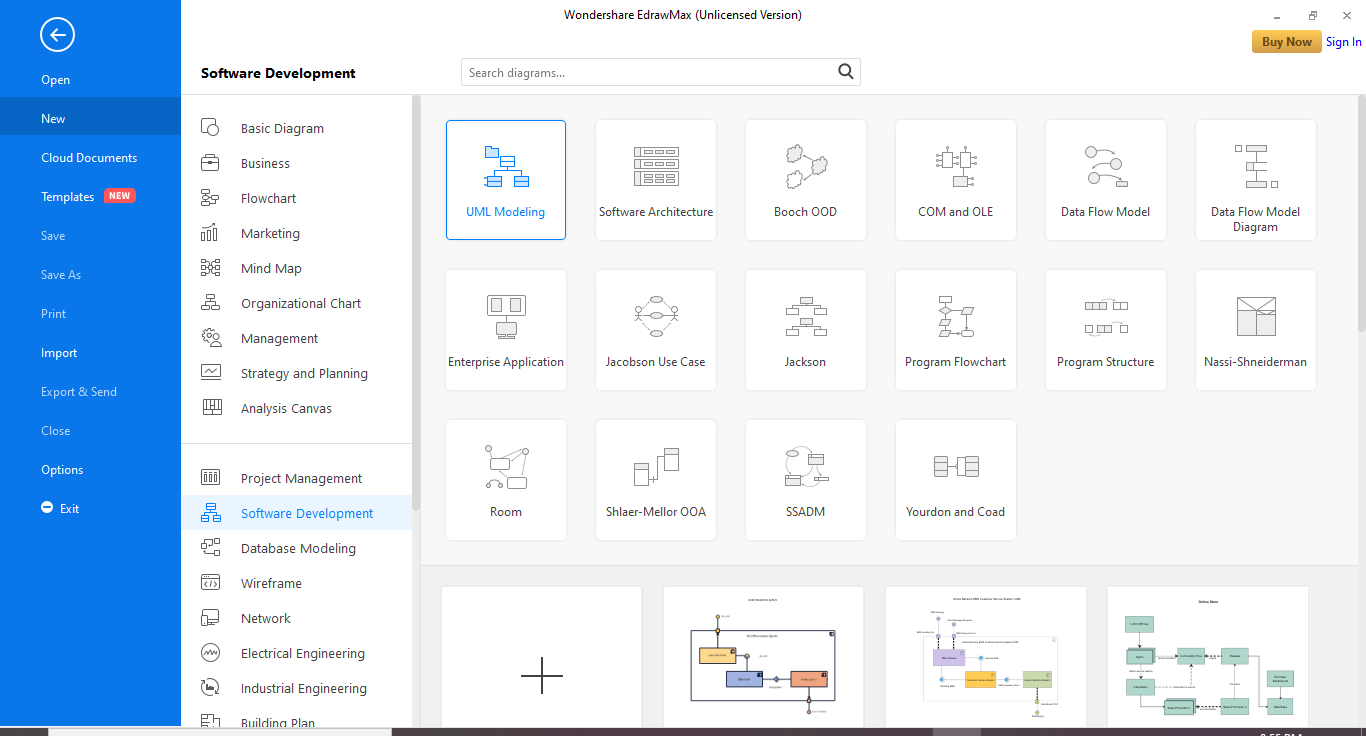
Step 3: Here, you can either create an activity diagram from scratch or choose a template.
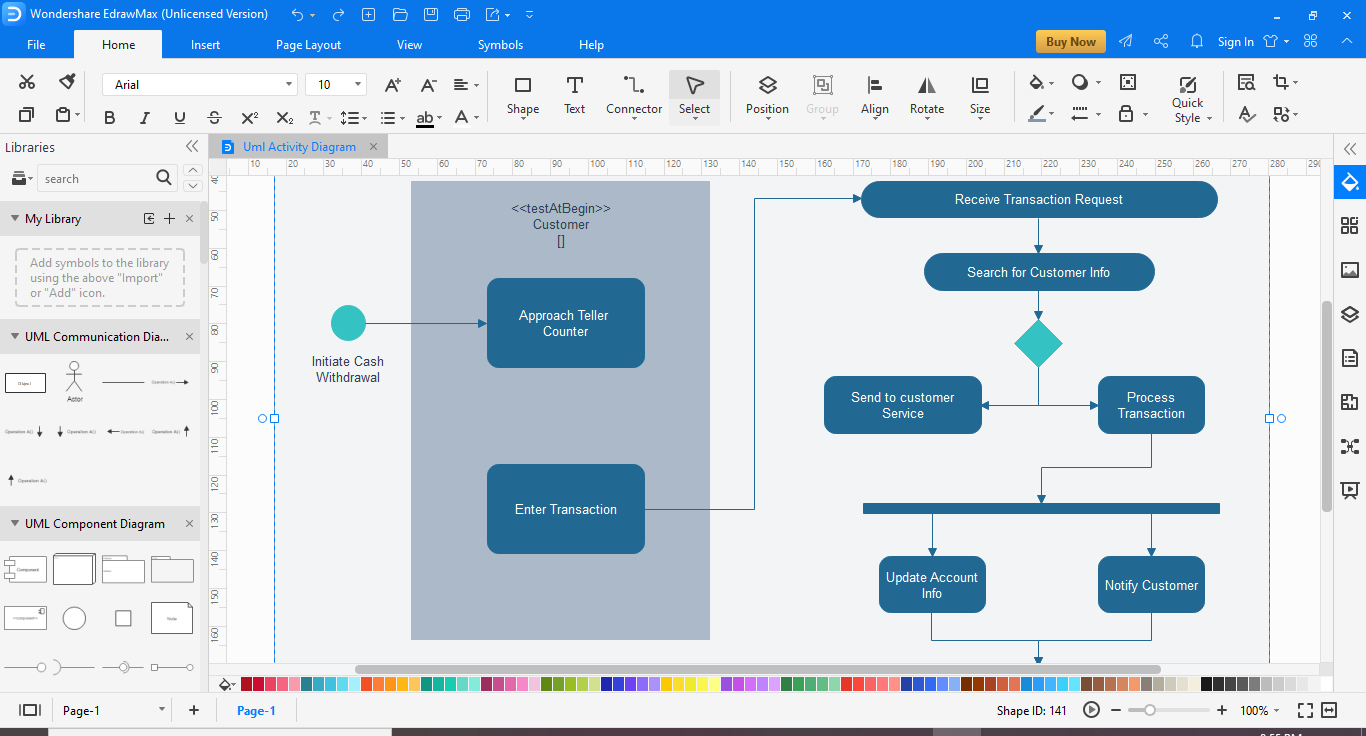
Step 4: For drawing from scratch, click "+" to open a new document. The symbol library is present on the left side. Scroll down further to find more UML-related symbols.
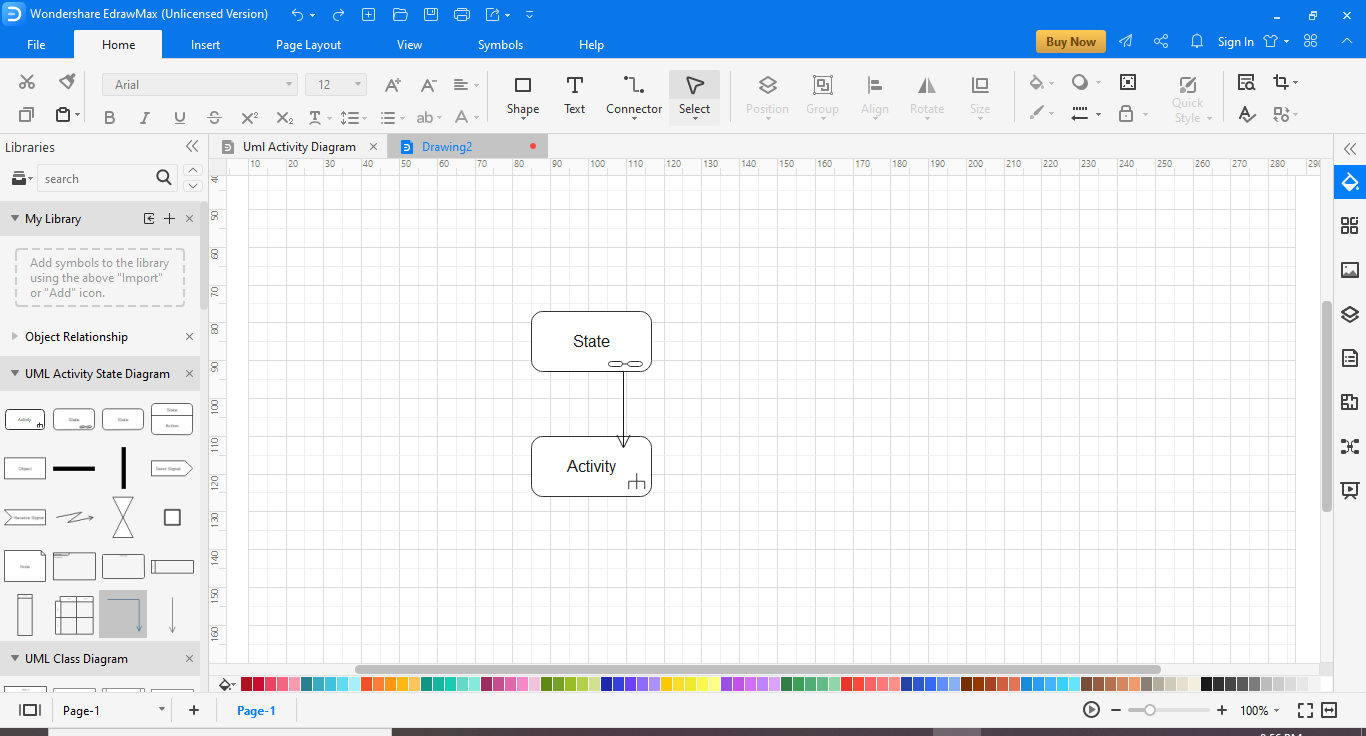
Step 5: Drag the components you need from the symbol library onto the blank document to start creating. Each element can be moved, resized, or customized to fit your needs.
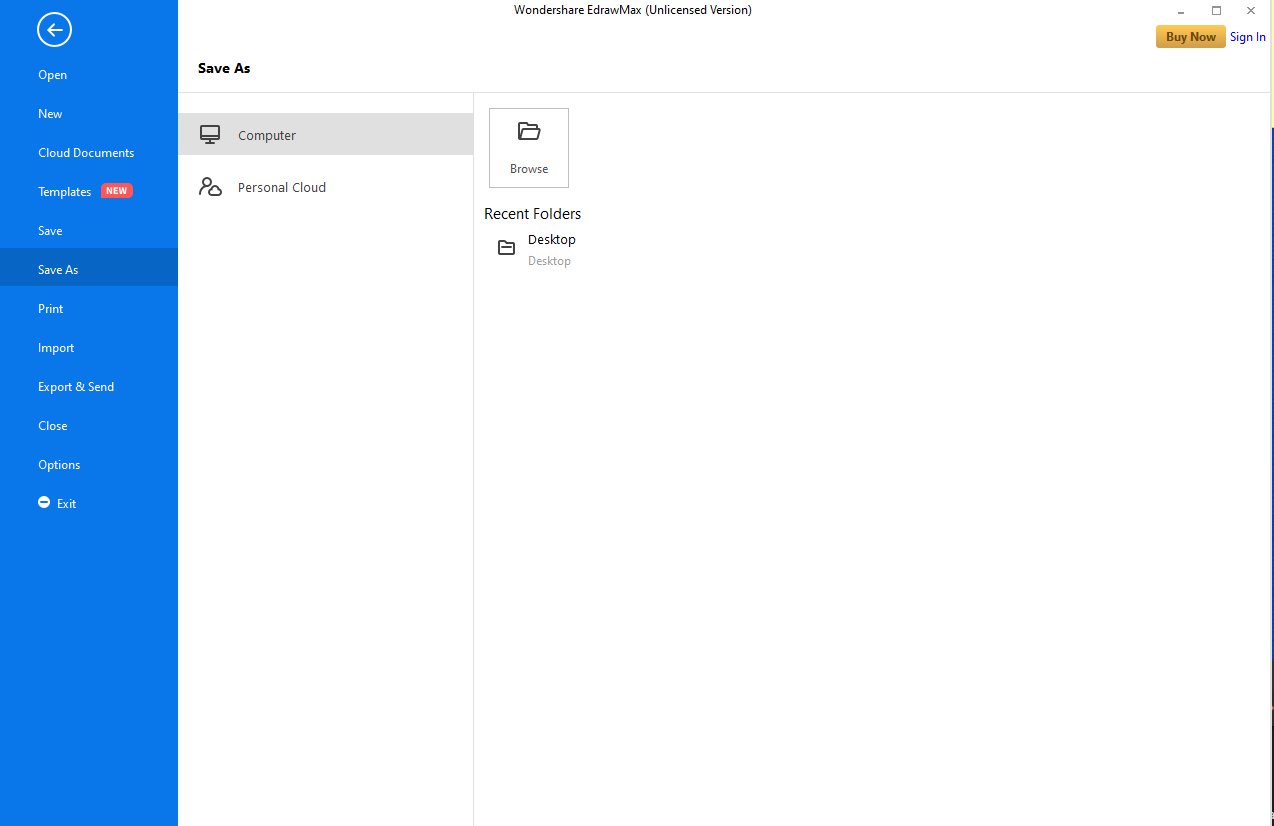
Step 6: Save your document. You can also export your drawing in multiple formats like Powerpoint, PDF, etc., for easy distribution.

An all-in-one platform for 210+ diagrams.
・ Simple alternative to Visio
・ 26k+ symbols
・ 10K+ free templates
・ 10+ AI diagram generators


Part 8: Classic Activity Diagram Examples
With the symbols mentioned above, you can also create your activity diagrams. But first, let us look at some examples to illustrate in what cases you can use the symbols above.
- Phone use process
- Shopping order process
- ATM Withdrawal Process
- Laptop Sale Process
- Activity Diagram Login Example
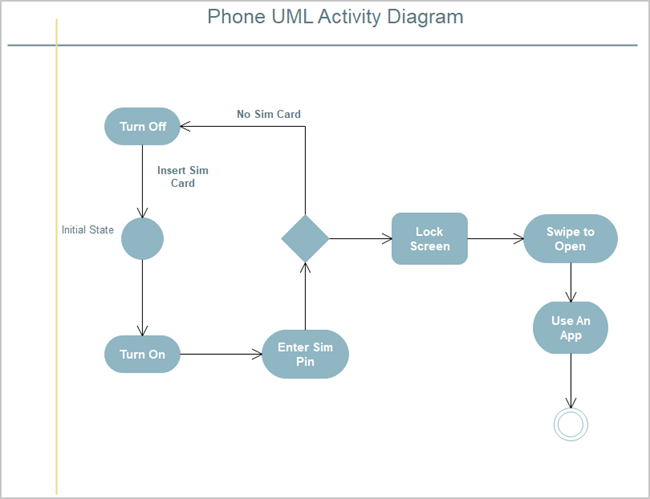
Above is a diagrammatic illustration of what steps to take as a new beginner when using your phone for the first time. The initial state represents a phone that is off. Then you have to turn it on and enter your Sim Pin. If it lacks a sim card, then you'll have to switch it off and insert it.
However, where all is well, you'll smoothly go into the locked screen and you can swipe to access applications on your phone. It is the final state.
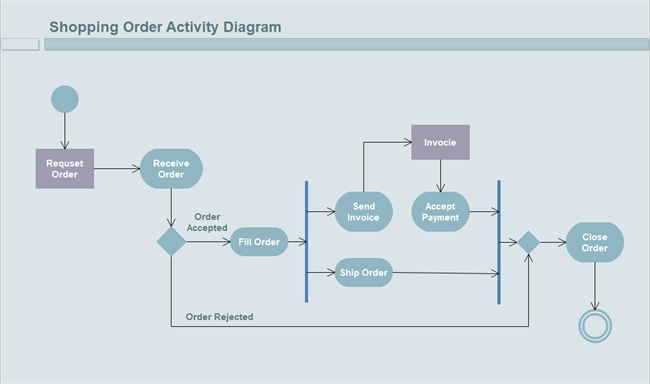
The shopping order processing above shows how to deal with an order. When it's rejected, the order will be closed. Besides, the bar represents actions that you can do simultaneously. When it's accepted, you have to fill it first, and after that, you can ship the order and send an invoice. When the order closes, the transaction is complete.
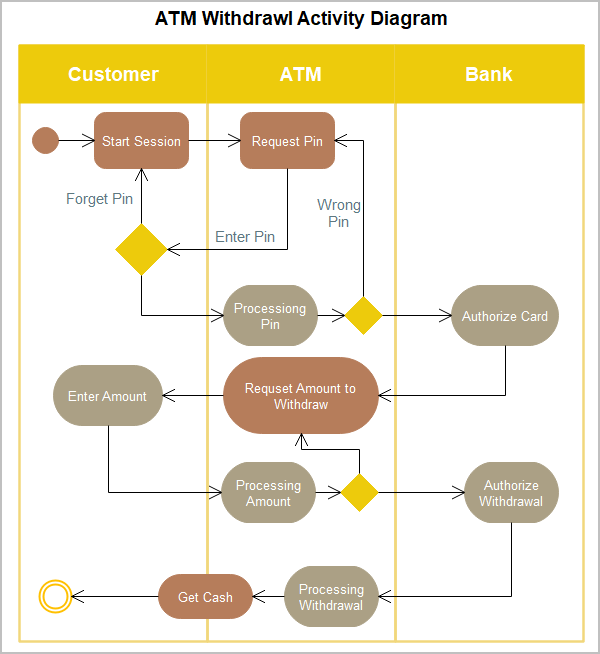
When you go to withdraw cash from an ATM, three parties will be involved, including the customer, ATM, and the bank. The ATM coordinates with the bank at various points to make the process of transaction smooth.
The initial state is the customer to start the session. The diagram displays both physical and invisible interactions until the customer gets the cash.
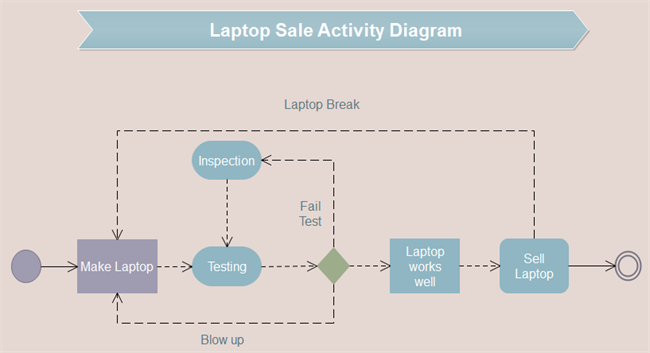
When you have a laptop and use it, it goes through the process of being made, tested, and sold. But in the diagram, you can see that some laptops failed to pass tests and then need testing once more.
During tests, the laptop can break down completely. In this case, it will be taken back to the factory for a remake. Also, when you use it, accidents usually happen and you need to replace the parts.
You must have realized the use of broken arrows. As illustrated above, they symbolize the flow of an object as it passes from one point to another.
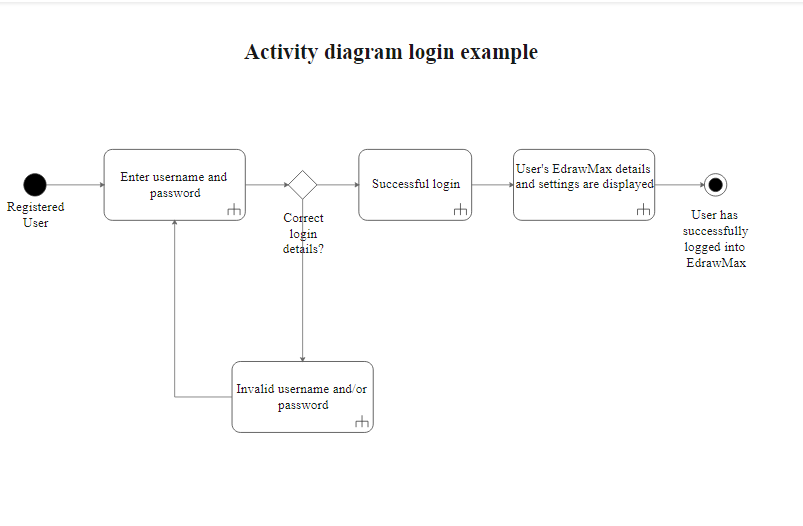
This is an example of an activity diagram for login use cases. Here, a decision node is used for branching to different paths. The user may end up at one of two outcomes. If s/he enters the correct login details, the user will follow the course of a successful login. Otherwise, if he enters the wrong login details, then a different approach is followed.
Part 9: Summary
For your designs or projects, EdrawMax will be your go-to activity diagram creator. The software certainly has rich tools and abundant examples for free use. And the MS Word-like interface will make you feel at ease.
Furthermore, EdrawMax has its software working to enhance teamwork cooperation. If you belong to a prominent organization, it is the perfect tool to introduce. Share EdrawMax with your colleagues. Your productivity will never be the same again as it will boost uprightly.
Related Articles:


