Value Stream Mapping in Six Sigma
Value Stream Mapping
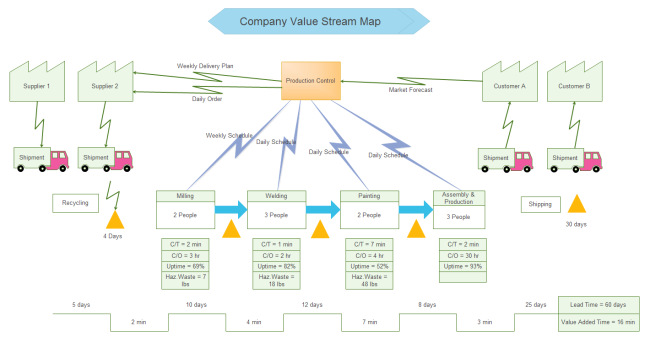
Value stream mapping is a lean manufacturing or lean enterprise technique visualization tool for documenting, analyzing and improving the flow of information or materials required to bring a product to market. A value stream map is typically created as a one-page flow chart depicting the current production path. In lean production, value is the ultimate goal for customers. Processes that do not provide any value are called waste. Value stream has been embraced as a great methodology for identifying the inherent waste, and plan to eliminate it, which is an indispensable tool in your six sigma program.
Discover More Six Sigma Tools and Templates
How to Create a Value Stream Map for a Six Sigma Initiative
- Step 1: Select your sponsor and set expectations. Appoint someone who is responsible to make decisions, arbitrate solutions, and plan the project.
- Step 2: Select your team. Ensure that each area or stakeholder of the process is represented.
- Step 3: Consider Customer.
- Step 4: Collect data and produce current state map, including process times, inventory or materials information, customer (or demand) requirements.
- Step 5: Draw the customer near the top right of your value stream map and capture the events or signals that trigger the start of the process.
- Step 6: Capture the process steps.
- Step 7: Add the process time line.
- Step 8: Identify improvement opportunities.
More Value Stream Map Templates
Edraw is a professional value stream mapping tool coming with standard built-in value streammappingsymbolsand
More Six Sigma Tools in Edraw
Edraw is an all-in-one visualization software containing flexible tools for different needs. Besides DMAIC diagram, Edraw also provides solutions for SIPOC diagram, Cause-Effect Diagram, Value Stream Mapping, Brainstorming, QFD, Affinity Diagram, Scatter Plot, RACI matrix, PDCA cycle, and much more to help finish your six sigma. Among the best diagramming tools available, this software is perfect for experienced diagram designers or those who are just getting started.
Download a free trial and see first-hand how quickly and easily you can create effective great-looking DMAIC diagrams.
More Resources
Value Stream Map Templates for Word, PPT and PDF
How to Create Value Stream Map Easily


