Gantt Chart Maker
Design and build a Gantt chart for your next project easily and quickly.
Trusted By Over 30 Million Users & Leading Brands


Why EdrawMax to Make Your Gantt Charts?
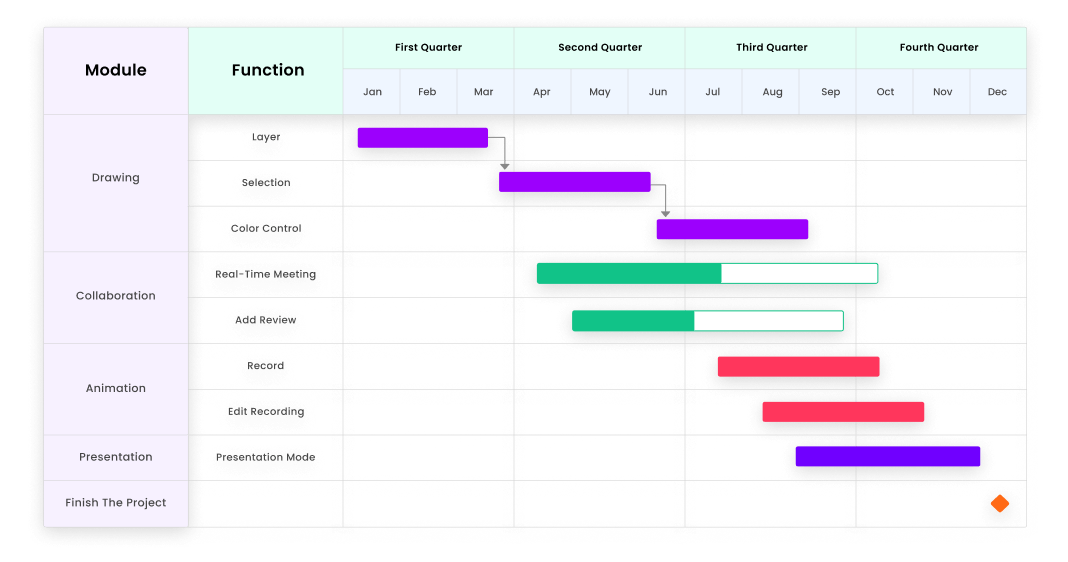
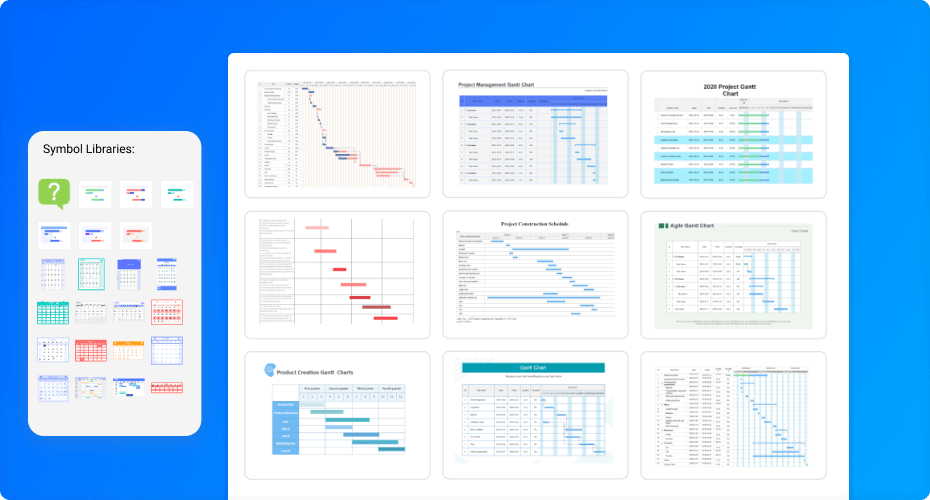
Gantt Chart for every need
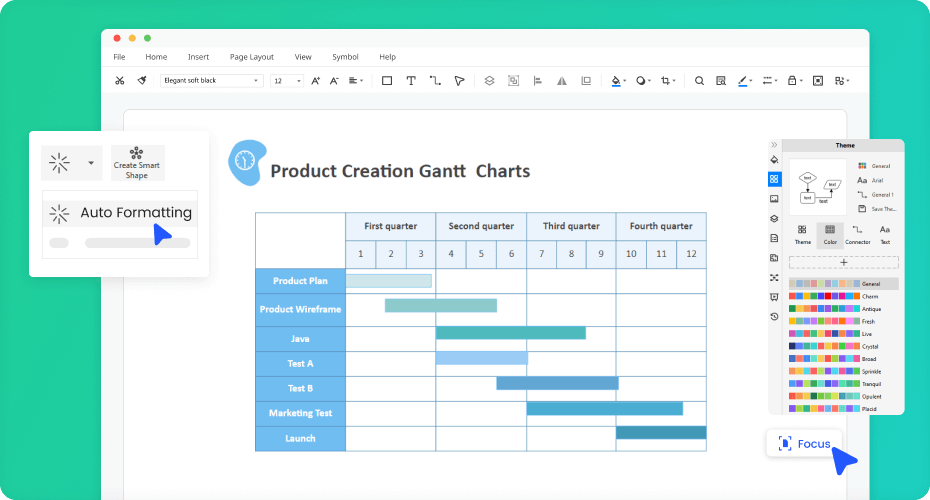
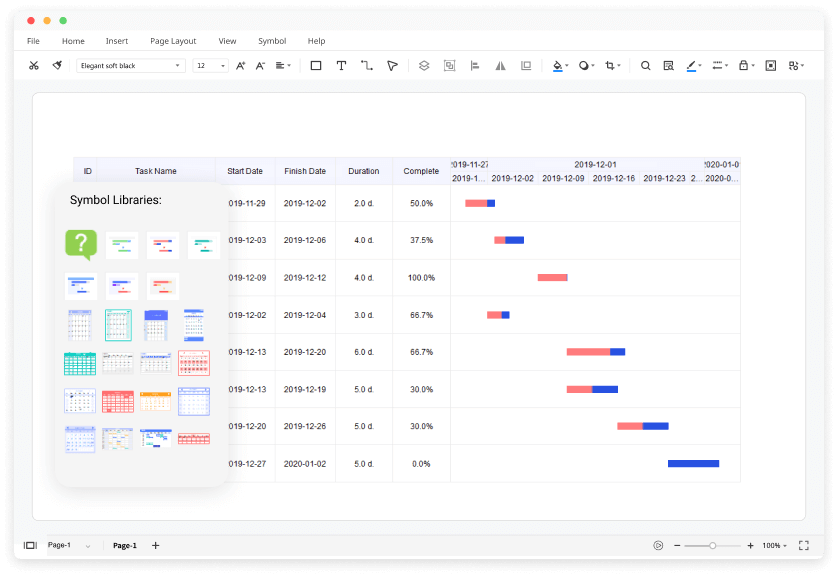
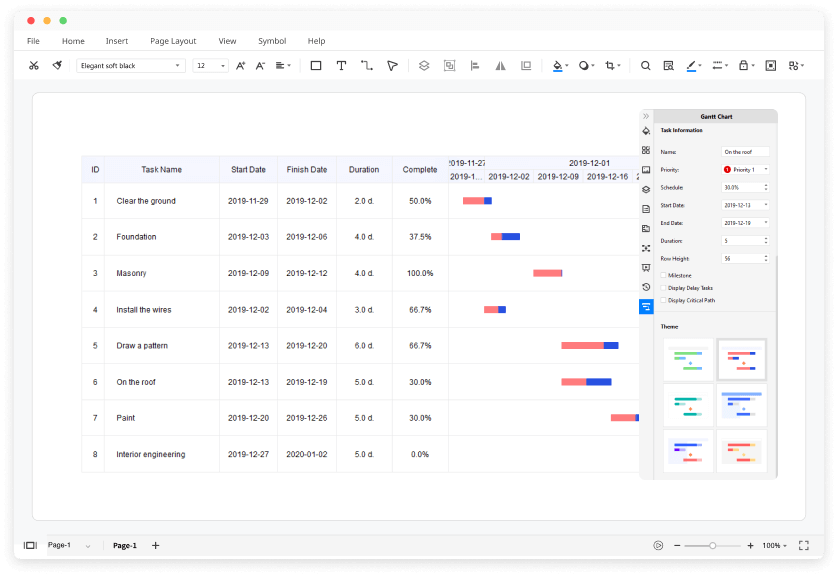
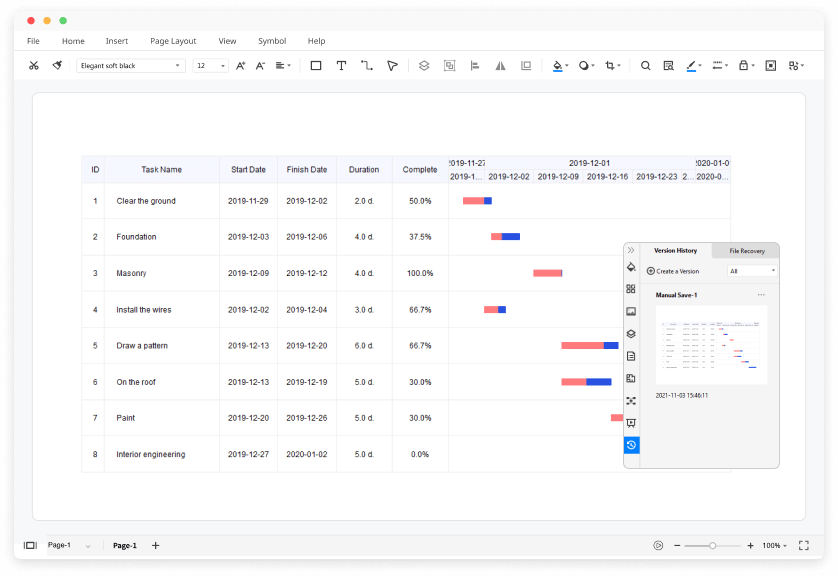
Creating Gantt charts is a breeze
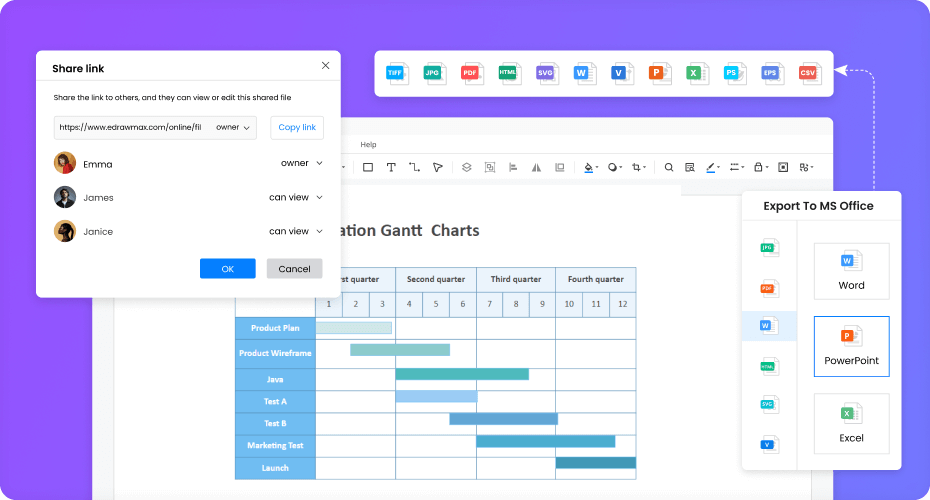
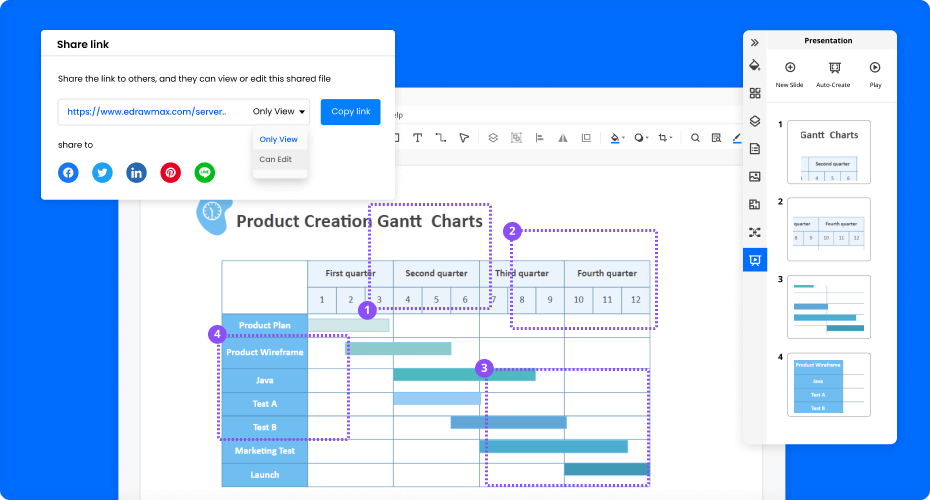
Collaborate and share with team on the fly
Present and analyze
with ease
More Features Of Gantt Chart Maker
Visio files import and export
Customized fonts and shapes
Insert images and attachments
Infinitive canvas
Various color theme
File encryption and file backup
What's New in EdrawMax


How to Make a Gantt Chart?
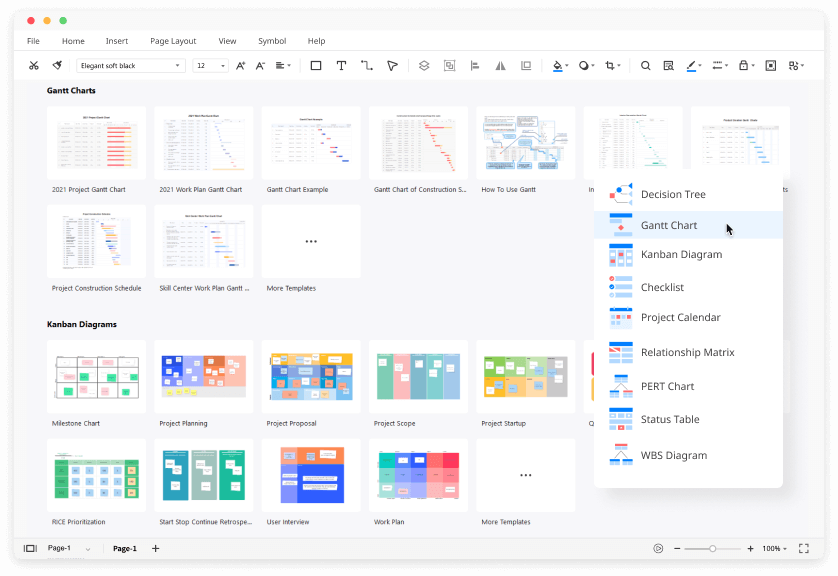
Edraw Gantt Chart Templates
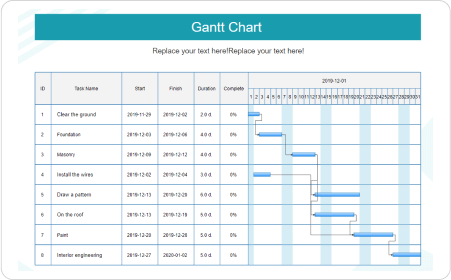
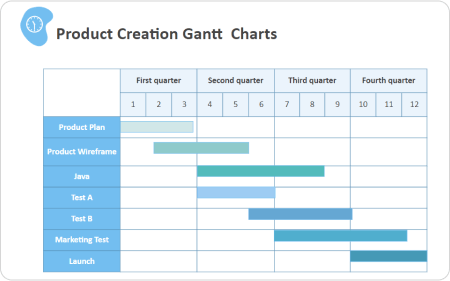
Gantt Chart Template
Gantt Chart template is a useful graphical tool that shows activities or tasks performed against time.
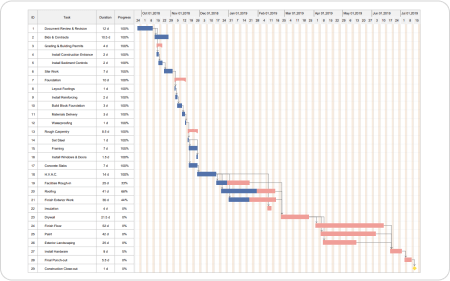
Simple Gantt Chart Template
A simple Gantt chart template is for the visual presentation of a project where the activities are broken down and displayed on a chart.
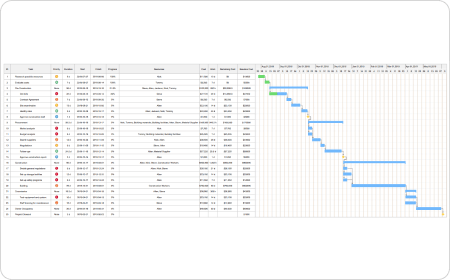
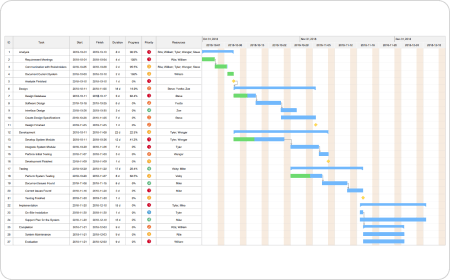
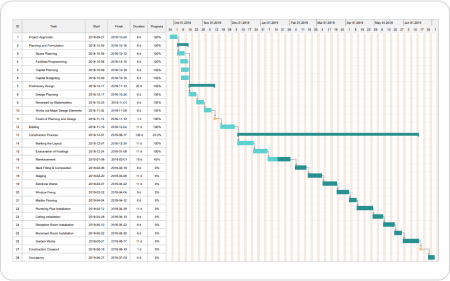
Project Gantt Chart Template
A project Gantt chart template is a project management tool assisting in the planning and scheduling of projects.
Gantt Milestone chart
Gantt chart milestones are checkpoints used to specify important points along with the project schedule when it’s visualized on a Gantt chart.
Agile Gantt Chart
Within the Agile framework, a Gantt chart can show the progress of sprints and which tasks have to be removed from a sprint.
Monthly Gantt Chart Template
The monthly Gantt chart template illustrates the monthly view instantly, with the calendar displaying all the months of the year.
Gantt Chart FAQs

Does EdrawMax have any free Gantt chart templates?
Except for the pre-made Gantt chart templates in EdrawMax, you can download and customize Gantt chart templates from our Template Community. All the community-made Gantt chart templates are free to use for Edrawers.
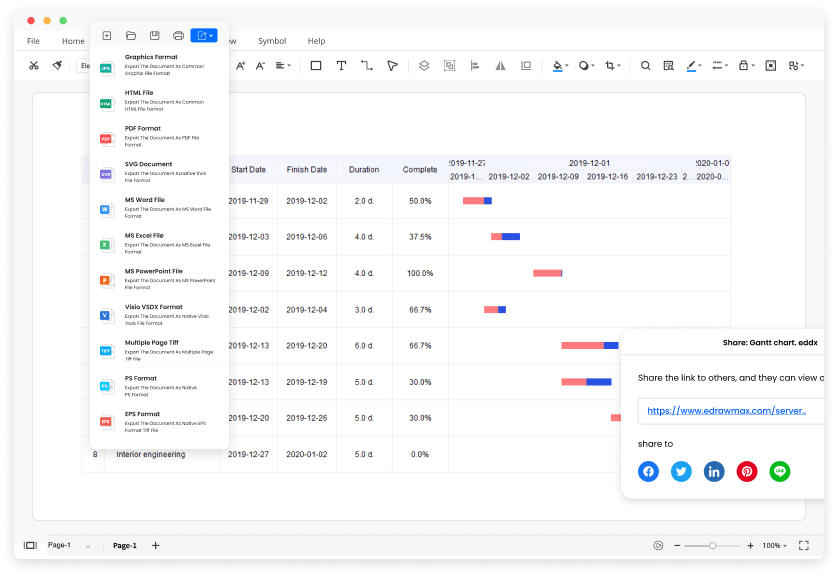
How can I share my Gantt chart with others who don't use EdrawMax?
When your Gantt chart is complete, you can post it on social media, publish on Edraw Template Community, or export the file as Word, Excel, PowerPoint, Visio, PDF, SVG, PNG and JPG. EdrawMax is dedicated to delivering a superior user experience.
Can I export the Gantt chart and save the data?
Yes. After you finish the Gantt chart, you can select to export the data from the project as the XLSX, TXT, and CSV files.
How can I create a Gantt chart from scratch?
You can create a Gantt chart from scratch by dragging and dropping a blank Gantt chart from the libraries. You can also import your data and create a Gantt chart.
Is EdrawMax’s Gantt chart maker free?
YES! It is free to create different Gantt charts in EdrawMax. There are free templates and symbols for making Gantt charts. Just download it and try EdrawMax now. You will love it right now.
More Resources
Unlock your diagram possibilities by exploring more diagram makers here.
Find more ideas, tips and knowledge to help create Gantt charts.
Need help? Find the instruction or contact support here.
