Piping and Instrumentation Diagram (P&ID)
Know it All about P&IDs
While preparing a fully functional industrial unit, several pieces of equipment are aligned and linked with each other. These items also include pieces of machinery like a central plant, compressors, etc. that are connected with the help of pipes. Before any component of this scale is installed, its blueprint is prepared and this chart is called Piping and Instrumentation Diagram or P&ID.
With that being said, the following sections discuss in detail what a P&ID is, what is its purpose and significance, and how to prepare one with the least effort.
In simple words, a P&ID or Piping and Instrumentation Diagram is a visual illustration that shows how the mission-critical pieces of equipment are coupled with the help of pipes to make the complete unit function correctly, and to perform the task it is installed for. It is noteworthy that a Piping and Instrumentation Diagram does not contain every detail of the working unit. For instance, the small valves, jointers, etc. are not included in a P&ID.
The purpose of a Piping and Instrumentation Diagram is to give the engineers a guiding map about how to use the pipes to connect the important components to make the entire unit work. During practical implementation, the engineers can refer to this P&ID to prepare and install the working equipment correctly, thus helping the industry to improve its production.
The benefit of preparing a Piping and Instrumentation Diagram is that it helps in eliminating any chances of errors or miscalculations while installing the equipment. The illustration can be used to perform several dry runs to assess the accuracy of the output that it would generate, and once everything is found acceptable, things are taken to practical grounds.
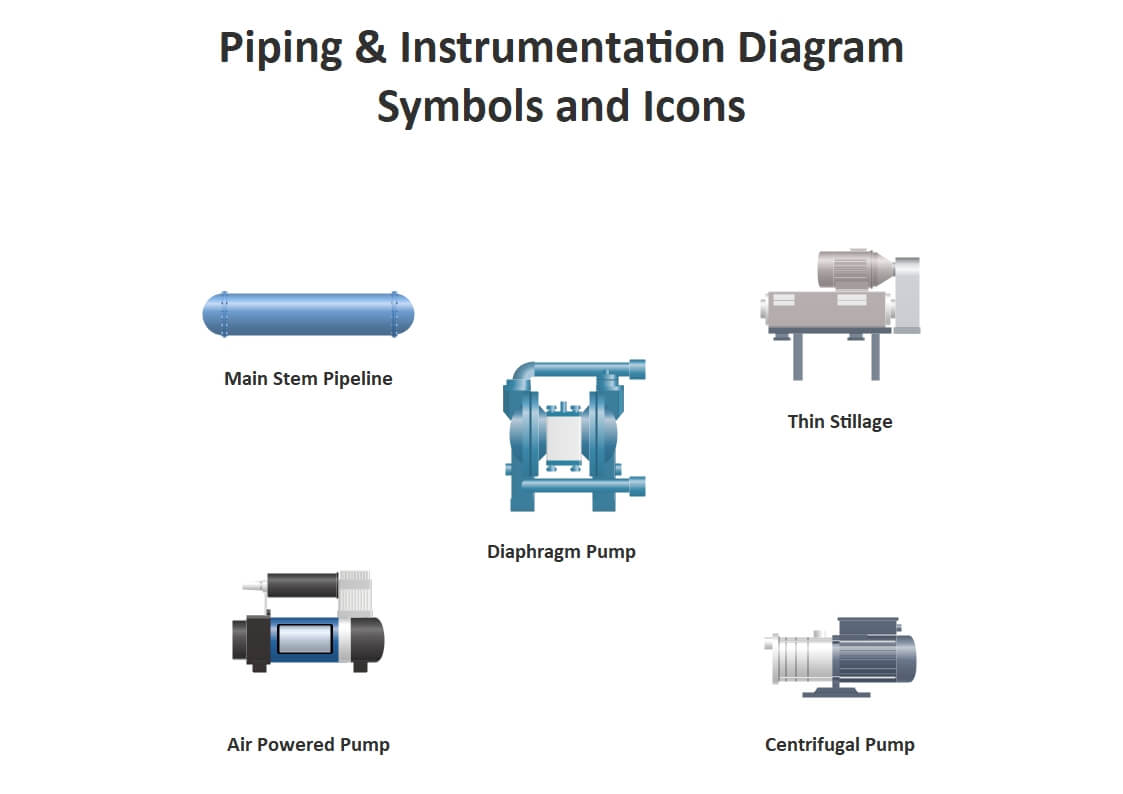
Some of the symbols and icons that are most commonly used while drawing a Piping and Instrumentation Diagram are listed below:
Before you start drawing a Piping and Instrumentation Diagram, you must keep the following few things and points handy and in mind respectively:
Although a P&ID is considered a preliminary object for setting up a piece of industrial equipment, and the entire unit is installed using the illustration as a guideline, the Piping and Instrumentation Diagram itself relies on a Process Flow Diagram or a PFM. A PFM is another graphical illustration that shows how the process (industry-specific unit like air, gas, information, signals, etc.) will flow and in which direction in order to make all the components function correctly and as expected.
You should know what do you expect from a fully functional unit once it is installed. Therefore, creating a Process Flow Diagram becomes imperative.
You must know how much the organization is willing to invest in the setup. With limited funding, you are required to use the minimal number of components of average quality. Such pieces may not last long, and neither would they be able to produce a higher amount of output. On the other hand, if the budget is not an issue, the quality and quantity of the components could be improved to get better production.
Even though a Piping and Instrumentation Diagram can be drawn manually on a large sheet of paper, using an efficient diagramming tool such as EdrawMax by Wondershare would be a good idea. Not only such a program expedites your creation process, but it also gives you access to the correct symbols and icons that anyone from a similar industry could easily recognize. This would be of great advantage when the engineers and designers from various geographical locations of the globe are working together on a common project.
EdrawMax is a product of Wondershare, and is used for preparing almost all kinds of vector-based charts, diagrams, and illustrations. With the built-in categories, the program lets you create industry-specific drawings such as flowcharts, organizational charts, P&ID, and much more. Furthermore, EdrawMax is available for both Windows and Mac computers, and can be downloaded from its official website.
You can learn how to create a Piping and Instrumentation Diagram with Wondershare EdrawMax by following the instructions given below:
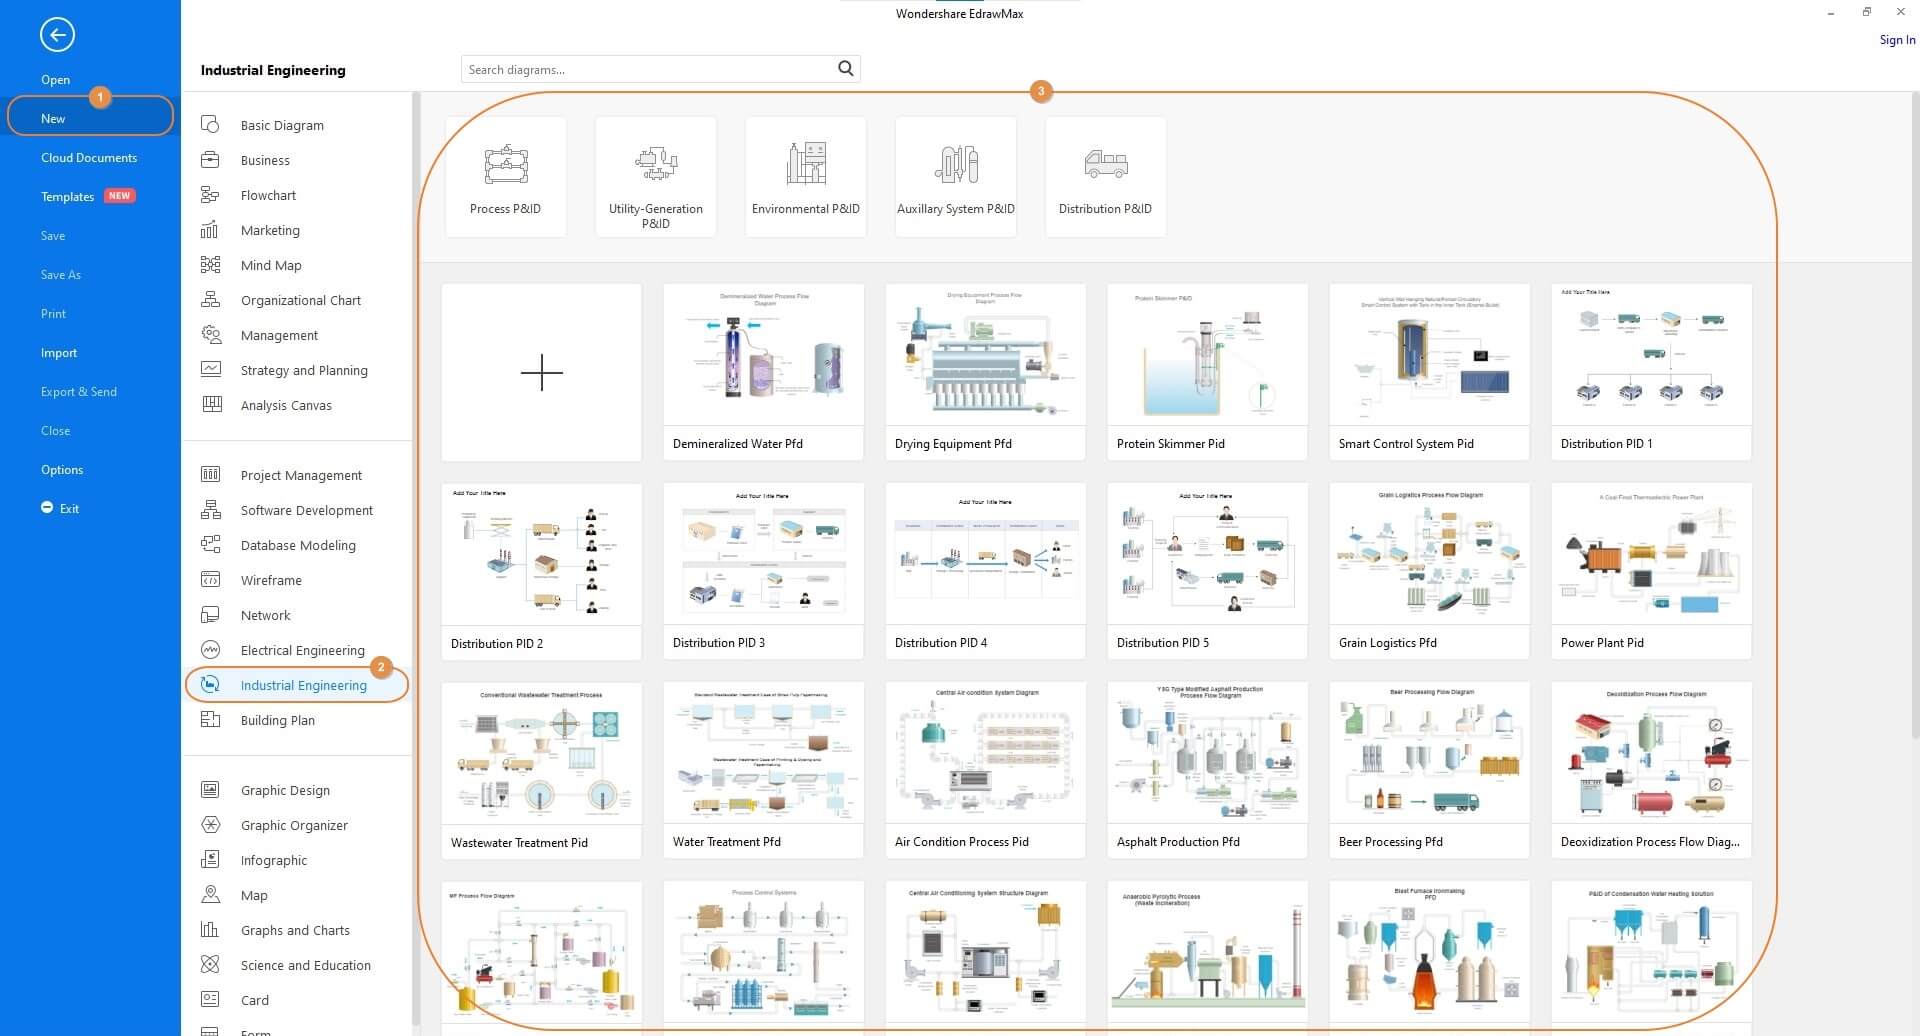
Step 1: Pick a Relevant Template

・ Simple alternative to Visio
・ 26k+ symbols
・ 10K+ free templates
・ 10+ AI diagram generators
After installing EdrawMax on your PC, launch the program, and make sure that New is selected in the navigation pane on the left. From the center pane, click to select Industrial Engineering. From the right window, either select a particular category from the upper section to get the filtered list of templates, or leave them unselected to view all the available options present in the lower section. Next, click a template to start a new project.
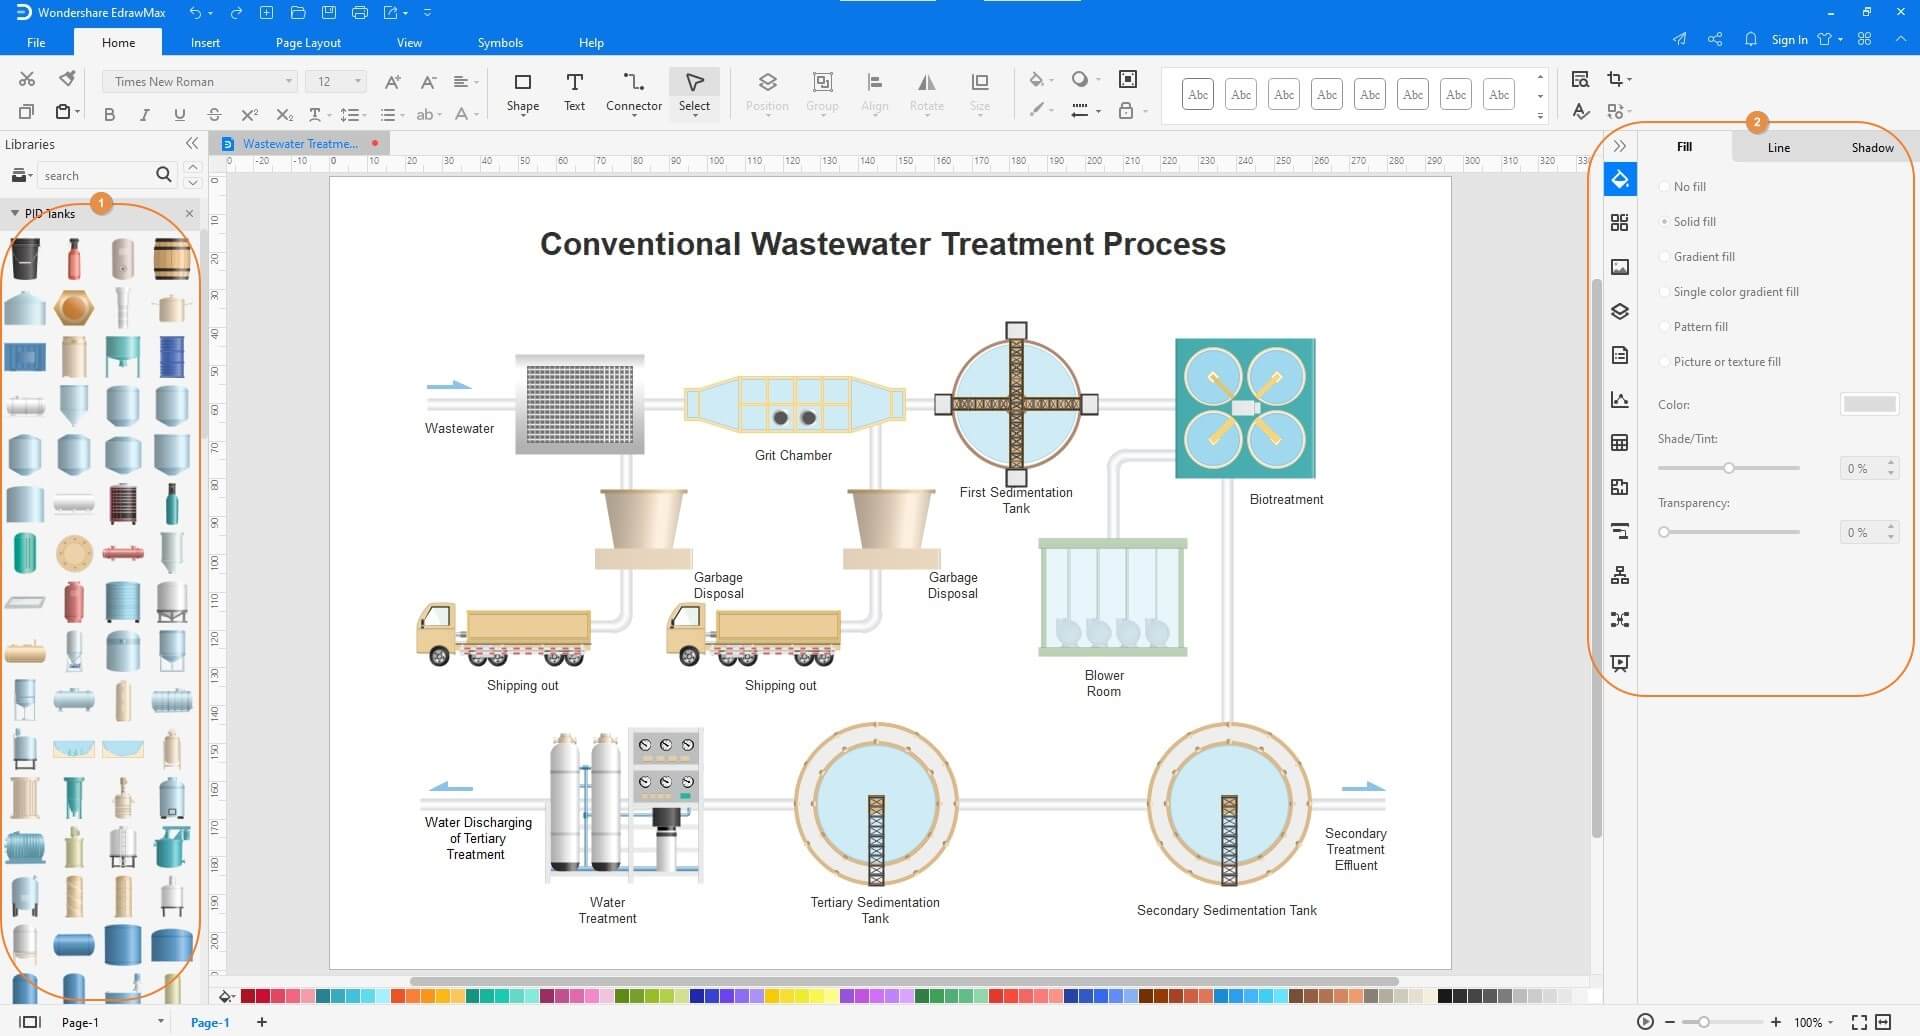
Step 2: Customize the Template
When the selected template opens in the Canvas, double-click any of the available symbols, and add a new name or modify the existing one. Use this process to change other labels and captions as well if needed. Additionally, you can drag more icons from the libraries on the left to the Canvas to customize the illustration. The tools present in the right pane enable you to decorate the symbols for a better appearance.
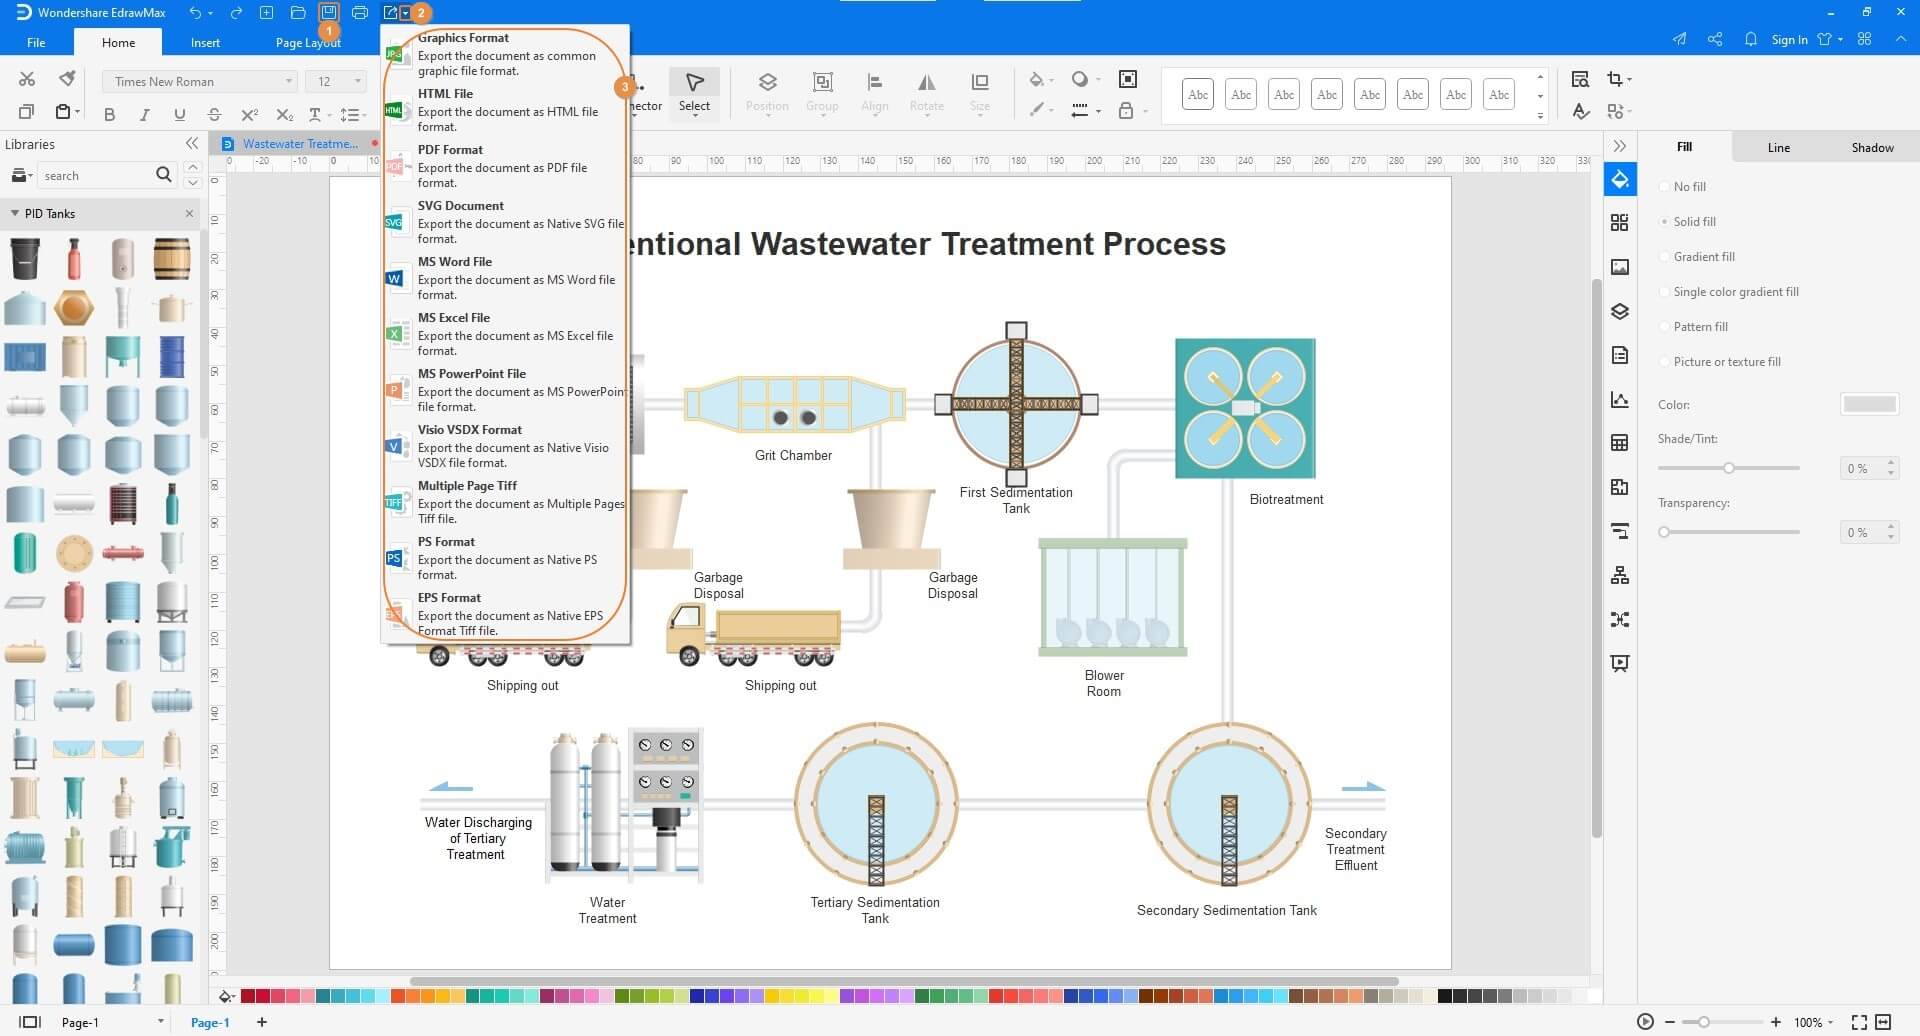
Step 3: Save and Export
Once you have prepared a Piping and Instrumentation Diagram that best suits your needs, click the Save icon from the Quick Access toolbar from the top-left corner of the interface. Next, click the More button on the Export icon, and click your preferred format from the list to export the illustration.
・ Simple alternative to Visio
・ 26k+ symbols
・ 10K+ free templates
・ 10+ AI diagram generators
A couple of important tips that would help you prepare a good and elaborative Piping and Instrumentation Diagram are listed below:
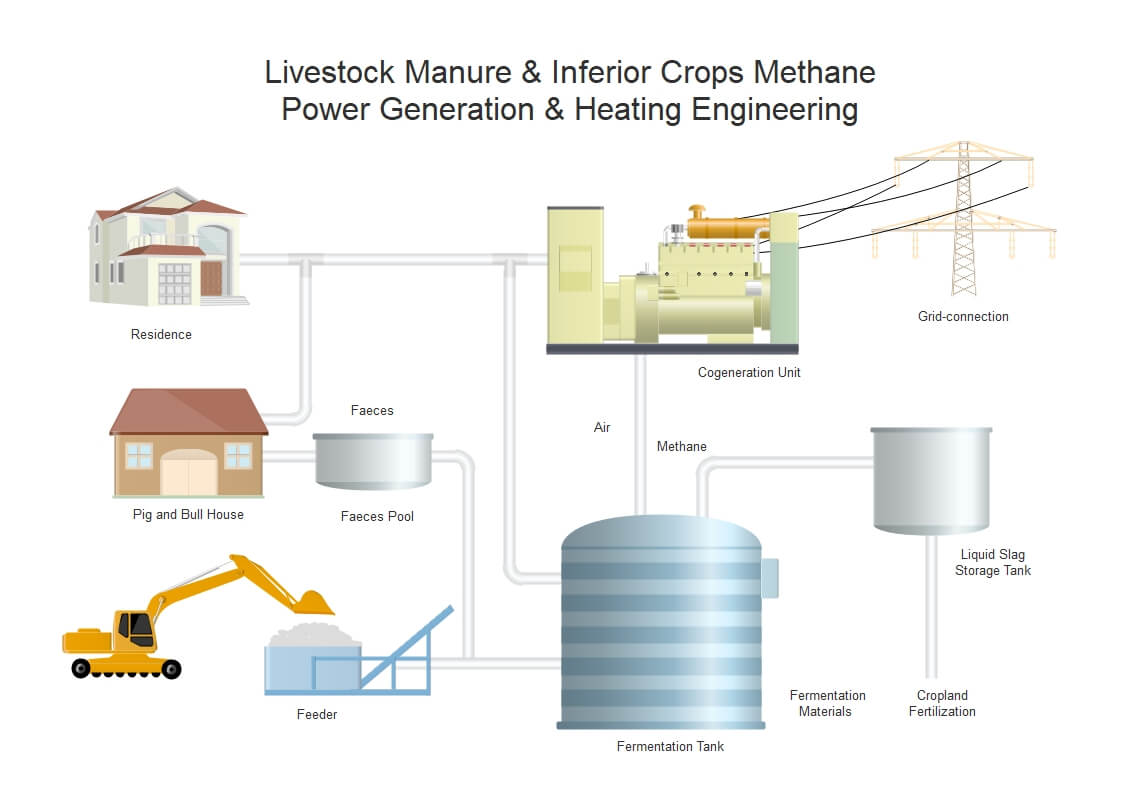
The above image is that of a Piping and Instrumentation Diagram for a power generator that is connected to the electric pole for the main supply. The Cogeneration Unit has several pipes connected to it. These pipes are responsible for moving the air/methane to the residence, pig and bull house, and fermentation tank for further processing and to get the desired outcome.
A clear Piping and Instrumentation Diagram (P&ID) works as a building block for almost all kinds of industrial equipment. However, the chart itself relies on a Process Flow Diagram (PFM) that shows how the payload will flow and in which direction. In addition, it is imperative to understand that although drawing a P&ID is a good option, it is better to use an efficient diagramming tool like Wondershare EdrawMax to get the job done if you want a tidy illustration with correct symbols.


