8Ps Method for Service Problem Analysis
Significance of Service Industry
Service industry is the tertiary industry playing a key role in people's daily life. It contributes greatly to economic growth and is beneficial for improving people's life quality. But this industry also experiences various problems in its development. It is quite necessary to pay attention to these problems and find solutions to solve them. Otherwise, people's well-being will be hindered greatly.
Fishbone Diagrams for Service Problem Analysis
Fishbone diagram can offer a graphical display of the causes of service problem. It helps analyzers to understand the problem comprehensively and logically. It can be combined with brainstorming to facilitate problem solving. Drawing a fishbone has become quite easy now with automatic software like Edraw. Then, you can share with others and print it easily so that you can refer to it anytime anywhere.
8P Method Used in Problem Solving
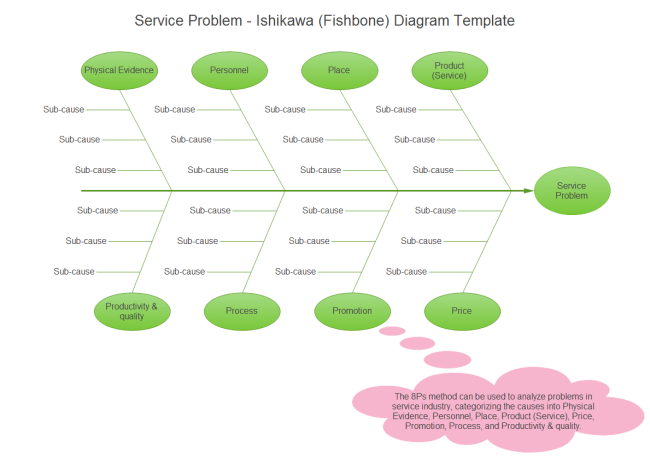
Generally speaking, the causes of a certain problem can be classified into some groups according to their common natures. The service industry typically needs workplace and workforce to produce product (service). Based on this industry's common features, a problem's reasons can be grouped as 8Ps: Physical Evidence, Personnel, Place, Product (Service), Price, Promotion, Process, and Productivity & quality. Here is a general template. The 8Ps will be further explained one by one so that the problem can be understood deeply. Such explanations are primary causes of the diagram.
Bad Tea Probelm Solving Fishbone Example
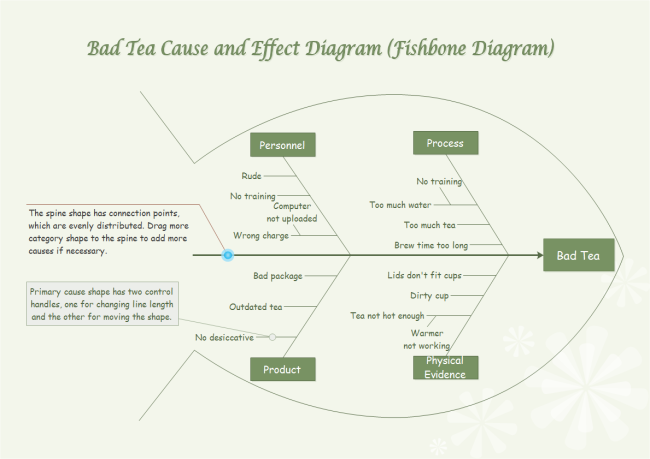
According to different situation, maybe less than 8Ps are concerned. This method's application depends on specific case. For example, the service of bad tea can be often analyzed in terms of personnel, process, product and physical evidence. It can be concluded from the diagram that the several principle below should be followed to offer good tea. The personnel should be trained before taking the post. Charging must be reasonable to gain customer's trust. Materials should be good quality from the perspective of package, storage and quality guarantee period. Objects including clean and elegant cups and suitable warmer are also needed.
Fishbone Diagram Software
Edraw fishbone diagram software provides every user the power to automatically draw fishbone diagrams of various styles, analyzing probelm and finding out solutions faster. It offers many ready-made templates and examples to help users get started as fast as lighting. It has been designed to be intuitive in use with the interface similar with Word and opted even by professionals. After completing th efishbone diagram, 1 click on the export button can trasnfer it into another format, including PDF,docx, pptx, jpg and so on.
Download Fishbone Diagram Software


