Bubble Diagram in Architecture: Guide and Diagram Ideas
Edraw Content Team
Do You Want to Learn More about Bubble Diagram?
EdrawMax specializes in diagramming and visualizing. Learn from this article to know everything about the bubble diagram in architecture!
Whether an architect, engineer, or interior designer, you must have a perfect plan to make your project an absolute success. For example, an architect decides the shape of the property, spaces, views, and size before constructing a building. Knowing if the plan is feasible within the specified time and other constraints is crucial.
In order to have a perfect plan, a bubble diagram jumps in. It helps you manage all prerequisites for a successful project. But here's the real deal: How to draw a bubble diagram architecture plan? Luckily that's the main goal of this article. First, we will summarize how a bubble diagram can be beneficial for architects. Moreover, this write-up will guide you through drawing a bubble diagram with practical ideas.

1. What is an Architecture Bubble Diagram
Before creating any architecture, the designer must have a directional plan. One can efficiently allocate specific regions for distinct parts through that procedural map. Besides that, it is ideal for targeting specific areas and connecting them. For instance, in the case of a bubble diagram interior design, different bubbles mark varying elements, such as furniture and ornaments. So, the designer keeps track of where and how to place the components accordingly.
You may ask why it is ideal for architecture. Here are some of the reasons:
- Imagination is not enough to design architecture, especially a house. Therefore, a bubble diagram for the place visualizes the entire connection with basic shapes.
- As an architect, you cannot help your clients understand the design with mere words. Instead, you need physical images to put your comments in a functional and well-connected picture. For instance, creating a hotel system would be easier if you had an interconnected plan about its different sectors. A perfect hotel bubble diagram highlights all standard design segments the creator has to follow. So, it makes overall management and monitoring a lot easier.
2. How to Draw an Architecture Bubble Diagram
Architectures are always challenging to create, and so are their bubble diagrams. Therefore, most people use a hand-drawn sketch to create bubble diagrams. No matter that this process is traditional, it can still extract pretty functional bubble diagrams.
Draw an architecture bubble diagram by hand
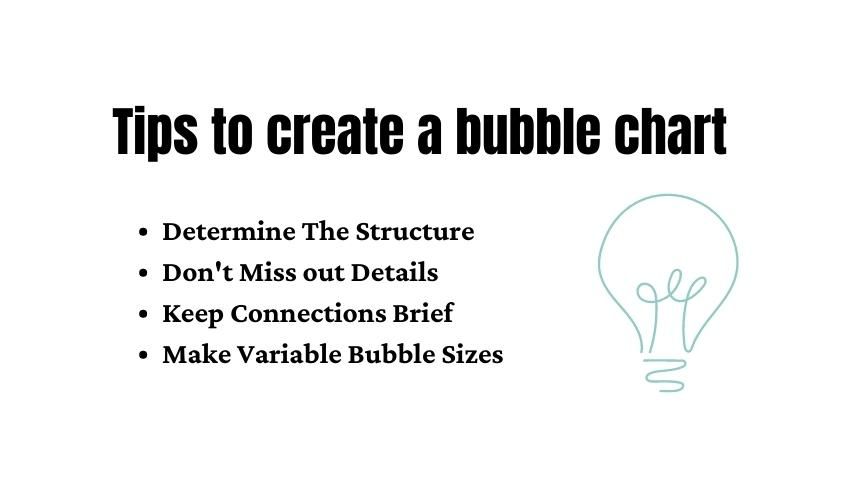
As said earlier, even drawing it by hand can be difficult because of its complex connections. In addition, the massive bubble network can confuse most designers. Therefore, everyone needs some basic tips to create these charts accordingly. Then, you can use some of them to create a bubble diagram for the house.
- Before jumping right into the procedure, create a list of every room in the building. This list will help you develop bubbles in their hierarchical order. As a result, you will not have difficulty organizing the steps.
- Think about the structure before placing the rooms. For instance, the rooms having ventilating windows must be present on the edges. Moreover, use simple shaping lines if you want to leave spaces between the rooms.
- Remember to keep the sizes according to the space. That means if you want a room to take more space, create a bigger bubble for it and vice versa.
- As for the bubble diagram floor plan, focus on the bubble arrangement and space. Again, the reason is its direct impact on space management and organization.
- Always work your way up from the lower floors. That means creating commercial or home bubble charts from the ground floor to the upper portions. It helps you manage the weight and location accordingly. Plus, it helps organize things as per the space flow.
- Unlike floorplans, these do not struggle much with orientation. Yet, the detailing and location can have a severe impact on them. So, try to remain as specific as you can while creating them.
Draw an architecture bubble diagram with EdrawMax
Creating the bubble diagram architecture all by hand is easy indeed. However, it isn't the perfect solution. The reason is its exponential simplicity. The procedure itself is so simple that its product becomes too accessible for the purpose. That means it cannot deliver the extent of information that a bubble diagram for architecture needs. Plus, the connection and management of hand-drawn bubble diagrams aren't clear. You can't share them within the organization, as hand-drawn ones are mostly messy and hard to understand.
So, the best way to create one is by using the software. It helps you create bubble chart architectures neatly and easily. But which software is best for architecture bubble diagrams? Considering relevant tools, a straightforward interface, huge symbol library, experts suggest going for the famous EdrawMax. It is a perfect choice if you want your work to be fast and neat. Some of its features include:
- Easy-to-use interface
- Better toolkit control
- Free editable bubble diagram templates
- Single-click chart creation
As for its design process, the steps are simple. First, you can either download the program or use the online version of EdrawMax. Then click New to create a bubble diagram. Next, drag the bubbles to their locations and add text. Lastly, export it from Save As an option to get your chart. See, it's that simple!
Top Bubble Diagram Ideas for Architecture
If you are a beginner looking for impressive architecture bubble diagrams, your search ends here. We have enlisted the project-winning bubble diagrams to help you with your projects. You may select one of them as your next bubble diagram.
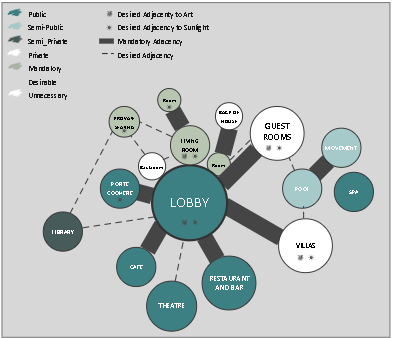
#1 Basic Architecture Bubble Diagram
This chart has the most basic layout. By its physical presentation, you can assess what a typical bubble diagram architecture appears to be. It has the main space oriented around the lobby that has the biggest circle. That depicts how big of a space it occupies. Besides that, the color of the bubble and liking line shape also points out different sectors and objectives.
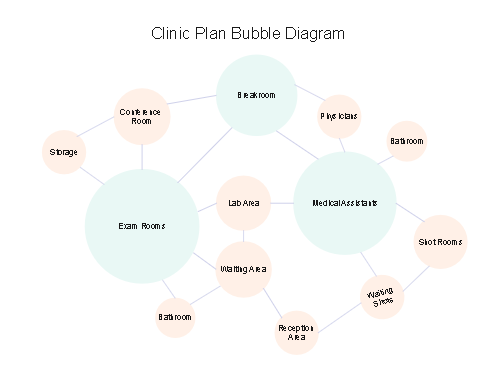
#2 Clinic Plan Bubble Diagram
The clinic plan bubble diagram sounds complex but is easy to understand if you know how to assess it. For example, in the above diagram, the sizes of bubbles indicate the need for space for rooms or other areas. Moreover, different color schemes help connect similar segments throughout the chart.
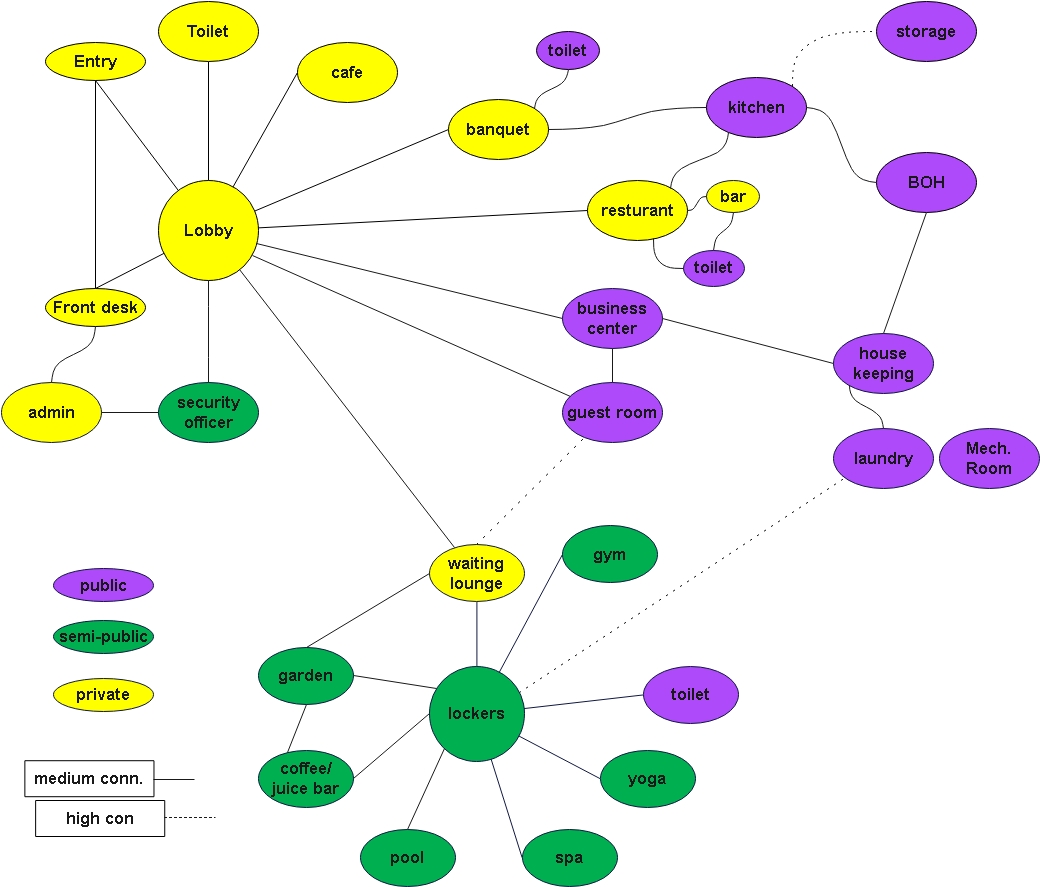
#3 Hotel Bubble Diagram
With a single glance at the chart, you can judge that it includes a massive network of rooms or elements. The chart involves a variety of circles, each with a specific color, text, and size. All three things are details for varying components. The color scheme shows the exposure of the place. That means it can help people assess whether they are authorized to go there. Moving along, the size of the circle shows how big space that component occupies. Lastly, the text shows what the actual architecture is about. Moreover, there are separate linking lines showing how intense the connection between rooms of sectors is.
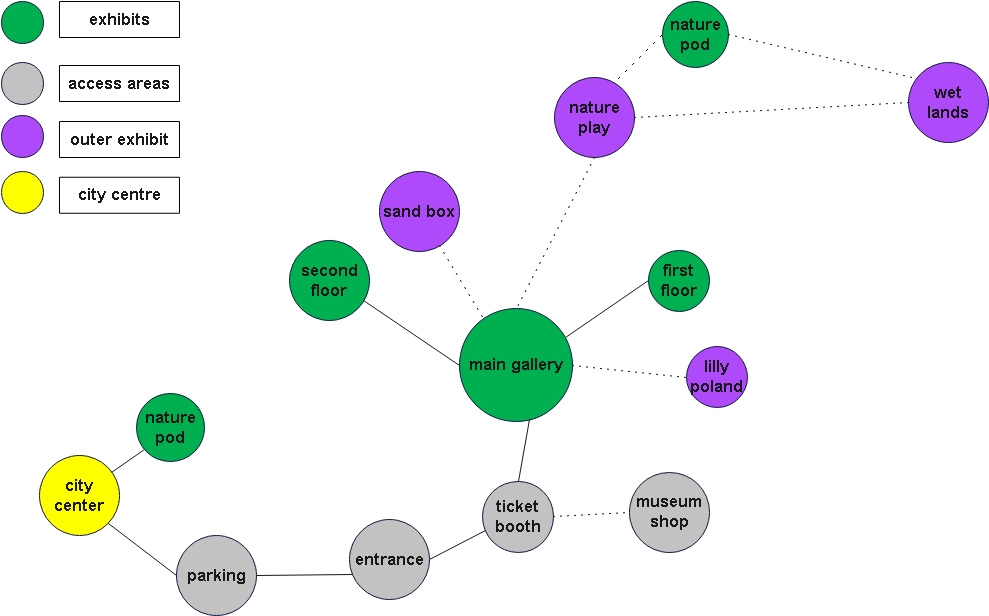
#4 Museum Bubble Diagram
The above museum chart is one of the most straightforward yet most detailed bubble diagram architecture. The primary color scheme makes it simple. Meanwhile, its functional shapes make it more precise. The entire structure revolves around the main gallery that occupies the most space. So, it has been listed in the chart with the biggest circle. Besides that, the diagram ideally describes the connection direction and intensity between the two segments. All possible with the lines. Moreover, a simple straight line depicts a strong connection. In comparison, the dotted line shows that the areas may or may not connect with each other.
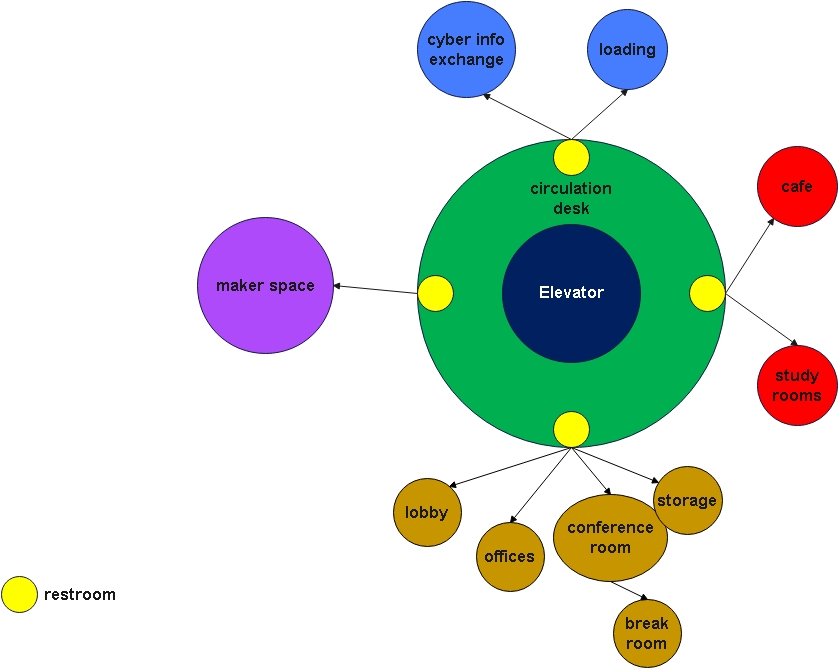
#5 Library Bubble Diagram
The interface of this chart is easy to understand, with an elevator as the main entering source. It is most probably the architecture chart of a library above the ground floor. The chart has different colored circles, each assigned to a specific segment. Some of these involve singular subjective circles that take up the entire space of a sector. On the other hand, some involve multiple structural elements, characterized by multiple sized circles. Also, the chart has arrow-like linking lines that help connect all these shapes and the circulation desk.
4. Wrapping Up
The bubble diagram architecture charts are the best way to organize and manage the space for a structure. These help you create a well-connected plan of creation for your architecture and the production process. Plus, it enables you to manage and keep track of the project and its status. The bubble diagrams are your first impression of your architectural plan. So, ensure you have an appealing one to present to your organization, client, or other architects. Remember, the first impression is the last.
You May Also Like
Getting Things Done (GTD) Flowchart
Knowledge
Cycle Diagram Complete Guide
Knowledge
How a Bill Becomes a Law Flowchart
Knowledge


