Column Chart Types and Application
Posted by
James Freeman
|
Different column chart uses for different purposes. Here shows the basic column chart types and their application.
What is Column Chart
A column chart, also known as a bar chart, is a chart with rectangular bars of columns usually proportional to the magnitudes or frequencies of what they represent. The bars can be horizontally or vertically oriented.
Column charts are useful for showing data changes over a period of time or for demonstrating comparisons among different items. In column charts, categories are typically organized along the horizontal axis and values along the vertical axis.
Column Chart Types and Application
| Type | Icon | When to Use |
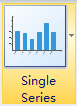
| Single Series Column |
|
You want to highlight values for easy comparison and plot your numbers vertically. Use a column chart to place less emphasis on time and focus on comparing values. |
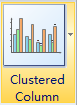
| Clustered Column |
|
Used to compare values between different categories and between different series among the same category. |
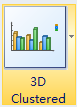
| 3D clustered column |
|
Similar with clustered column, but in three dimensional form, which is vivid and nice-looking. |
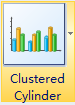
| Clustered Cylinder |
|
Similar with clustered column with data shown in cylindrical form. |
| Stacked Column |
|
Also called stacked vertical bar charts and applied when part-to-whole comparison is needed. |
| 3D Stacked Column |
|
Similar with stacked column with data shown in 3D rectangle shapes. |
| 100% Stacked Column |
|
Similar with stacked column, applied when users need part-to-whole comparison in percentage. |
Chart Data Options
| Option | Description |
| Label | This is the category label for the X axis. |
| Series | Typically a numeric value such as $. An item that you want to measure on your Chart. |
| Category | Different items forming the components of the chart. Typically displayed side by side vertically. |
Video Tutorial - How to Create a Column Chart
The best chart maker - Edraw: Try it FREE.
As an automatic diagramming tool, Edraw has included many powerful features as follows:- Seamless integration with MS Office application;
- 1-click manipulation;
- Floating action button to set the chart options;
- Yellow diamond handles on bottom to change the interval;
- Quick access to fonts, colors, fills, line styles & number formats;
- Stacked, clustered column, 100% column and 3D stacked column;
-
Auto-layout labels for segments, series & categories.
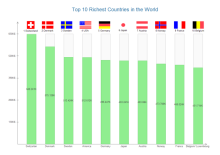
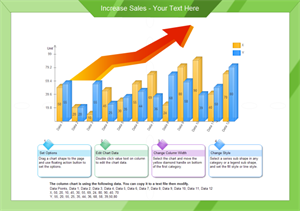
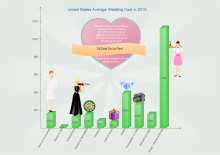
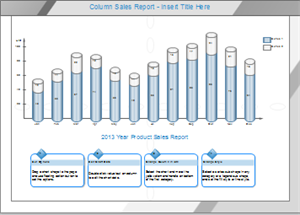
Column Chart Application Examples
|
|
|
|


