KWL Chart – Effective Teacher Toolkit (with examples)

The Meaning of KWL
A KWL Chart or KWL table is a specially designed graphical organizer that helps in the learning process. It is a simple educational tool that stimulates the students to learn effectively and, at the same time, assist the teachers in making their lectures more engaging. KWL is an acronym for what the students already 'Know,' what they 'Want' to know or learn about the particular topic and what they have finally 'Learned' after the teaching lesson.
Benefits of KWL Charts
KWL Charts are beneficial for students as well as teachers in the learning techniques. The process starts with brainstorming the students with their prior knowledge, followed by developing curiosity about the topic in detail. KWL is a self-motivating guide as it lets the scholars move from already known to finally known. It also helps them explore the topic through various means.
KWL charts even enable the teachers to cater to every individual according to their specific needs. The charts also keep the trainers and the learning on the same page, thus engaging the students without letting let them deviate from the topic.
Although there are numerous merits in using KWL, the following few are noteworthy:
- Simplicity
- Bridging the gap
- Interesting presentation
- Effective checks
- Ease of learning
Simple to use, even for beginners, i.e., using a KWL Chart does not require any training. These charts can be successfully organized in any department with simple setups and can be easily understood by every without any complexities.
Helpful in analyzing the gap between the previously acquired knowledge and the final understanding. The learners, thereby, become aware of the final destination where they want to reach.
Engage the students in an effective and interesting learning process. KWL charts present the tabular form of learning or the hierarchy where the scholars proceed from the less known to more known or ignorant to intelligence.
Scholars begin with the "K" portion that helps them relate to their prior knowledge, thereby creating enthusiasm for attaining correct and further knowledge. KWL Charts help the scholars keep a check on their learning progress and differentiate it from 'L,' i.e., 'what was known' and 'what must be known.'
KWL Charts can be used for any subject, any topic, or any specific kind of knowledge. These charts are also a simple tool for learners to gain in-depth information on any subject matter. Hence, they are user-friendly.
KWL charts are different from traditional teaching methods and learning where the teachers and students engage in more constructive and modern techniques of enhancing knowledge. KWL charts help the students keep a check at their pace of gaining knowledge and try their hand in innovating novel techniques of learning according to their capabilities. These charts also assist the students to enhance their comprehensive skills while recalling their previously owned knowledge. KWL charts are topic-friendly and people-friendly, i.e. this methodology can help any category of users on any topic or lesson.
How to Use a KWL Chart
A KWL is a tri-columnar table where ‘K’ stands for what the students already know, ‘W’ stands for what they want to know and ‘L’ stands for what they have learned.
K: What one knows
W: What one wants to know
L: What one has learned (After completion of teaching)
Preparations
Teachers and students are always expected to come prepared for the class, be it a traditional method, or modern techniques. In the "K" column, the teachers are responsible for putting up the questions before the students. It helps the scholars recall their previously gained knowledge on the topic. The teachers ask the students what made them come up with that answer, or what other answers they can think of. The questions like "why according to you are that the answer?" or "can you suggest any other answer?" help the pupils analyze the query more profoundly and with a broad mind. It is done to create an interest in understanding them.
In the last column, "L" students discuss their recently gained knowledge. They discuss the new ideas they have developed, and finally, the analysis of the inflow.
Column 1: What you know
You can have KWL charts for both individuals and group learning. Teachers may break the entire class into several groups and assign separate topics to each team. Every group can then share their discoveries with others. The first column is related to the already gained knowledge either by a group or an individual. In this way, the teachers can understand learners' prior knowledge, be it correct or diversionary, which assists the trainers to upgrade or correct the knowledge of the learners. The educators can also prepare a plan to remove the students' misconceptions if they have any.
Column 2: What you want to know
In this column, the teachers come across the various aspects where they can analyze what the learners want to learn. In this phase, the teachers can further divide a group into several smaller groups of equal minded pupils so that each one can gain from the learning of all the other clusters.
Column 3: What you have learned
Here the learners can compare 'what they wanted to learn' and 'what they have 'learned. They can mark what they noted in column 2 and if their queries are answered satisfactorily. They can also share what they found catchy, interesting, or even any misconception they had, as told in column 1.
KWL Charts can be filled as per the users' needs, i.e., some teachers require the students to fill all the three columns in the first go, whereas the others let the students fill the chart as they progress through the learning process.
KWL Chart Examples
KWL Charts can be filled as per the users’ needs, i.e. some teachers require the students to fill all the three columns in the first go whereas the others let the students fill the chart as they progress through the learning process.
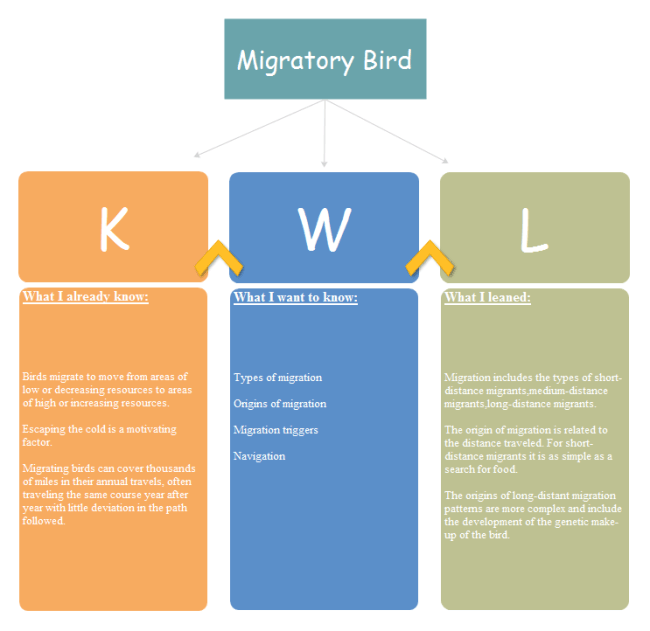
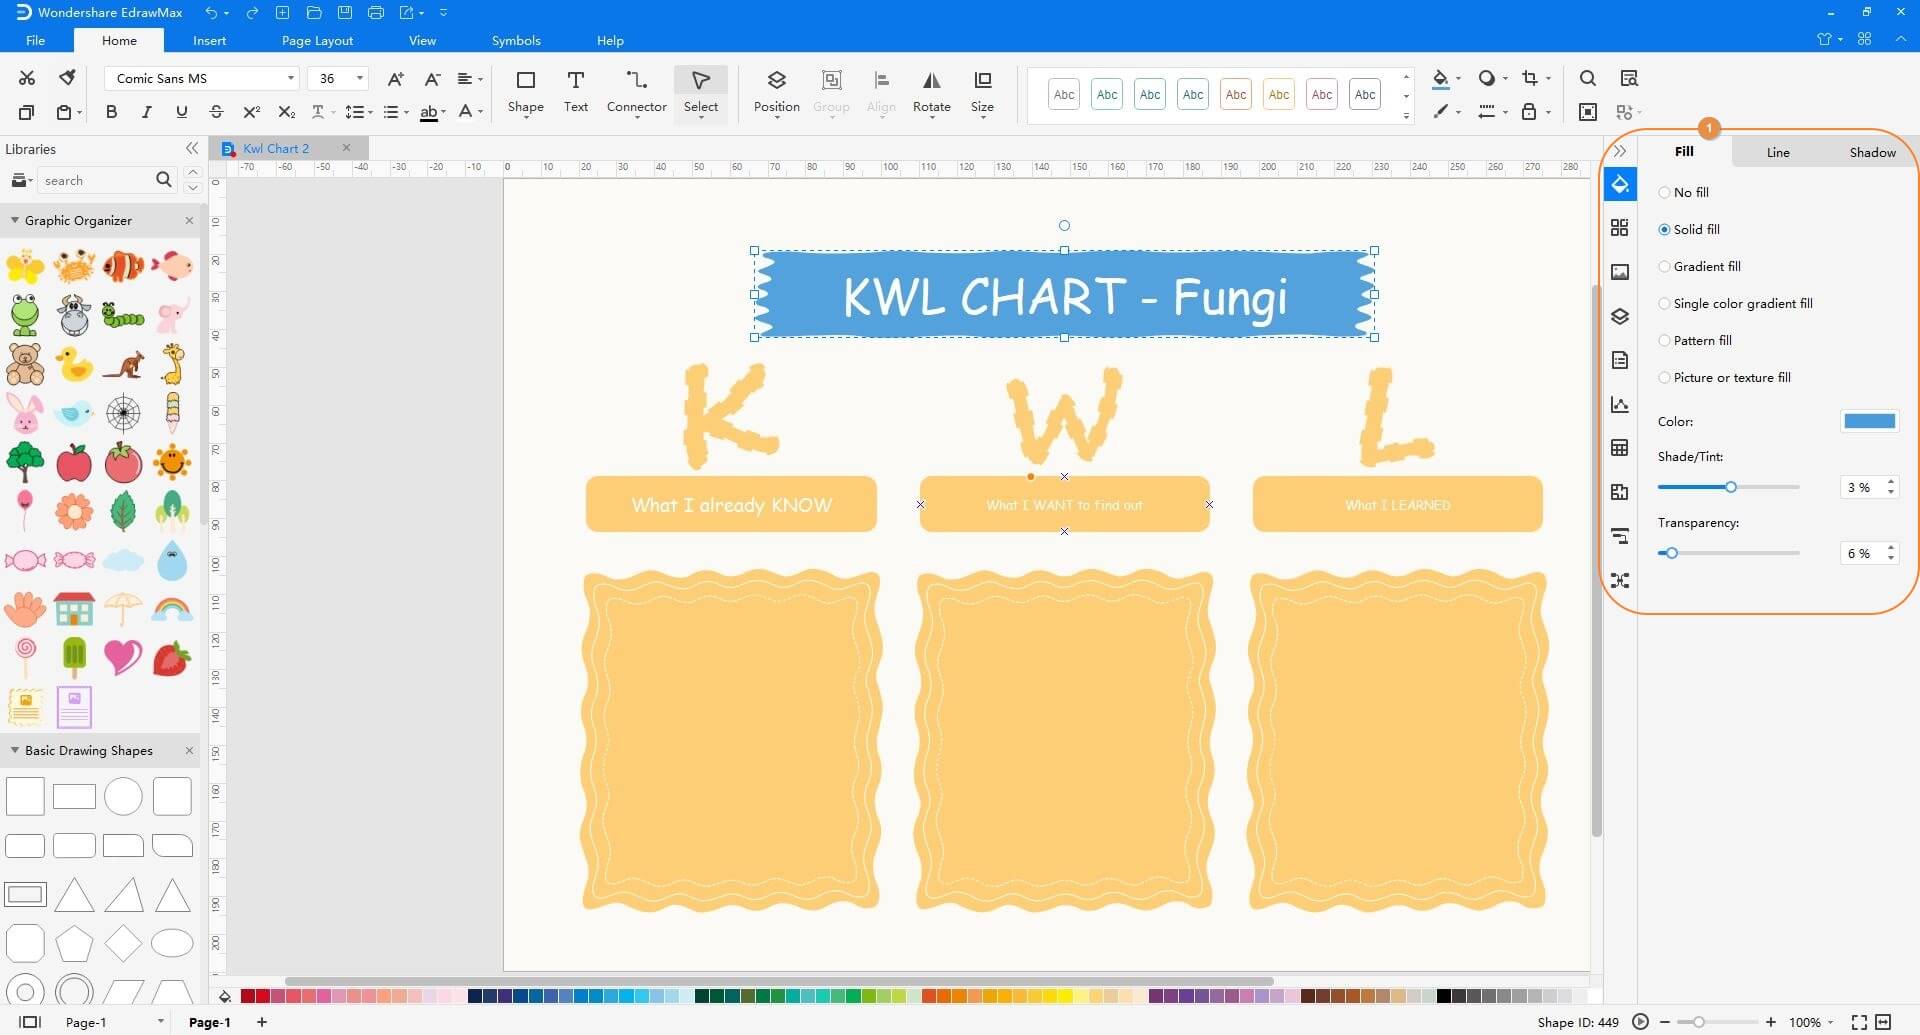
Example 1: Fungi
| K: What I Know | W: What I Want to Know | L: What I Have Learned |
|---|---|---|
| Some fungi are edible while some are poisonous. | Other examples of fungi. | Yeasts, athlete's foot are other examples. |
| They like moisture laden environment. | Artificial measures to grow fungi at other places. | They can live in any environment, but preferably they want a warm and moist environment. |
| Only mushrooms in the general example. | Are they beneficial for health? | Many antibiotic drugs can be made from fungi. |
Example 2: Training
K: What one knows
- PowerPoint presentation is the best method for teaching foreign languages.
- PPT is mostly used by inexperienced teachers.
W: What one wants to know
- Correct tools so as to practice the language to be learned.
- Taking proper advantage of different opportunities available.
L: What one has learned (After completion of teaching)
- Learners learn better through experience.
- Teachers must simplify the lessons and must make the topics compatible with students.
Example 3: Dolphins
|
K Dolphins live in oceans. They are famous for showing beautiful tricks. |
W What do dolphins eat? How many babies can dolphins have at a time? |
L Dolphins are mammals, not fish. Dolphins eat fish, crustaceans, etc. and give birth to one baby at a time. |
S- Still want to know
This is the phase where the students can note down the queries if they want some additional information or solution. Simply put, all the unanswered questions here.
How to Make a KWL Chart
Among all the tools available to help you create a KWL chart, EdrawMax is the simplest one. Not only this, but the software is also beneficial for professionals who want to draw flowcharts or diagrams for various other organizational structures like networking, electrical, engineering, etc.
The following instructions explain how to make a KWL chart in EdraMax:
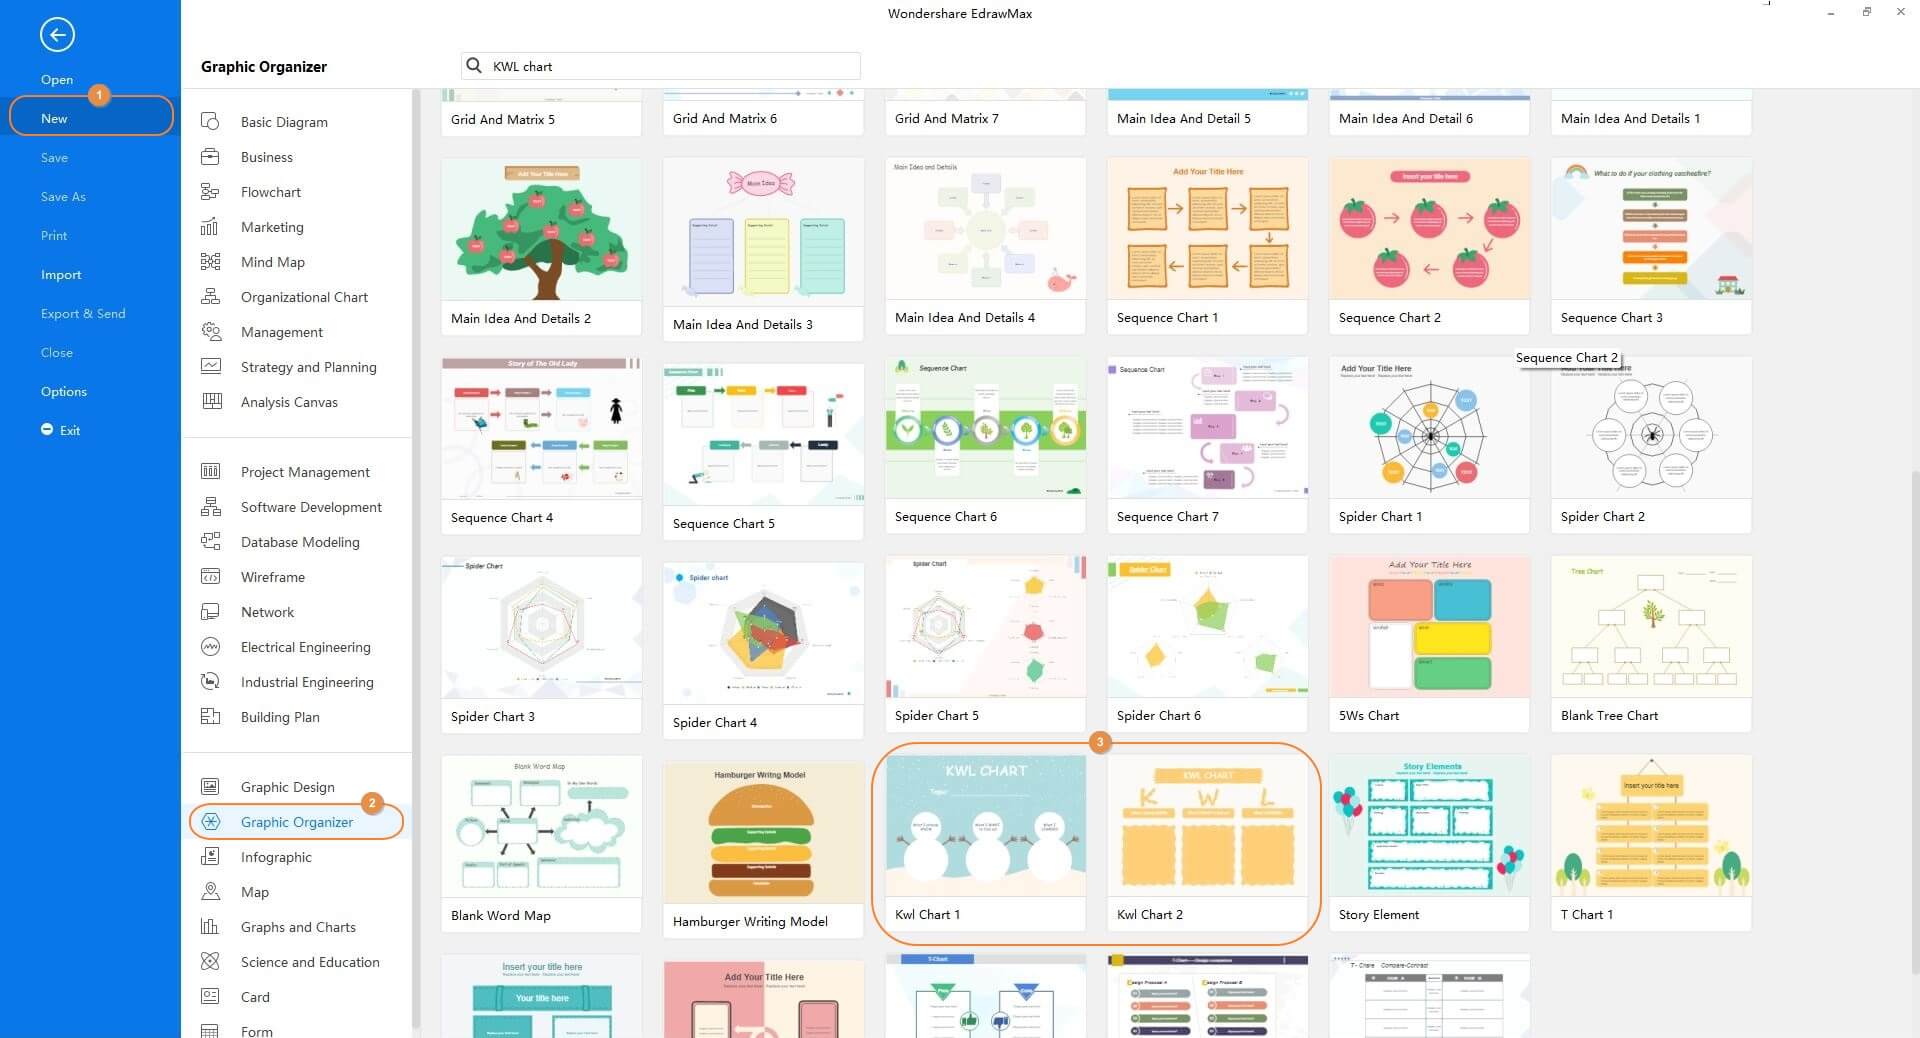
Step 1: Pick a Template
Launch EdrawMax on your computer, ensure that the New category is selected in the left pane, select Graphic Organizer from the center pane, and click the KWL Chart 1 or KWL Chart 2 template from the right window.
Step 2: Add Information
Double-click an editable field, and enter an appropriate value. Repeat the process for all the fields to populate the entire KWL chart with the relevant information.
Step 3: Make Cosmetic Adjustments
Use the options in the right pane to change the color, shading, transparency, etc. to make the KWL chart look more appealing.
Step 4: Save the Changes
Click the Save (Floppy Disc) icon from the top to save the KWL chart to your preferred location.

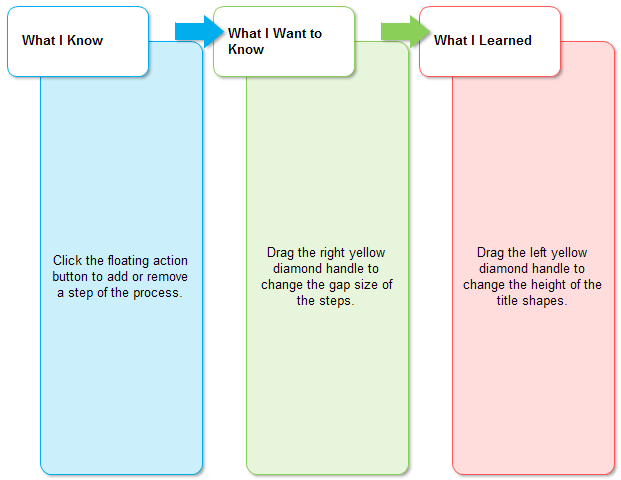
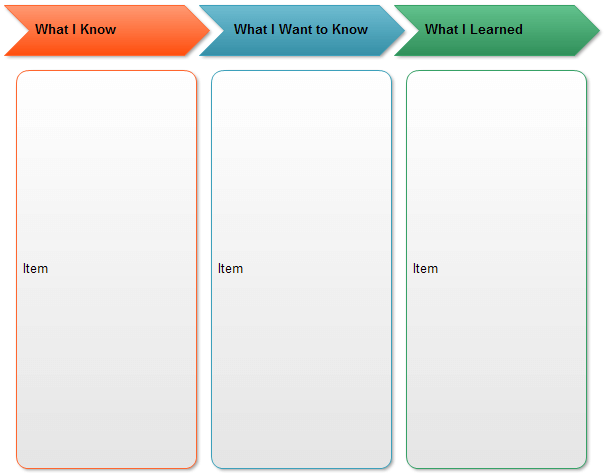
More KWL Chart Templates
Here are some of the blank KWL chart templates that you can use in your study.