Differences Between DFD and ERD
DFD and ERD models both show data presentations for identifying data flows. Organizations use such models to effectively communicate within different divisions. This article will explain the differences between DFD and ERD with examples, but first, let us check out the basic definitions of these two models.
Part 1: What are DFD and ERD?
Basic Concepts of DFDs
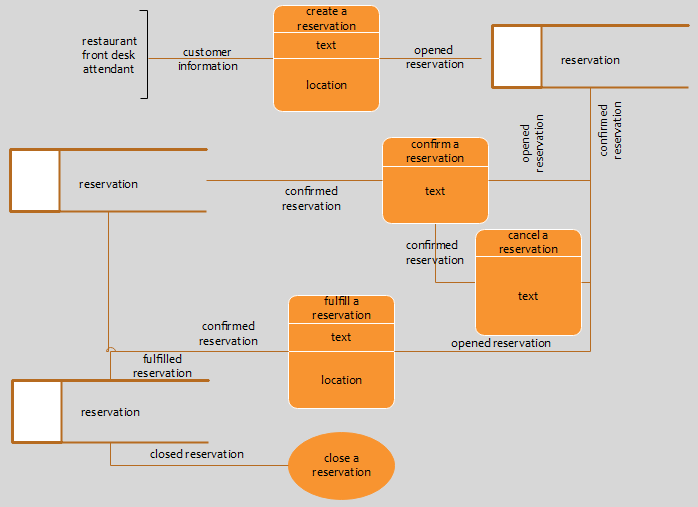
DFD represents the Data Flow Diagram, which shows the flow of a series of data based on a certain information system model. DFD is generally used for outlining the pattern and framework of a data system without showing processing time options in sequence, for example, the Yes or No choices in typical flowcharts. In reality, DFD can be used for information management or data visualization. Here you can see an example of the DFD, which shows the overall data flow for making a reservation in a restaurant.
Basic Concepts of ERDs
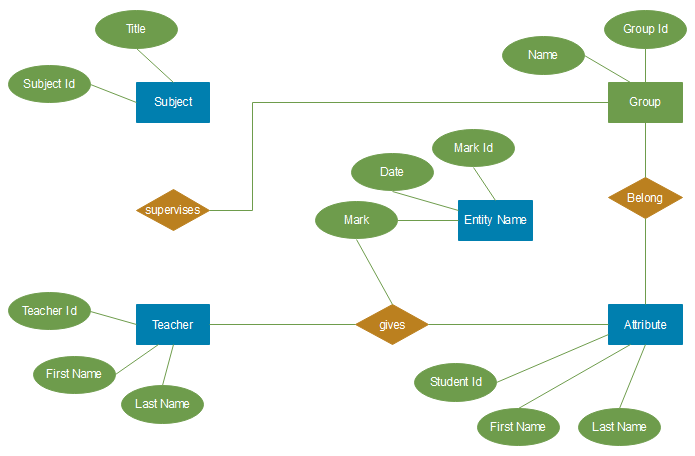
ERD means the Entity-relationship Diagram, reflecting the key relationships between different entities in an information system: members, roles, items, products, locations, concepts, and more. The most common practical uses of ERD include relational databases in software engineering, academic institutions, etc. Below is a good example of the ERD for school information management. In this case, a single entity unit can be a teacher or student. Additionally, all the personal details of teachers and students are in green.
Part 2: Key Differences between DFD and ERD
Difference in Methodology
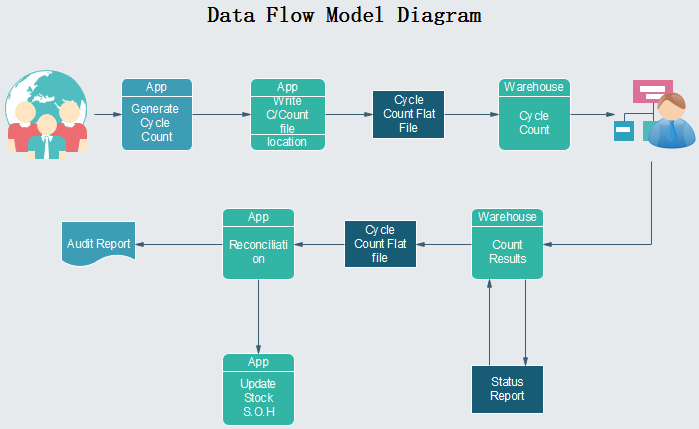
DFD usually reflects the way of entering, transforming and storing data. Furthermore, units in DFD are usually processed individually based on some certain aspects, where each of them could be linked interactively. The DFD example here shows a typical process for the logistics manager to check and update stock for each product via the App system.
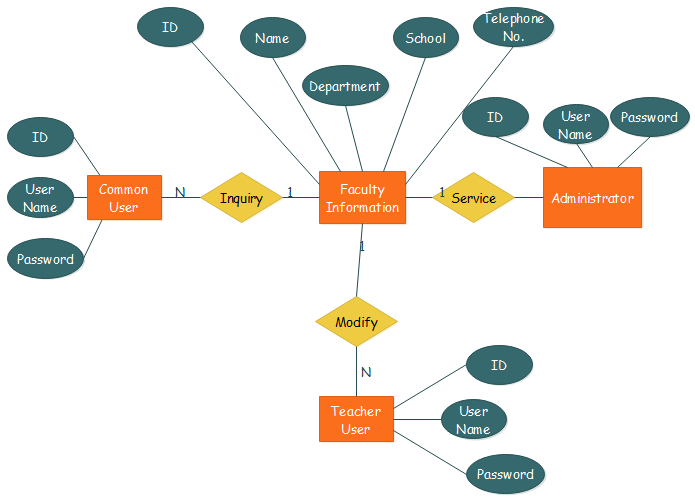
In contrast, ERD shows the overall framework of the data system without explaining much about the database's implementations. Entities in an ERD often represents a group of similar things. In this case, theoretically, ERD models show how the data units are grouped into entities logically. For example, a data unit could be a single blog article, and a relationship could be the blog and its writer, etc. Besides, on the physical aspect, EDR reflects how data elements are stored in a database technically. The ERD below offers you another example of academic staff information management.
Difference in Presentation
Both of these two diagram models have defined symbols in various shapes and connectors. However, DFD models show a multi-level structure with a series of separate parts that include detailed information. In ERD models, you can clearly see boxes and diamonds are presented in a kind of concept map structure to show the relationships between entities.
For real-time applications, both DFD and ERD models have drawbacks. As a result, despite the popularity of these two data flow models, neither of them can fully represent the whole picture for a single project. Therefore, organizational leaders or department managers should analyze their data sets with a combination of more types of data flow models and diagrams. Furthermore, you can try some DFD and ERD diagram design software for your projects.
Part 3: ER Diagram Examples
Here are some entity relationship diagram examples. You can download the template for free. Double click the shapes to replace content. To change the style, try to use Themes function to modify the font, color, and outline at once.
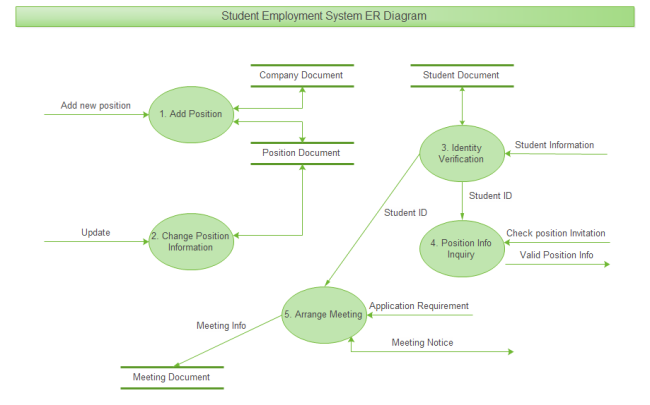
Employment System ER Diagram
Click the employment system entity relationship diagram thumbnail to download the original file.
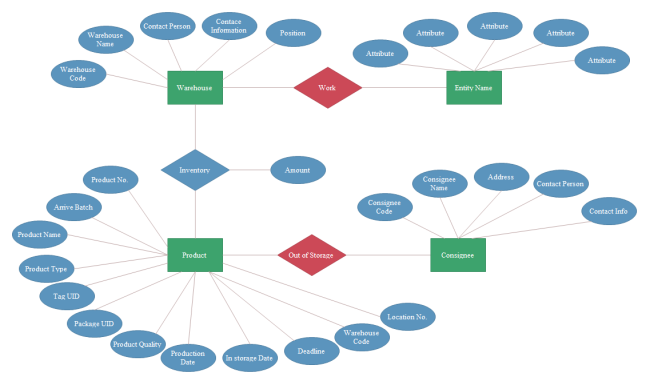
Storage System ER Diagram
The storage system ER diagram uses entity, relationship and attribute symbols to describe how entities relate to one another in the system.
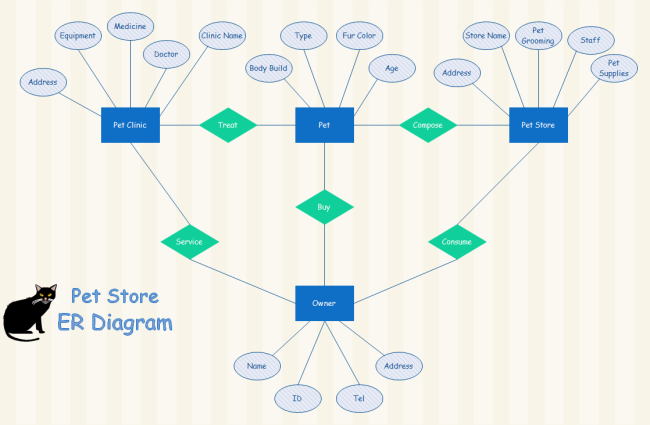
Pet Store ER Diagram
This ER diagram graphically illustrates the pet store system’s entities and the relationships between those entities.
Part 4: DFDs Examples
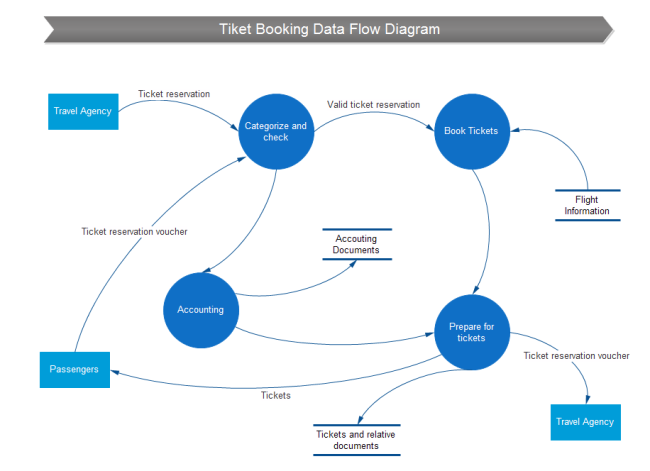
Ticket Booking Data Flow
Customers Data Flow

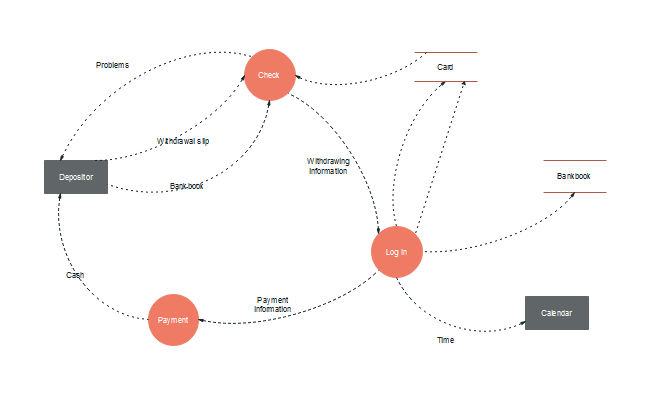
Withdrawal Process Data Flow
Read More:


