PDCA Methodology in Six Sigma
Six Sigma and PDCA
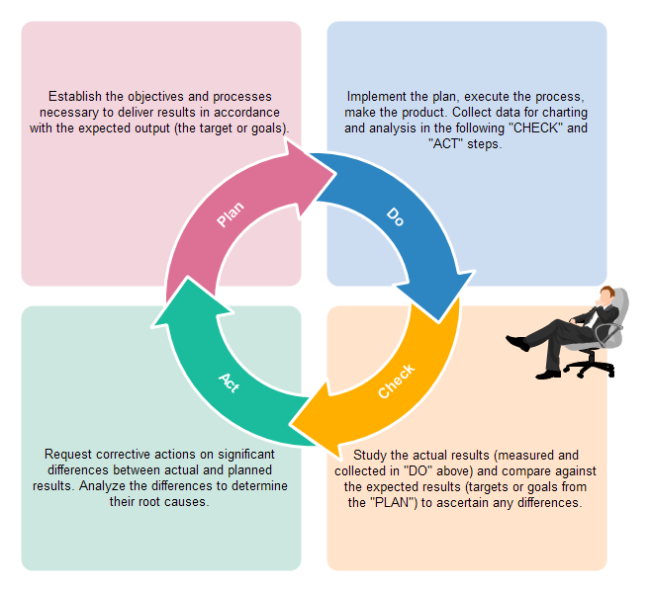
PDCA (plan-do-check-act) cycle, which is also known as Deming Cycle, is a continuous quality improvement model proposed by W. Edwards Deming in the 1950's. He recommended that business processes need to be placed in a continuous feedback loop so that managers can identify and fix the parts of the process that need improvements. He then introduced the concept of plan, do, check and act cycle. It's proven as a systematic, straightforward and flexible approach for solving problems.
EdrawMax, the best PDCA Software, offers a fast and easy way to create PDCA cycle diagram. With pre-made PDCA templates and advanced diagramming methods, you can finish a visually appealing PDCA cycle diagram in just a few minutes.

An all-in-one platform for 210+ diagrams.
・ Simple alternative to Visio
・ 26k+ symbols
・ 10K+ free templates
・ 10+ AI diagram generators


Discover More Six Sigma Tools and Templates
Phases of PDCA Cycle
- Plan: "Plan" contains three steps. The first step consists of discovering and investigating the current situation, understanding the problem to be solved, and identifying areas for improvement. During this step, Flowcharts and Value Stream Mapping can greatly help accomplish the process. The second step is to analyze the problem. To collect and interpret data on the process, a group of tools are available. Such as column chart, scatter plot, spider chart, and control charts. To identify possible causes of the problem and determine root cause, you can use brainstorming and cause-effect methods. The third step involves developing potential solutions to the problem that will be tested.
- Do: Teams implement the improvement, documenting any problems, unexpected observations, lessons learned and knowledge gained. Changes are tested before making widespread modifications to policy, procedures or systems.
- Check: Once you've finished the project, compile the list of problems and solutions you've encountered, then study, analyze, and reflect on results. Compare the new data to the baseline data to determine whether an improvement was achieved, and whether the measures in the aim statement were met. Column charts, scatter plots, control charts and radar charts are all tools that can assist with this analysis.
- Act: Now you take action to standardize or improve the process. Options include adopt, adapt and abandon. However it doesn't necessarily stop here. You need to loop back to the Plan Phase (Step 1), and seek out further areas for improvement.
More Six Sigma Tools in EdrawMax
Edraw is an all-in-one visualization software containing flexible tools for different needs. Besides PDCA diagram, Edraw also provides solutions for SIPOC diagram, Cause-Effect Diagram, Value Stream Mapping, Brainstorming, QFD, Affinity Diagram, Scatter Plot, RACI matrix, and much more to help finish your six sigma. Among the best diagramming tools available, this software is perfect for experienced diagram designers or those who are just getting started.
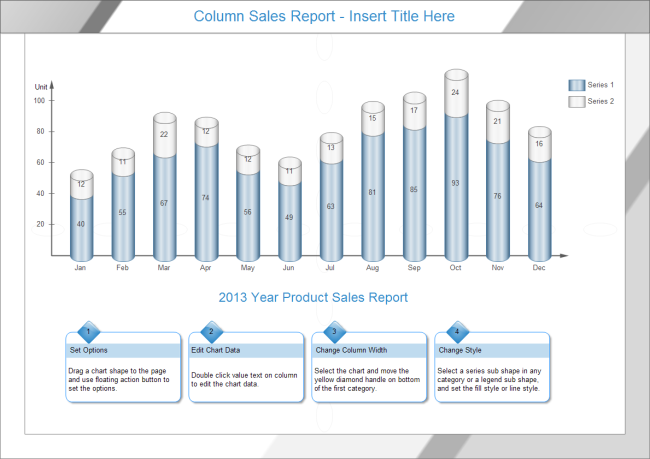
Column Chart Example
This nice-looking column chart example is well prepared to benefit our users. You can have a quick start using this vector file as a template.
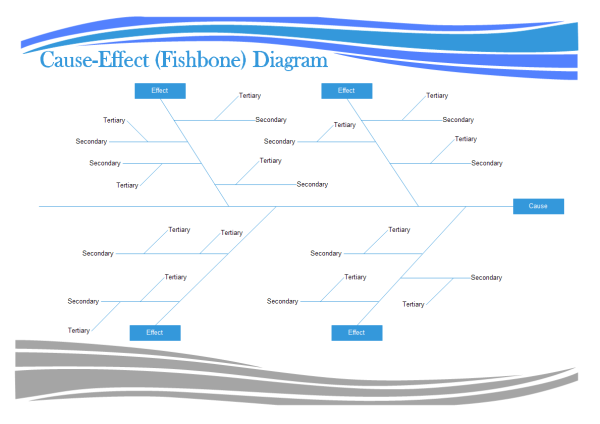
Fishbone Diagram Template
A vivid fishbone diagram template is created by Edraw aiming to eliminate difficulties in designing so that even novices can make diagrams easily and quickly.
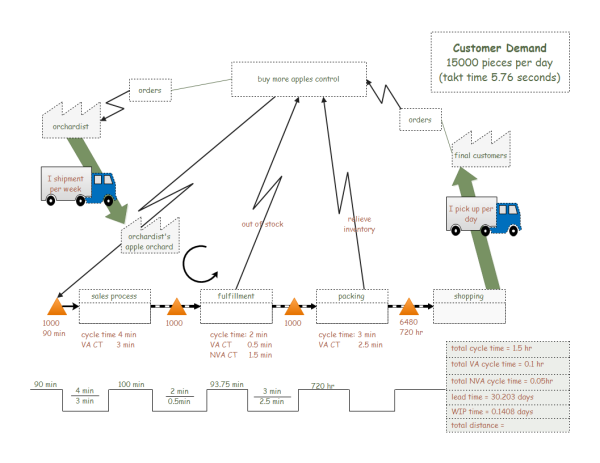
Value Stream Map Template
A unique and eye-catching value stream map template is ready for you to use. Download it and let your creativity go wild.
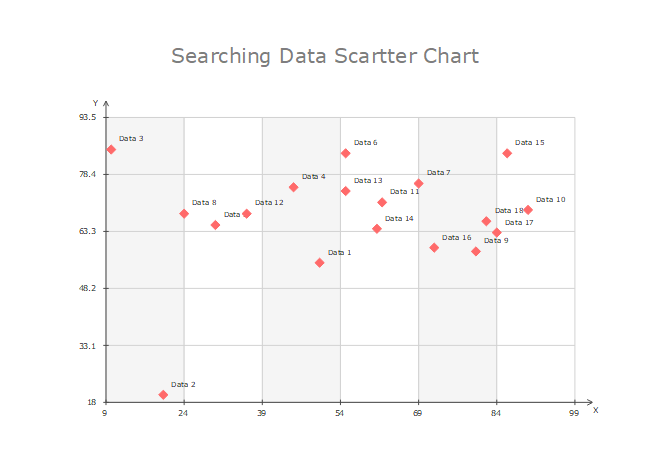
Scatter Plot Templates
Get started quickly from a scatter plot template which is easy to edit and ready to use.
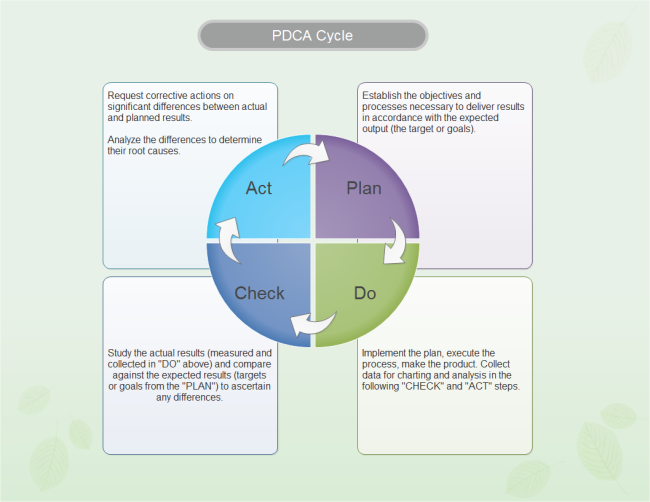
PDCA Diagram Template
Here shows an elaborately-made PDCA diagram template, which is editable, printable and sharable.