Taxonomy Chart 101 - Definition, Classifications & Examples
While The eddx file need to be opened in EdrawMax.
If you don’t have EdrawMax yet, you could download EdrawMax free from
What is a Taxonomy Chart?
A taxonomy chart is the organized graphic practice and representation of things and concepts. Usually, the taxonomy chart is used in biology to classify all living things. In the 18th century, Carolus Linnaeus suggested a classification process, and this taxonomy system is still used today.
In a chart, taxonomy is an abstract rank or level. Taxonomy is the branch of biological systematics that is concerned with the naming of organisms (according to a set of rules developed for the process), identification (referring specimens to previously named taxa), and classification (ordering taxa into a hierarchy based on perceived characters).
For example, succulents in a plant taxonomy chart collect many plants that are very similar in appearance, including size and sharpness. With the development of the understanding of things and objectives people have, taxonomy is an evolving process using different categories.
Therefore, the taxonomy chart aims to display logic and hierarchical constructs based on different purposes in a mathematical way, such as bar, linear, and pie charts.
The Classifications in Taxonomy Charts
In the biological aspect, taxonomy classification, namely taxonomic rank, is a group of organisms related to commonalities of each other in a taxonomic ordered structure. Major taxonomic categories include seven topics: kingdom, phylum, class, order, family, genus, and species.
While The eddx file need to be opened in EdrawMax.
If you don’t have EdrawMax yet, you could download EdrawMax free from
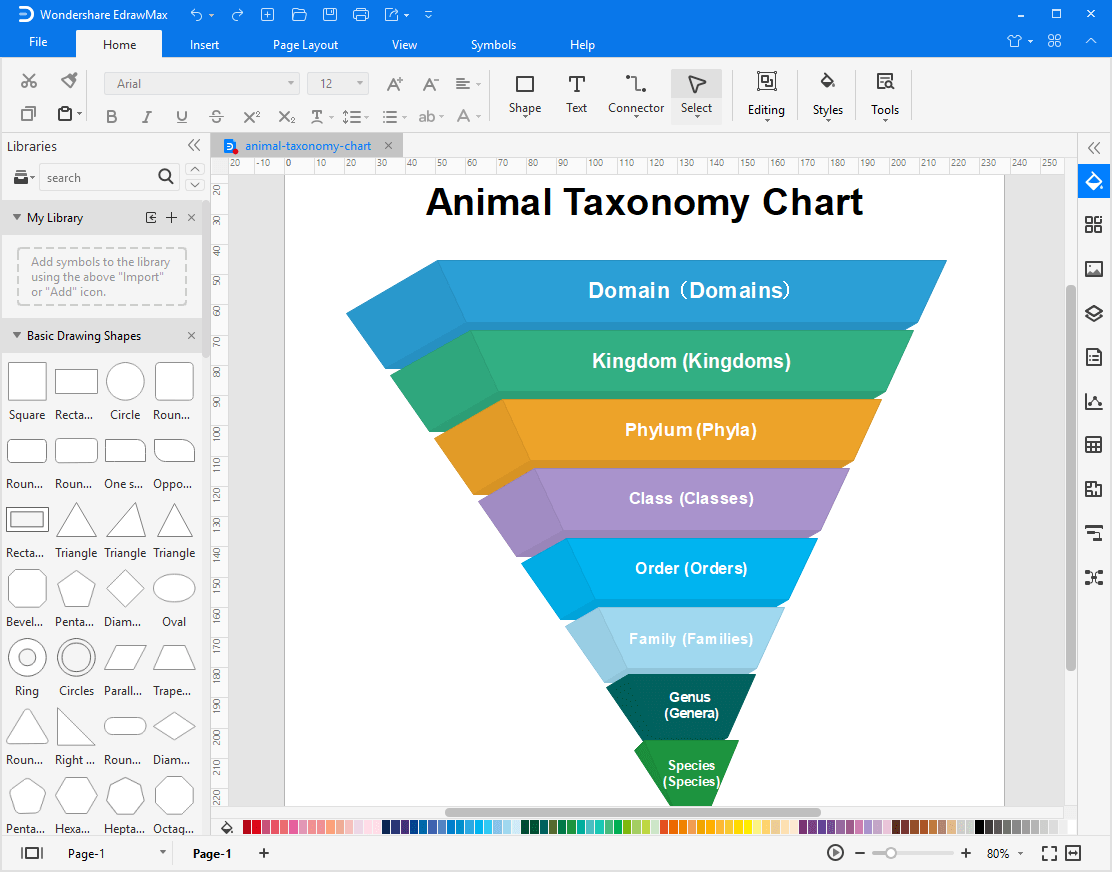
The red fox represents an inverted hierarchical triangle of each taxonomic dimension. The top of this triangle means the maximum range, and the bottom is the minimal classification for red fox.
From this graph, it is clear to see each level and classification rank and effectively build the taxonomy chart according to the subjects' or the living creatures' features. This red fox taxonomy chart is one of animal taxonomy.
Moreover, there are specific classification terms in different fields, and each taxonomic category can divide more levels and tiers. For example, the International Code of Zoological Nomenclature defines the nine taxonomic ranks in zoology: superfamily, family, subfamily, tribe, subtribe, genus, subgenus, species, and subspecies.
Overall, all living things can be classified based on their differences; from the top of the taxonomic graph, there are huge differences among living creatures. At the bottom, their differences become smaller.
![]()
Image source: https://en.wikipedia.org/wiki/Taxonomic_rank#Examples
From this graph, Eukarya in Kingdom covers fruit fly, human being, pea, and fly agaric, while E.coli belongs to Bacteria. Biology domains refer to three groups: the Archaea domain, Bacteria domain, and Eukarya domain. This means all of the living creatures belong to one of these three top levels.
The picture below tells us that all living creatures' ancestors are from these three domains, and differences exist within each ancestors' classification. The second-largest taxonomic rank in biology is the kingdom, below domain. Commonly, kingdoms are divided into five aspects: Animalia, Plantae, Fungi, Protista, and Monera.
There are also many different classification methods within the three domains according to researchers' purposes. In summary, the differences in taxonomy charts depend on the users' purpose or the usages and classification situations. In different fields, there are fixed classification approaches and terms.
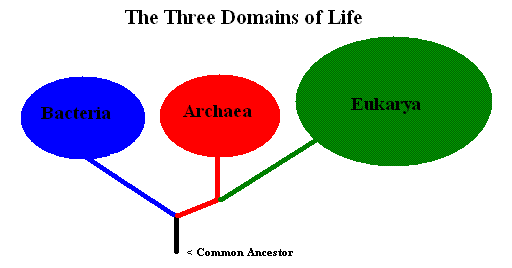
Image source: https://simple.wikipedia.org/wiki/Domain_(biology)
Various Taxonomy Chart Examples
With the classification process from top to the bottom, the context will be more specific and more minute. Besides the mentioned taxonomy charts, there are various classification examples with pictures.
Human Taxonomy Chart
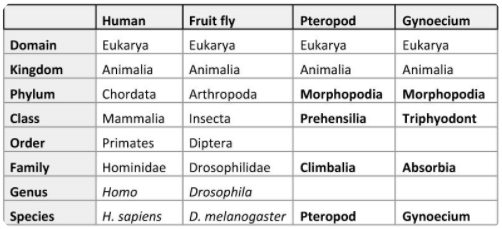
Image source: pinterest
There are 8 classified levels for human beings. From the largest to the smallest communities, the domain of human beings is Eukarya, one of the three largest communities globally; as part of this domain, humans are part of the Animalia kingdom.
Simplified, kingdom Animalia is the largest of the five existing kingdoms on Earth. From this taxonomy chart, human beings, fruit fly, pteropod, and gynoecium belong to the same domain and kingdom, which means that these members all have membrane-bound organelles.
Moreover, Eukarya can be divided into five kingdoms: Plantae, Protista, Animalia, Chromista, and Fungi. It means each kingdom includes a set of organisms that share similar characteristics, and these organisms in each kingdom are considered biologically distinct from the others.
Next, the smaller division after Kingdom is Phylum, and a human being is chordate of Phylum. The more you go down, the more minute the classification is. This kind of taxonomy table could effectively show the commonalities and differences among different living communities and contract living things orderly and logically.
The Classification of Class Insecta
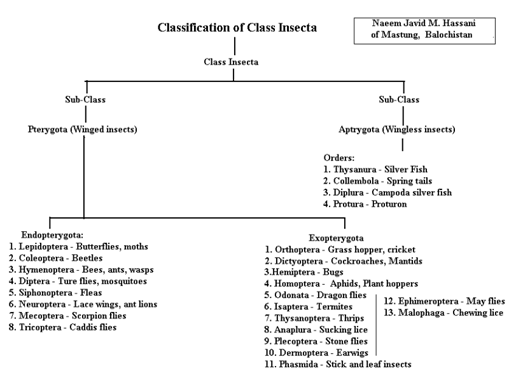
Image source: https://forestrypedia.com/classification-of-class-insecta-insects/
This graph represents the class classification in insects. The insects are divided into two groups according to insects' wings: winged and wingless groups. Next to the order taxonomy, there are four wingless insect groups in order level.
In contrast, in winged insect groups, the order lever continues to separate into two more parts: Endopterygota and Exopterygota. Also, each order-level contains more than eight smaller groups. This linear graph shows readers a clear map of each division, and the reader can quickly locate specific groups.
The Classification of Kingdom Animalia
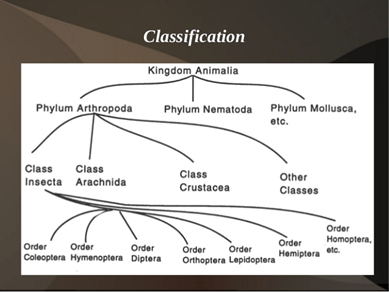
Image source: https://www.slideshare.net/ncarrejo/basic-entomology-2013-01-29
In this kingdom Animalia taxonomy chart, there are three types of Phylum: Arthropoda, Nematode, and Mollusca, but this graph emphasizes in class and order of Phylum Arthropoda.
Moreover, Arthropoda Phylum contains Insecta (as mentioned before), Arachnida, Crustacea, and other classes. Class Insecta also could be separated into seven smaller groups based on characteristics of wings: Coleoptera, Hymenoptera, Diptera, Orthoptera, Lepidoptera, Hemiptera, and Homoptera.
This is a part of the kingdom classification, but it gives users a way to explore the combination of lines and taxonomy approaches. Readers could follow the lines to find the destinations of each sub-division and separate from other sub-divisions.
Pomacanthidae Tree
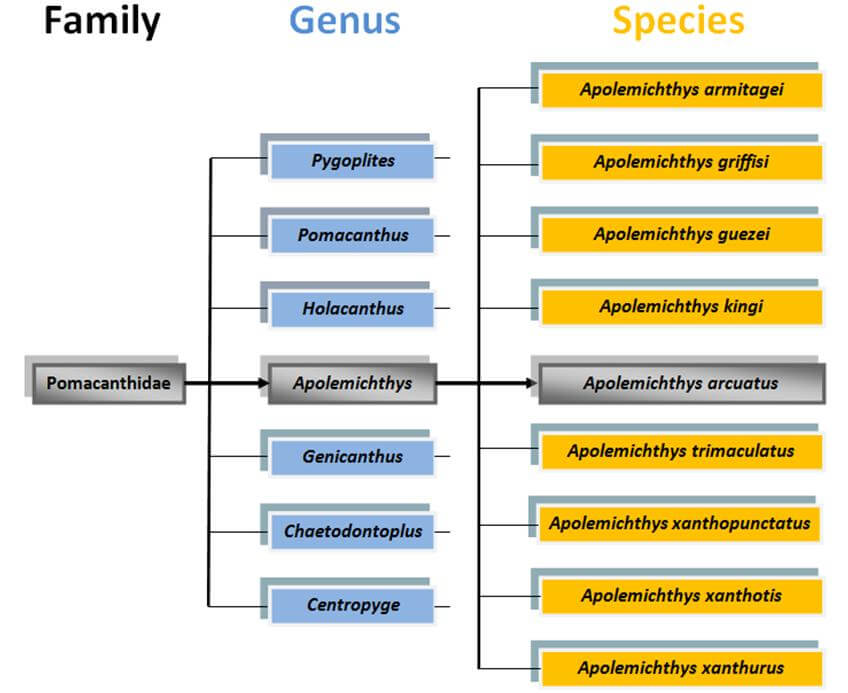
Image source: http://bioweb.uwlax.edu/bio203/s2009/brocker_jord/Classification.htm
This graph starts at the level of Family in the order of taxonomy approach. Each branch is created from a distinctive feature that separates each level from others.
The first branch in the tree is the Family of this species. The middle of this tree highlights this species' path throughout the tree concerning each classification level. It is that each Genus has a branch to show the Species level.
This type of taxonomy chart offers readers a clear and concise map, which means readers could roughly see the overall classification at first glance. Readers can quickly know the classification number of each classified rank.
Overall, a taxonomy chart facilitates search and discovery and is knowledge-based. This relates to knowledge and personal preference. Specifically, throughout classifying the living creatures on the planet by features and commonalities, people could gain an in-depth understanding of them and analyze them from different angles.
Moreover, taxonomy is also limited to living things and other unliving subjects such as stationery and school supplies. The final goal of the taxonomy chart aims to the development of discovery and analysis abilities. During the classification process, the users' logic and expression also will be practiced.
Learn more about Phylogenetic Tree and Cladogram.
Uses of Taxonomy Charts in Our Life
Usually, a biological taxonomic chart is composed of eight categories based on a hierarchical ranking system. The highest rank is always the most general classification, and the lower the rank goes, the more specific the classification becomes.
Steps to Taxonomy charts
There are a few simple steps to get access to taxonomy charts:
1. The preparation
- Browsing and Researching
- Identification
- Define your taxonomy chart model
- Drawing a rough classification map
Before drawing your taxonomy chart, please make sure your research materials are sufficient and understand your classification reason. This means you have to know how to classify your materials, such as subjects' differences and commonalities.
Also, a simple and rough draw is a good way to establish your formal taxonomy chart, which could help you to map your materials and thoughts. Moreover, different chart models could bring different emphases and functions. Taking a few times on the chart model choice or searching a similar topic taxonomy chart could make you more effective in finishing your projects.
2. Drawing
- Characterization
- Classification
After identifying or labeling the characteristic you choose, you can quickly start your taxonomy chat. Mark how many levels and sublevels you need and then create them.
3. Reviewing and re-editing
After creating taxonomy charts based on your purposes, reviewing thought your chart and editing again could make you chart better, which means your chart would be more precise. After that, sharing with your friends and getting suggestions is also a great way to modify your taxonomy chart.
Why EdrawMax
EdrawMax is an all-in-one diagramming tool easily to create your personalized taxonomy charts with strong chart model supplement and function support.

An all-in-one platform for 210+ diagrams.
・ Simple alternative to Visio
・ 26k+ symbols
・ 10K+ free templates
・ 10+ AI diagram generators


