What is a Cladogram?
Know it All about Cladogram
Much like a branching tree diagram, cladograms are a way of showing relationships between different organisms. These drawings are used in cladistics, and nowhere resembles an evolutionary tree; they are instead used for tracing out the common hypothetical ancestor that exhibits similar characteristics as the other organisms of the taxonomy.
The history of cladograms is vague; however, it is thought to date back to the 1950 era when Willi Hennig, a German entomologist, introduced his ideas on cladistics. Hennig wrote a book discussing the phylogeny of organisms and ways to discover the relationship between them. However, since the book was not in English, it stayed ignored till 1966, after which it was translated, and the ideas were interpreted.
Hennig, in his book, had proposed the idea of classifying organisms through a branching system rather than a ladder-which was being used previously. Since then, Hennig is credited as the founder of cladistics.
A typical cladogram will exhibit the following features:
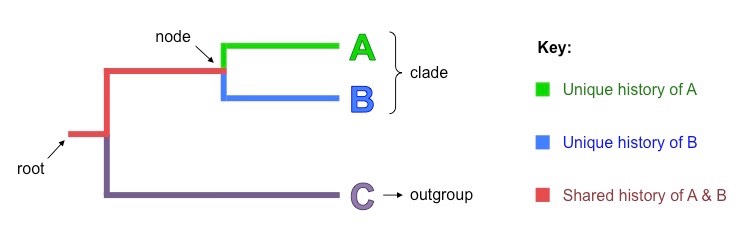
The root is a common initial ancestor and is marked as the starting point for the diagram. An incoming line represents that the root comes from larger clades.
A node is a region that marks the point of divergence in cladograms and represents the hypothetical ancestor that further divides to bifurcate into two or more daughter taxa.
A clade is a specific part of the cladogram that includes the recent ancestor and its descendants. It can be indicated by marking out a particular node and all of its associated branches.
The branches indicate the bifurcation of the root into nodes. Links between the organisms can be deduced via tracing out the branches.
The taxon or the outgroup is the most distantly related organism in the entire chart. This group doesn’t usually form a clade and instead offers a point of comparison for the rest of the cladogram.
The most significant advantage of using a cladogram is the convenience and ease they provide. Cladograms are pretty important, especially in biological studies, because they offer a quick overview of the traits of ancestors. For years, they have been used by biologists and are effective at sorting out organisms based on their characteristics.
However, the biggest drawback of using a cladogram is that they only provide hypothetical ancestral information. Sometimes, this information can be misleading and misguide you about the ancestral heritage of the organisms. Besides, cladograms with overabundant branching can make it difficult to understand and interpret the diagram.
As defined previously, clades are a specific group of organisms in a cladogram that shows one ancestor and its branching descendants. They have been subdivided into three main categories: monophyly, paraphyly, and polyphyly, describing the different ways of grouping the taxa. Let’s have a look.
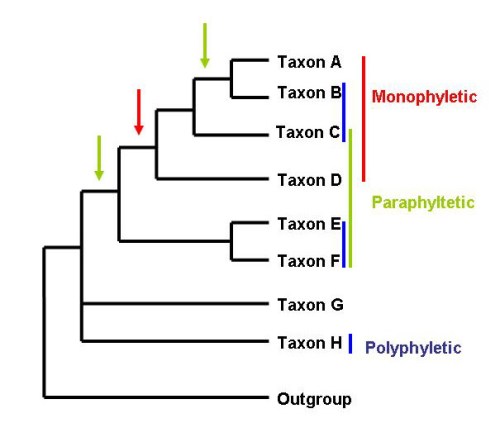
As interpreted from the term ‘mono,’ these groups refer to a single clade form the fundamental basis of taxonomy. The monophyletic group shows descendants of a single common ancestor. Any organism that descends from that specific ancestral lineage will be considered a part of this group.
Paraphyletic clades do not include all the descendants of a specific ancestor; instead, a certain subset of organisms is deliberately ignored while forming this group. Interestingly, these clades have great practical value and are used to describe the surreal lineage of dinosaurs and birds.
Polyphyletic groups are those taxa that do not share a common ancestral lineage and have multiple origins. They are grouped based on a common characteristic that is thought to be inherited from a common ancestor, but in fact, it isn’t. Polyphyletic groups are confusing, and cladists and phylogenists rarely use them.
Cladograms are often confused with being a phylogenetic tree; however, this is not true.
Both of these diagrams represent a phylogenetic analysis and aim to show the linkages between the different taxa. The constructing process is also similar, and even the characters used for describing organisms are similar. However, the cladogram is a type of phylogenetic diagram and is considered the essential step for constructing complex phylogenetic diagrams.
Let’s have a look at how these both are different from each other.
| Features | Cladogram | Phylogenetic Diagram |
|---|---|---|
| Representation | Cladograms only represent the linkage between different organisms. They offer a hypothetical image of the common ancestor of the organisms. | Phylogenetic diagrams connect the organisms via evolutionary changes and are regarded as evolutionary trees. They provide an accurate representation of ancestors based on evolutionary history. |
| Nature | These diagrams are simple and very easy to understand. | These diagrams are complex and require a good knowledge of evolution to understand them. |
| Branching | The branch length is equal and does not represent the evolutionary distance. | The branch lengths are variable depending on the evolutionary distance between two organisms. |
| Position of Taxa | The external taxa link neatly in a proper row or a column. | The taxa may or may not be arranged in a row or column form. |
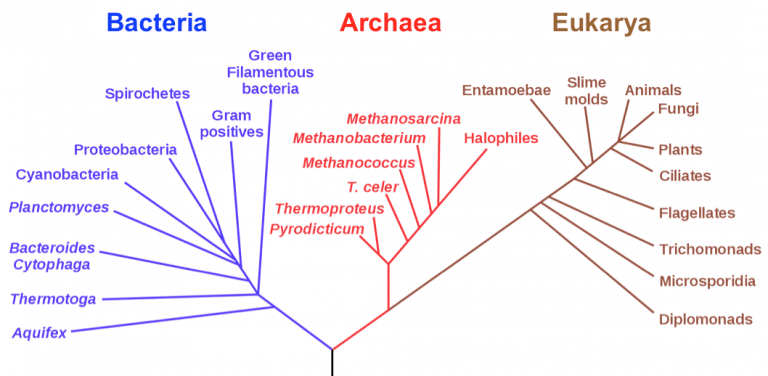
Here is a phylogenetic tree of life.
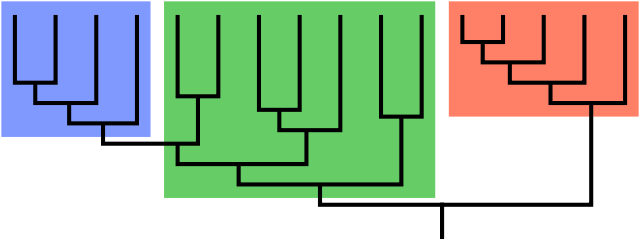
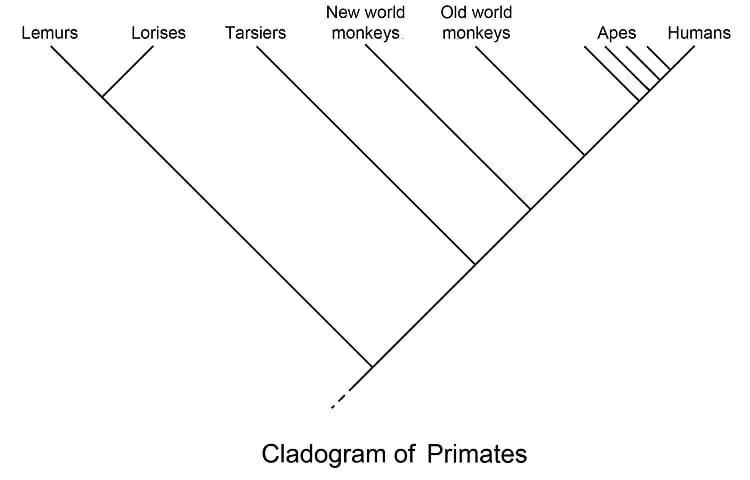
Here is a cladogram.
Source: https://www.researchgate.net/
Reading and interpreting a cladogram is super easy. Follow these steps to learn how to read a cladogram.
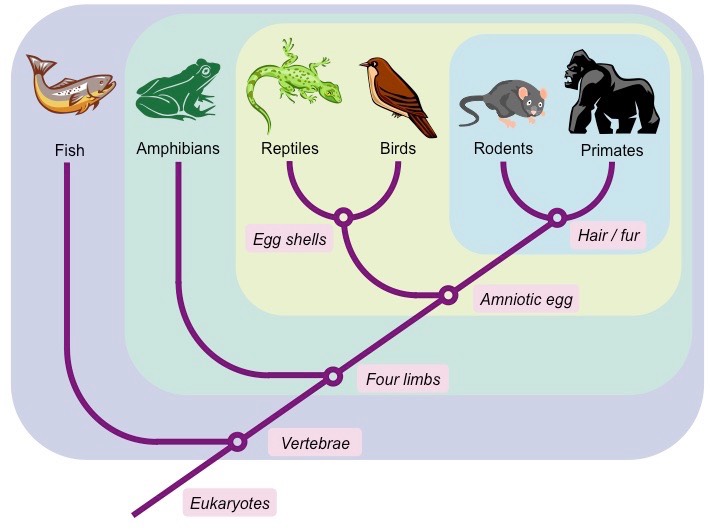
The cladograms have a starting point that branches into different directions. The starting point represents the common ancestor of all species, while the branching ends indicate the descendants.
The speciation is indicated at the nodes and marks the arrival of a new trait in the diagram. Trace out the intersection points and deduce the similarity between the group of animals bifurcating from the specific intersection point.
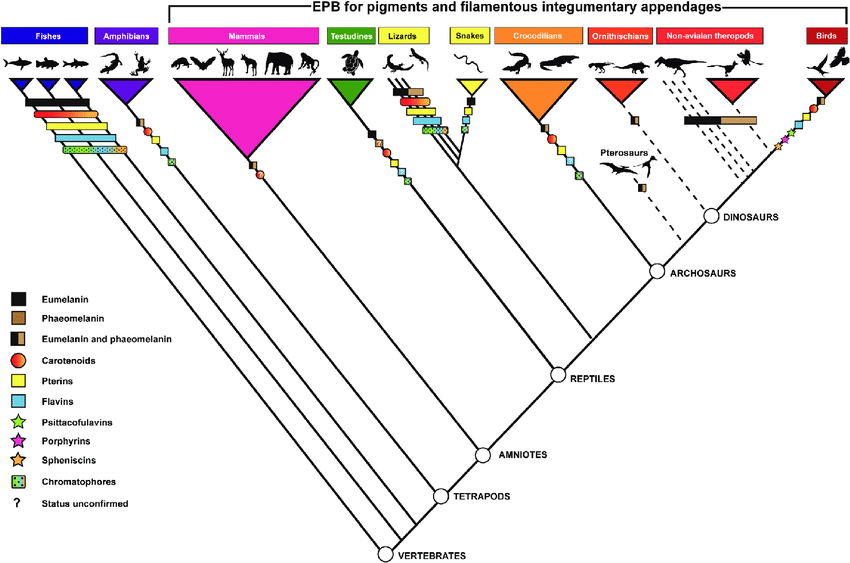
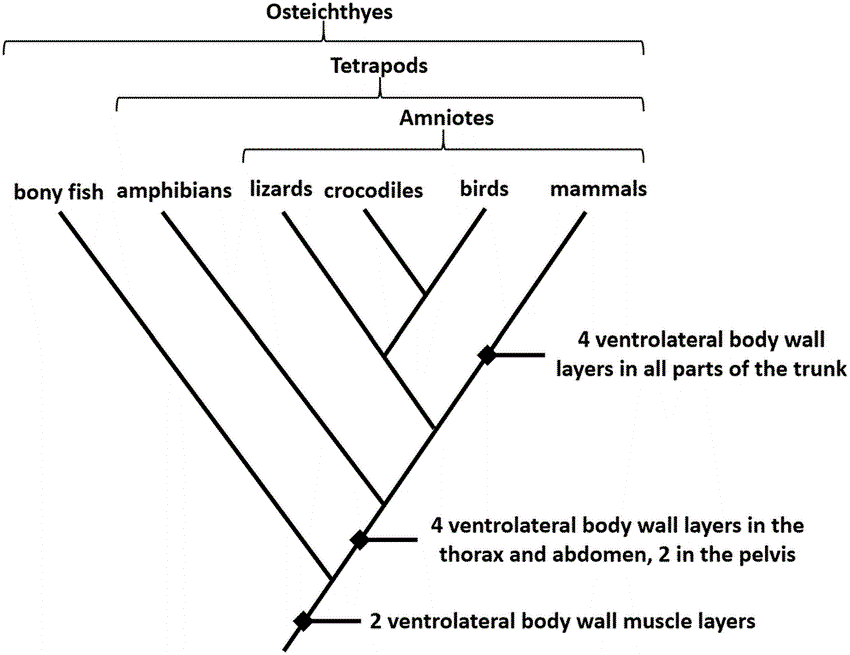
While one part of the intersection line branches to show animals, the other shows the characteristics that aid in grouping the organisms. This can also be seen in the picture below. Mark out all the animals corresponding to a specific trait to interpret the classification.
Cladograms are made based on either their structural characteristics or molecular features like DNA and RNA. However, in recent times, cladograms constructed on molecular features have become more popular than the other type. Let us have a look at the constructing method for both of them.
1. Choose a group of organisms and classify them based on their external features. Make sure to choose only developmentally fixed features instead of environmentally influenced.
2. Next, group and order your data for the cladogram. Group them by drawing a Venn diagram or a table.
3. Display each characteristic on a node, and the species that least resembles any characteristic will be placed at the end as an outgroup.
1. Choose a gene, DNA, or RNA protein that is common to all the organisms in a group. (e.g., hemoglobin, cytochrome C). Select the molecular evidence wisely, i.e., DNA or protein sequence. Even though proteins are preferred proof, DNA patterns are great for studying recent evolutions.
2. Align the genetic data by using software like Clustal Omega and deduce the similarities and differences between the protein sequences. Closely related animals will show a higher degree of similarity.
3. After the sequence alignment is done, the Clustal Omega will create branched phylograms.
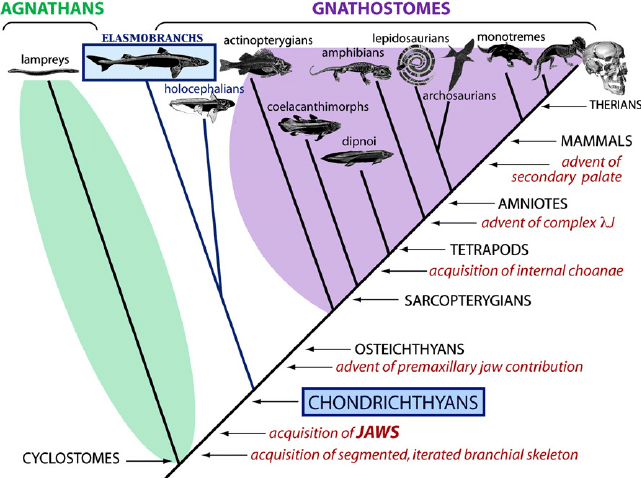
Cladograms are an effective way of differentiating between organisms and tracing out a common ancestor. Following are some examples that will help you understand these charts better.
Cladograms are indeed a great way of differentiating between organisms and discovering a hypothetical common ancestor for them. With simple branching and no major complexities involved, the diagrams are easy to draw and understand.
However, the whole drawing process is further simplified and made easy with EdrawMax. Offering an extensive range of tools, user-friendly interface, and beautiful templates, constructing a cladogram with Edraw is just a 5 finger process. So, what are you waiting for? Collect your data and sign up on Edraw to start creating the most beautiful cladograms in a wink of an eye!

・ Simple alternative to Visio
・ 26k+ symbols
・ 10K+ free templates
・ 10+ AI diagram generators


