Cause & Effect Analysis - 6M
Want to create a fishbone diagram? Design Now!
EdrawMax Fishbone Diagram Maker helps to create specialized fishbone diagram with ease. You can edit the built-in template and design it in your own style. Just give it a shot.
Part 1: What is 6M/6M's?
6M/6M's is a mnemonic tool used primarily used when it comes to problem-solving or decision making. The Cause and Effect diagram, also known as Fishbone Diagram, proves extremely beneficial when exploring or dissecting any production or industrial operations problems. It is a problem-solving technique that identifies the likely causes of a challenge and undertakes to fix it.
The 6M method encourages people to explore problems in multiple ways.
*If you want to know more cause and effect diagram directly, please click here.
Click here to see the HD version of the template.
1. Download 6M Method template by clicking here for free.
2. Use EdrawMax fishbone diagram maker to open and use this 6M Method template. Download from the button below.
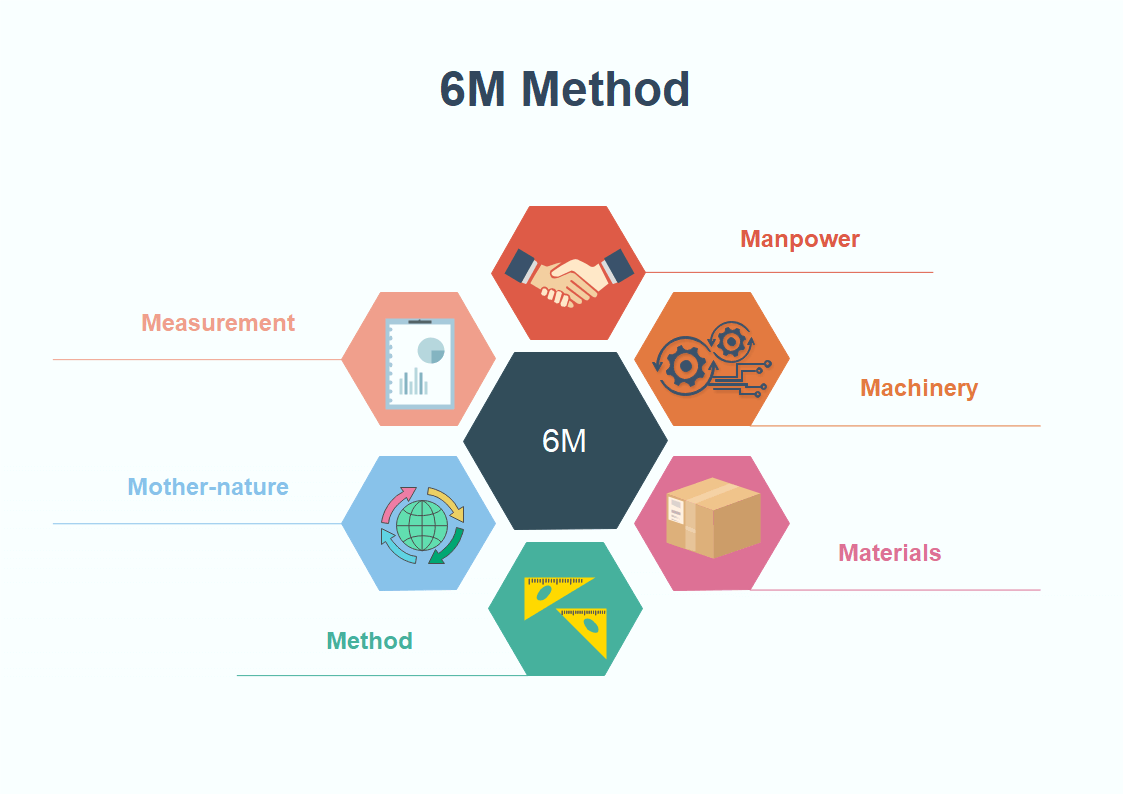
6M method is based on the following parameters:
- Manpower: Revolves around the operational and functional labor of people involved in the industry's processes. This parameter checks on whether the personnel's technical proficiency and experience are up to standard. Whether the staff has quality consciousness, sense of responsibility and discipline are answered by this 6M method aspect.
- Machinery: Touches on machines, tools, and other facilities together with their underlying support systems. Is the machinery employed for production capable of delivering the intended output? Are machines and tools well-managed to achieve excellence?
- Material: Raw materials, components, and consumables management to satisfy production and service delivery. This parameter checks on the correct specification of materials, their proper storage, labeling, and subsequent usage.
- Method: Production and support processes and their application or contribution to service delivery. Does any of the methods relied on in your processes have too many steps and integral activities that don't add value to the whole system?
- Mother-nature: Considers both controllable and unpredictable environmental influences in the operation processes. Weather and other natural events fall into this category. It makes it easy to take note of the many environmental factors that are manageable under ardent considerations and how to handle those that are not.
- Measurement: Inspection, evaluation, and other physical measures – whether manual or automatic. Staying keen about calibration errors and other measurement challenges to avoid inconsistencies becomes important under this parameter.
Part 2: How to Use 6M in Cause and Effect Analysis?
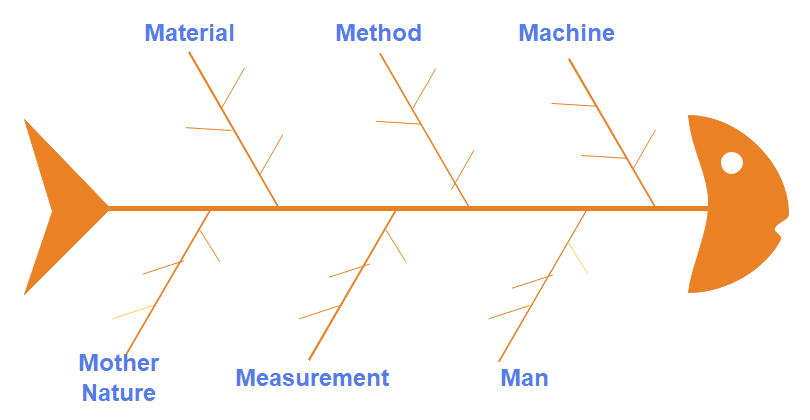
The 6M Method in Ishikawa Diagram centers on a problem and explores its prospective causes to solve it and foster wholesome operations. Also known as Fishbone Diagram (due to its appearance) or Ishikawa Diagram (named after its developer), the mnemonic representation of the characteristic dimensions to contemplate when brainstorming is indisputably significant during problem-solving sessions. The 6M Method encourages the capturing and assorting of challenging issues under the 6M categories.
Click on the picture to see more fishbone diagram templates.
Once an issue is captured and documented, the causes are placed according to the Cause and Effect diagram categories. This model encourages management to view problems in multiple ways. Classifying the causes shouldn't plunge you into indecisiveness. When a single cause seems to fall into different categories, take a quick vote where to group the cause and move on improvement plans.
Improvement plans you agree on should start with the most significant issues first. The 6M Ishikawa Diagram plays an important role here as it helps separate the causes and improvement plans into categories and even rank them in terms of importance.
EdrawMax
Efficient Fishbone Diagram Maker >>
- Superior file compatibility: Import and export drawings to various file formats, such as Visio
- Cross-platform supported (Windows, Mac, Linux, Web)
Part 3: Examples of 6Ms
The 6Ms in Cause and Effect Analysis is a multi-facet approach to solving every organization’s or industry’s problem by subjecting it to thorough and balanced considerations. The following examples depict how useful the method can prove in solving issues for smooth operations.
6Ms in Manufacturing
- Method: Specific regulations or policies causing slow-downs in processes.
- Mother Nature (Environment): There is too much moisture in the environment; Temperatures are too cold affecting other production processes
- Manpower (People Power): Training new people adequately; Ensuring training is consistent.
- Measurement: The equipment is regularly calibrated and maintained to avoid errors in calculations or contaminations that result in false readings.
- Machine: Maintenance issues with tools used and the number available for operations.
- Materials: Any issues are getting raw materials from suppliers or transport challenges recorded—problems with the quality of supplies.
6Ms in Marketing
- Market: Identify the target market to achieve marketing goals while saving costs and time.
- Message: The right message that differentiates your brand among its competitors.
- Media: Which media and mechanism would be most successful in getting your message out?
- Money: With the market and message to be communicated clearly defined and the medium to pass information outlined, set a budget for marketing and allocate money.
- Manage: Execute your plan. Everyone involved should have a plan with set timelines to get everything done.
- Measurement: Monitor the results from all your marketing efforts and streamline the whole process to consistently yield the right number and type of leads.
Part 4: Definition of 4M/5M/8M
4M
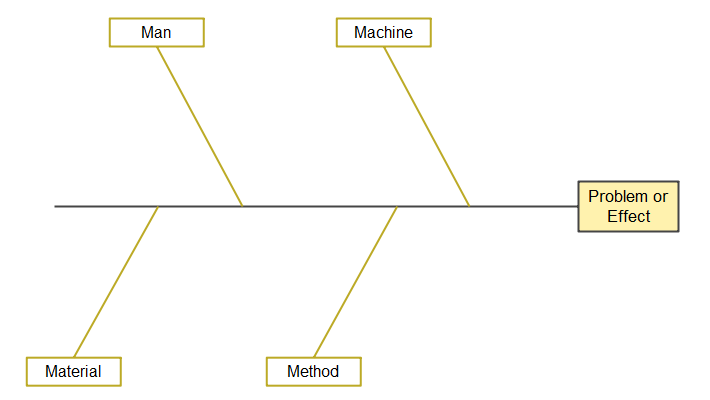
4M is a typical structure utilized in problem-solving methods by first pointing potential causes of production issues. Most organizations are familiar with this concept that makes every associate a confident problem-solver within a firm.
The 4Ms stand for Man (Manpower), Machine, Material and Method. Refer to their illustrations above. Other M's have sometimes been added to the full effect of the Ishikawa Diagram.
5M
5M Method is based on five causes. This version of the Fishbone Diagram is a versatile method used to identify causes or risks, inefficiency, low quality, and other business processes issues. It adds the Management aspect to 4Ms.
8M
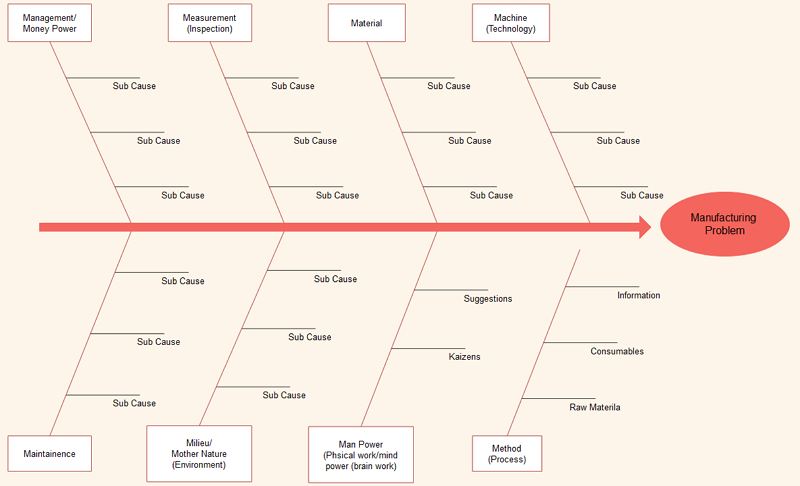
The problem causes in the 8M Cause and Effect Analysis diagram are often categorized as Man (Manpower), Machine, Material, Method, Management, Mother Nature (Environment), Measurement, and Maintenance. The 8ms lists factors or causes all affecting the main problem in one drawing for in-depth analysis.
Part 5: More Cause and Effect Diagram Examples
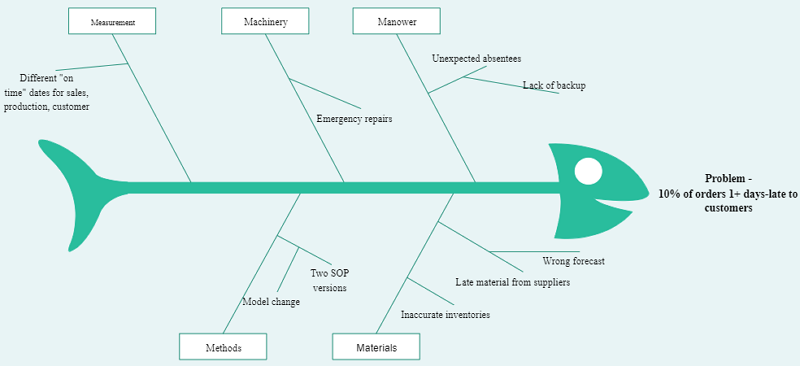
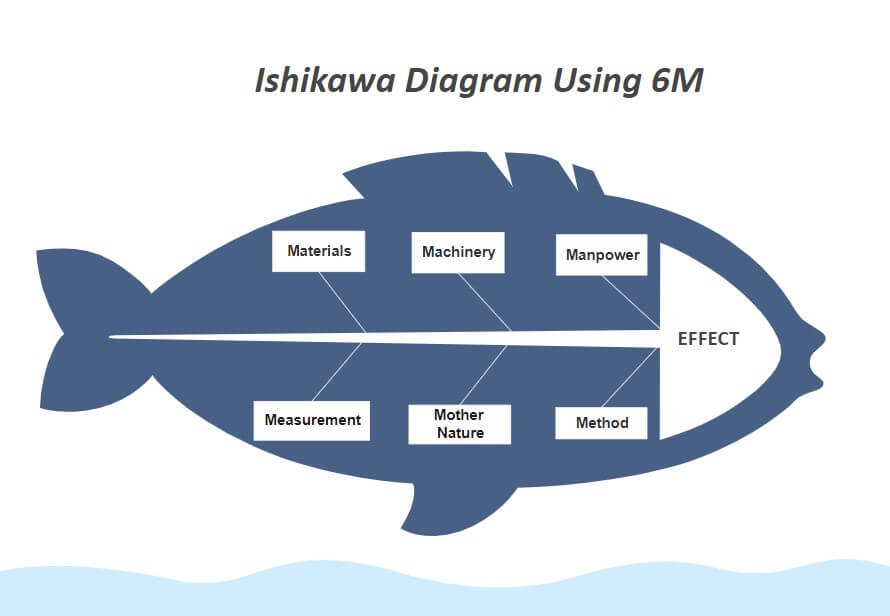
Example 1: Ishikawa Diagram Using 6M
Ishikawa diagram examines a broad set of possible causes of a problem for the issue to be analyzed. These are referred to as the 6Ms – Methods, Machines, Materials, Measurements, Mother Nature, and Manpower in the manufacturing industry.
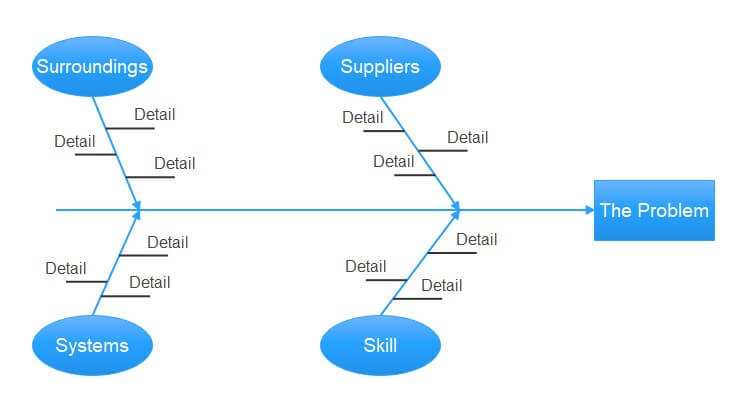
Example 2: 4S Model
In the service industry, the categories are mostly referred to as 4S:
Surroundings – Is your firm projecting the right image? Is it impersonal?
Suppliers – Do you have any problems with low-quality material deliveries? Are there any issues delivering service?
Systems – Are there good policies and procedures in place for all scenarios?
Skill – Do employees have adequate experience? Are they adequately trained?
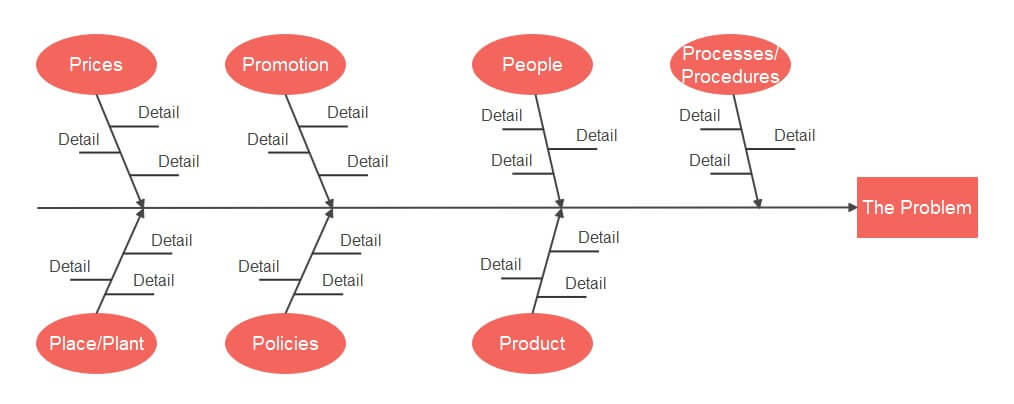
Example 3: 7Ps Model
In the marketing industry, the Cause and Effect diagram often consists of 7Ps. These relate to Product, People, Process/Procedure, Promotion, Price, Packaging, and Plant.
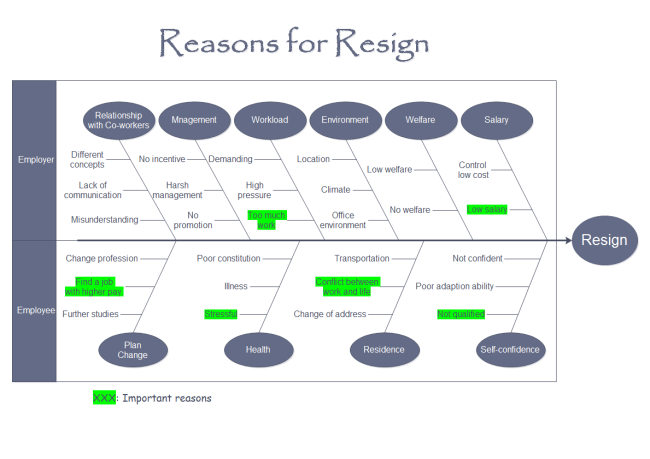
Example 4: Reasons for Employee Resignation
In this Cause and Effect diagram example, we have tried to diagnose the various reasons for an employee’s resignation.
Apart from the 6 major factors, we have considered other scenarios like salary, work environment, health, residence, management, workload, and other factors. All these factors have been further explored, considering the possible causes for employee resignation and their effects.
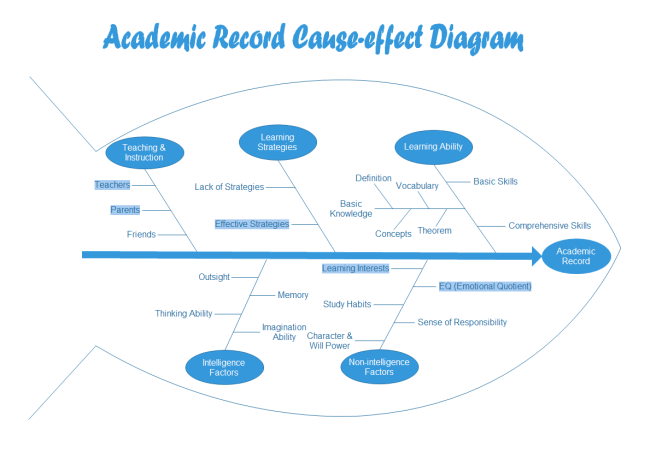
Example 5: Results of an Academic Record
In next Cause and Effect diagram, you can explore the numerous possibilities for one’s academic results. In this, we have considered things like one’s learning abilities, teaching, learning strategies as well as intelligent and non-intelligent factors that can affect their result.
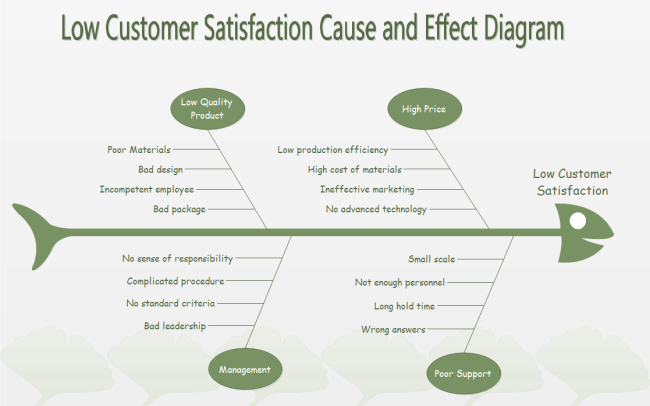
Example 6: Low Customer Satisfaction Fishbone Diagram
Lastly, you can check the Cause and Effect diagram for low customer satisfaction. Ideally, things like high price, low-quality product, poor customer support, and management are some of the major causes of the lack of customer satisfaction. All these causes are further explored in this Low Customer Satisfaction fishbone diagram.
That’s a wrap, everyone! After reading this post, you would be able to know more about the Cause and Effect analysis in detail. To help you come up with informative Cause and Effect diagrams, I have included the 6M analysis plan as well. You can also work on any Cause and Effect diagram by using a reliable and user-friendly diagramming tool like EdrawMax.
Part 6: Conclusion
Cause and Effect Diagrams make it easy to examine a problem in production or service delivery processes by organizing the potential causes into smaller categories. Thus, it becomes simpler understanding the relationship between contributing factors. The best practices in Fishbone Diagram entail identifying the problem, brainstorming, drawing the backbone, adding causes and effects, analyzing the information to come to solutions fortified by creating action items.
One of the best ways to gain from 6M insights is by using the 6Ms approach as a spine on the Fishbone Diagram and then ask the five why's to narrow down the potential root cause. Remember the 6 elements contribute to variation in all processes, but none of the M's is unduly influencing the process when you have a bell-shaped curve.
More Related
How to Create a Cause and Effect Diagram


