T Chart
Part 1: What is a T-chart?
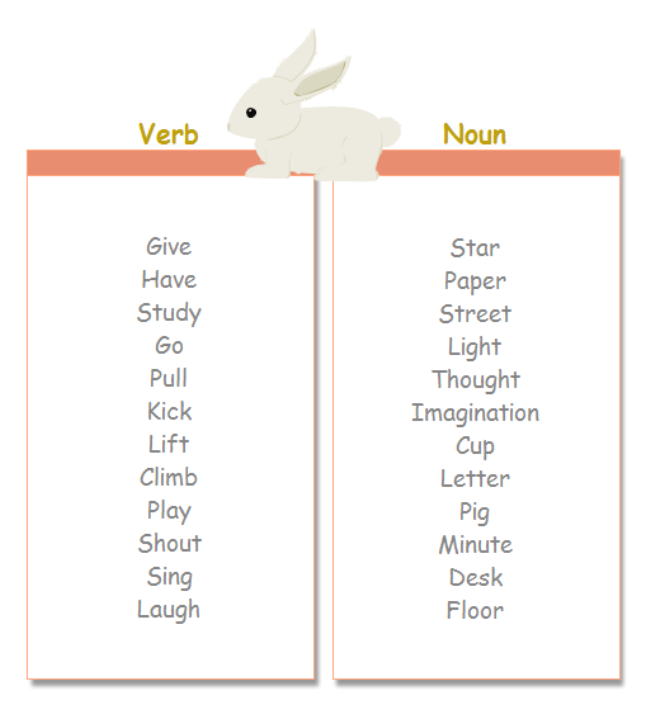
A T-chart is a visual representation of two opposing points of view on a subject. Something that can be neatly divided into two opposing viewpoints qualifies as a subject. T-charts are often used to evaluate the benefits and drawbacks of a big decision. Truth vs. beliefs, benefits, and drawbacks, or strengths and limitations are some other contrasting viewpoints that work well.
A T-chart gets its name from the two-column basic version, which resembles the letter "T" and is flexible and widely used in all aspects. Besides, a T-chart has a basic layout and two headlines and a list of points that set them apart. On the other hand, it is more like a 2D column diagram.
Part 2: Purpose and Benefits of a T-chart
The T-chart is a helpful graphic organizer that students can use to visually compare and contrast ideas. T-charts may be used for books or book characters, science phenomena, or social studies activities in any subject field or genre. Moreover, with the help of these, you can do the following:
- Sort the data into categories
- Analyze and discuss the difference between two or more items
- Demonstrate a change
A T-chart’s straightforward layout makes it the best to be used widely in classroom activities. It is smart to make students use T-charts to make important class decisions. Students, for example, may wish to choose a location for a class field trip. Ask students to list one of two options at the top of each column as a class (or in small groups), then list the advantages and/or disadvantages of each option. After these have been identified, the class will compare the data and make the best decision possible.
Similarly, students may compare the viewpoints of two political candidates or list the benefits and drawbacks of a group transitioning to geothermal energy. Making students use their thoughts in a class discussion or a persuasive essay via a T-chart can be beneficial and easy to comprehend as well. Furthermore, by doing so, students can get creative with their thoughts and determine the two facets of a story, situation, or object.
Part 3: When to Use them?
Now you know that with the help of a T-chart, each part of a situation is correctly identified. Moreover, it provides ample and appropriate descriptions to explain each facet of a situation.
A T-chart is often used for educational purposes because it is easier to absorb the provided knowledge due to its easy operation. Here are a few other situations when you should use a T-chart for exemplary representation:
- Advantages and disadvantages
- Pre and post scenarios
- Effects and causes
- Pre and post scenarios
- Then and now
- Benefits and drawbacks
- Issues and their remedies
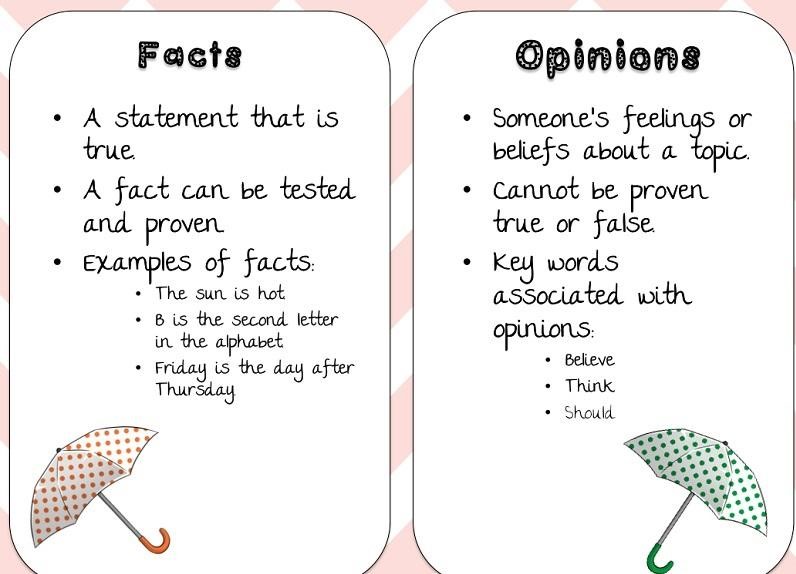
- Opinions vs. facts
- Weaknesses and strengths
- Correct or incorrect
Other than those mentioned above, you may come across many other frequent applications of a T-chart organizer.
Part 4: How to Use and Create a T-chart with EdrawMax?
After knowing what a T-chart is, its purpose, and application, next comes queries like creating them. Although they are easy to draw and work on, you might still require a little guidance on how to start. With a handy tool like EdrawMax, you can start creating illustrations without any prior experience.
In case you do not know, EdrawMax is a free and easily accessible framework with a large collection of professionally designed templates, diagrams, models, and what-not. So, start challenging your inner creative selves and learn how to create a T-chart using EdrawMax . Without further ado, let’s look at the steps that you need to follow to create your masterpiece.
Step 1: Gather the information you will need
To begin drafting your T-chart, you must first gather some important details. For example, you should know what you are comparing or evaluating and the most important criteria to include in your list. If you are creating a T-chart of advantages and disadvantages, start by writing them down on a piece of paper. This will help you organize the data or information without creating a mess.
Step 2: Use EdrawMax to build your T-chart
Next, head over to EdrawMax's official website and log in to your account. To save time, you can simply search for any readily available template on T-chart from here. You can even download the application onto your laptop, it’s compatible with both macOS and Windows. Whereas, if you want to create your design, you can start with a blank slate.
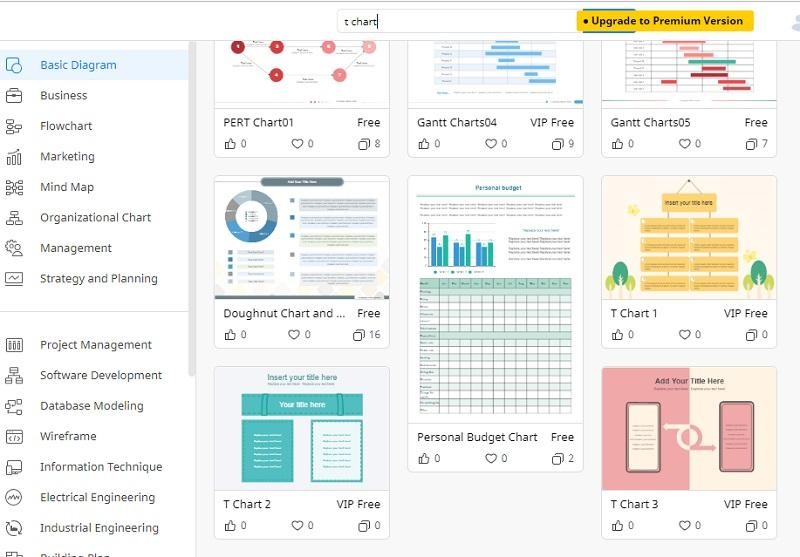
However, you will still have the option to import your desired vectors later in the process. You may also change the overall context, color scheme, and other aspects of the illustration and modify it as per your requirement.
Step 3: Save and Export the T-chart
In the final step, you need to pick a desirable format to export the T-chart you just generated. To do so, go to Menu >File > Export. Keep in mind that you can also save it to your profile or upload it to Google Drive or Dropbox.

An all-in-one platform for 210+ diagrams.
・ Simple alternative to Visio
・ 26k+ symbols
・ 10K+ free templates
・ 10+ AI diagram generators


Part 5: Tips for Making the Best T-chart
There's a lot that goes into creating the ideal visual content, and it's easy to overlook a few details. When done right, it can be helpful however, once overdone, it may be of no use. That is exactly why you need to look over multiple aspects of a scenario. Therefore, keep in mind the below tips when creating your data representation.
- Produce clear and logical writing that is suitable for the project, intent, and audience in terms of production, organization, and style.
- Examine how and why characters, incidents, and concepts evolve and communicate in a text.
- Don’t go heavy on animations, colors, or features. For a pre-drawn template, go to EdrawMax and start creating.
Part 6: A Example of T-chart
If you are running late and want to save time, you can easily make use of the already constructed templates available on EdrawMax. Visit their website and you’ll surely find the right one for yourself.
Cause and Effect T-chart
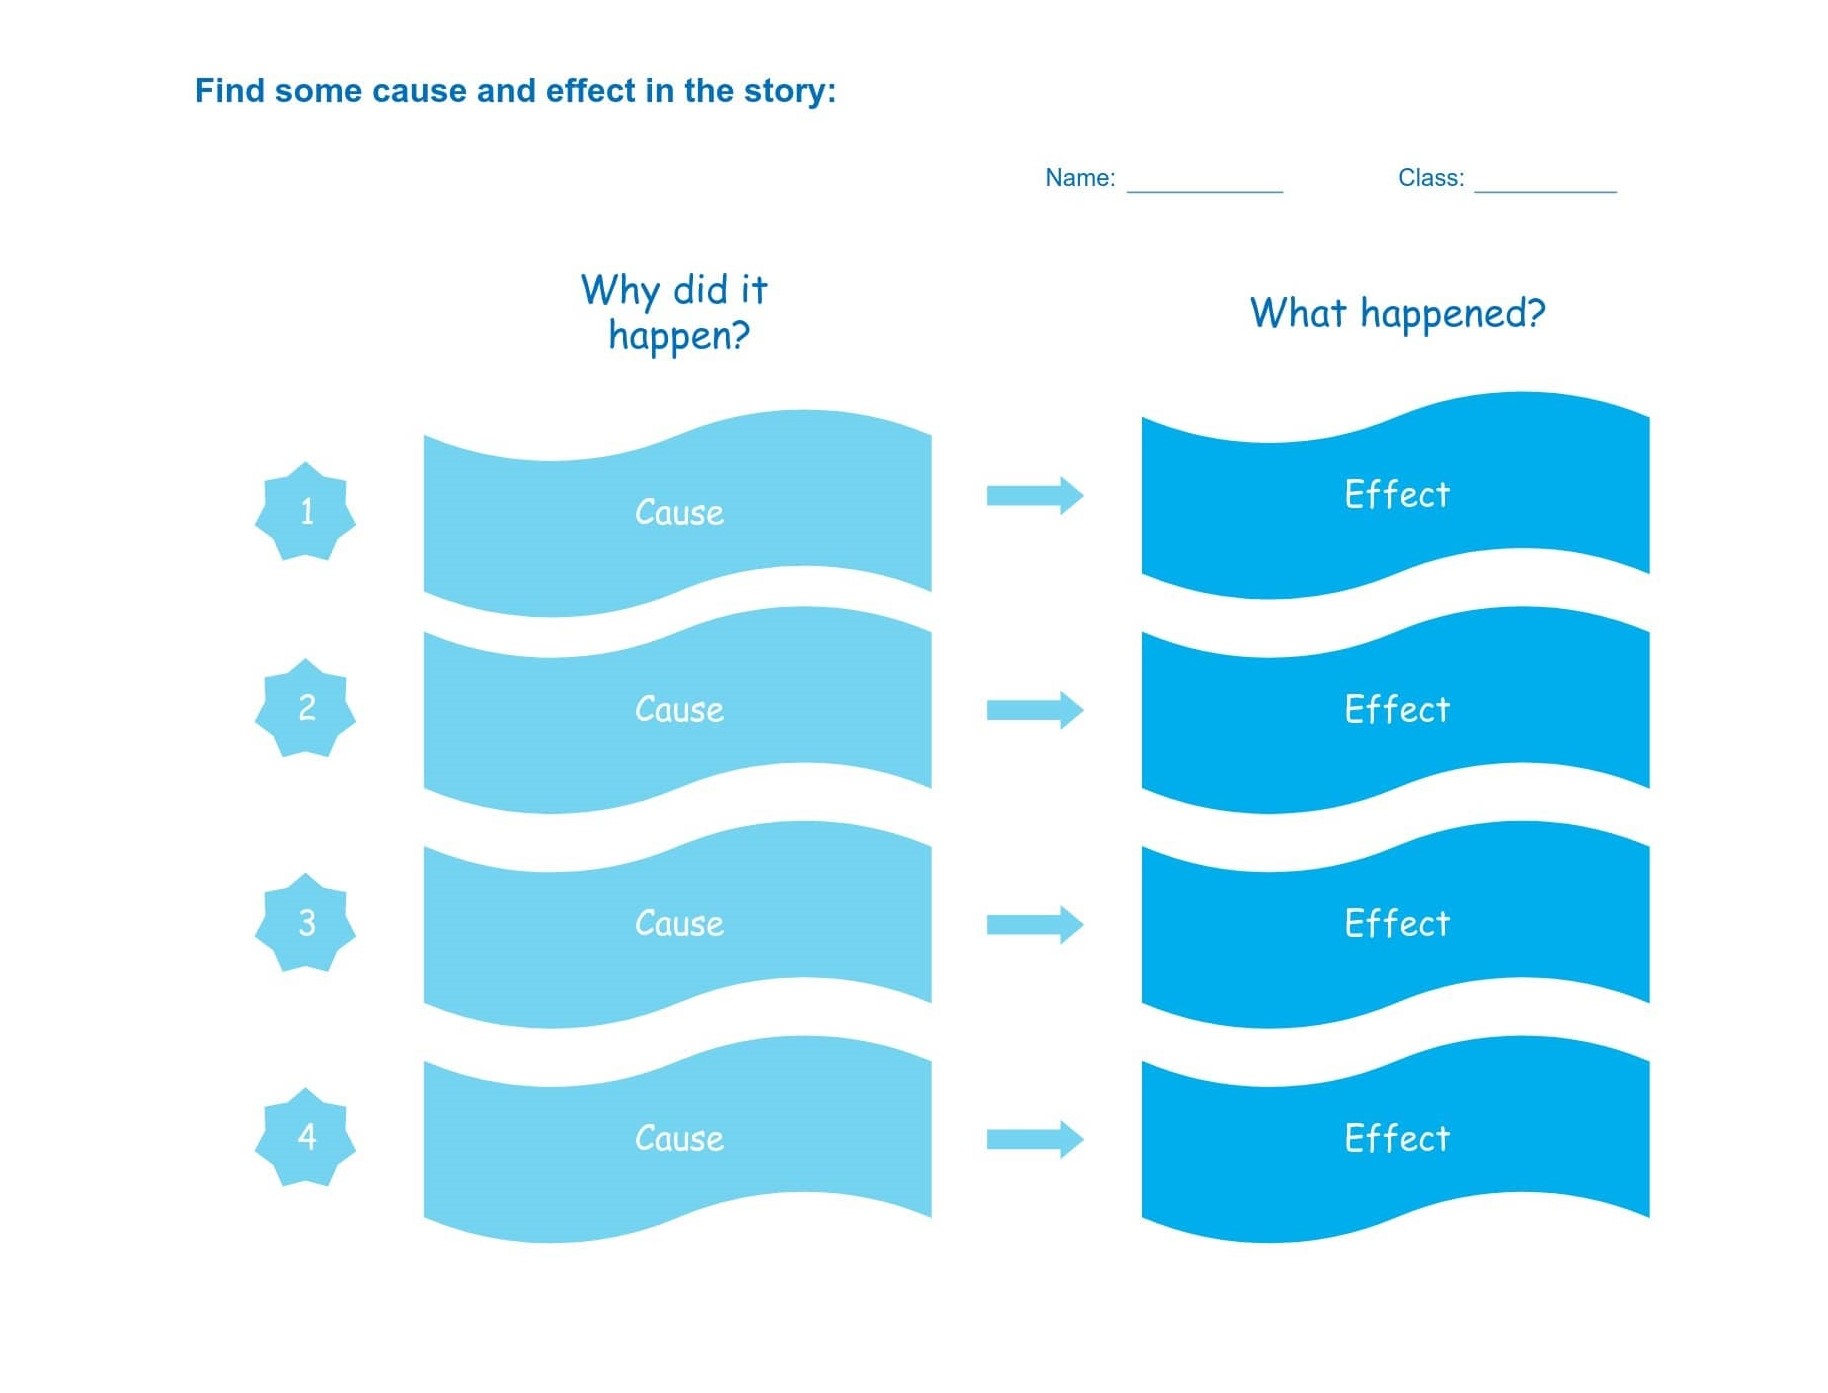
A cause and effect relationship T-chart aids students in recognizing, comprehending, and remembering various causes and results. As seen in the diagram above, students can easily and quickly make notes based on video clips or even images. Moreover, this easy template also promotes quick learning.
Part 7: Conclusion
In the above article, you got to know all about a T-chart. For instance, its benefits, purpose, how and when to use, etc. Also, the process of creating a T-chart on EdrawMax was discussed. A T-chart constructively divides data into columns and ideally compares data. Its versatile layout is beneficial and widely used across various discussions.
So, take notes and get unlimited benefits from accessing EdrawMax’s official website. Get your hands on the already available templates or create your own with just a few steps.


