Gantt charts on Google Docs are an excellent introduction to project management. Learn how to make Gantt charts in Google Docs or switch to an advanced tool to represent a project timeline better.
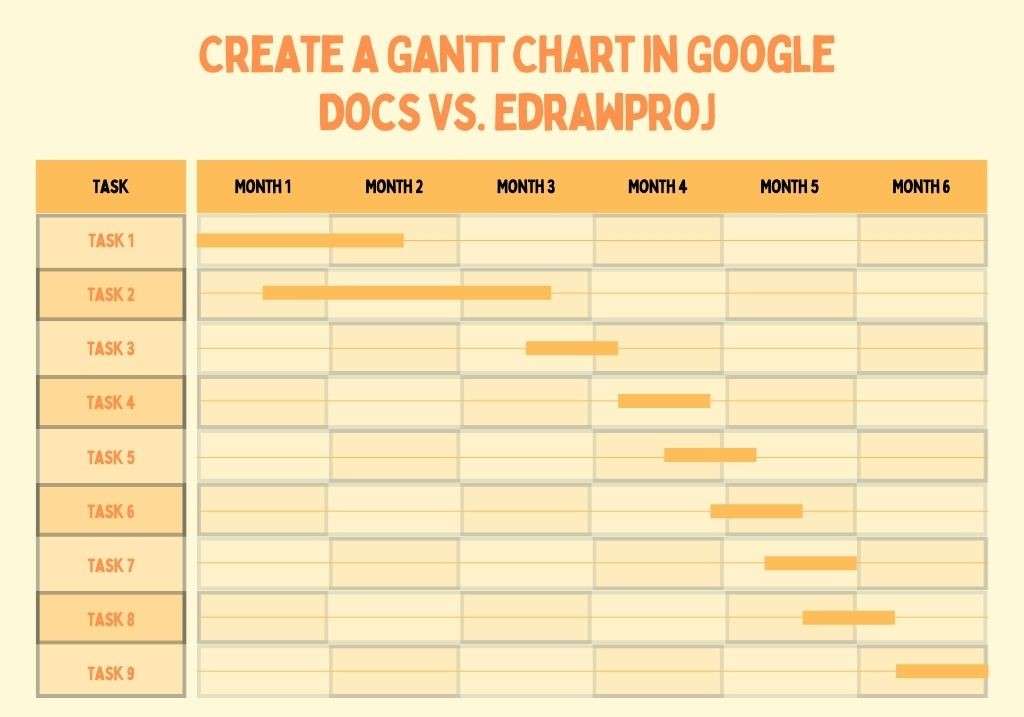
Gantt charts are project management tools to plot a project's timeline. Simply put, it is a chart that represents the project's events, tasks, activities, dependencies, and deliverables.
At first look, you may feel dizzy by looking at the never-ending information and may go down the rabbit hole. However, it is more straightforward than it seems. You can easily create a Gantt chart on Google Docs.
But be mindful that this is not where it stops. Projects are constantly evolving in the planning stages, and so are Gantt charts. So, it’s better to switch to more advanced project management software like EdrawProj and add intricacies to your project. Let’s see both Gantt charts on Google Docs and EdrawProj.
How to Make a Gantt Chart on Google Docs?
Here is a step-by-step guide on making a Gantt Chart on Google Docs.
- First, log into your Google Account and open Google Docs.
Step 1: Insert the Graph
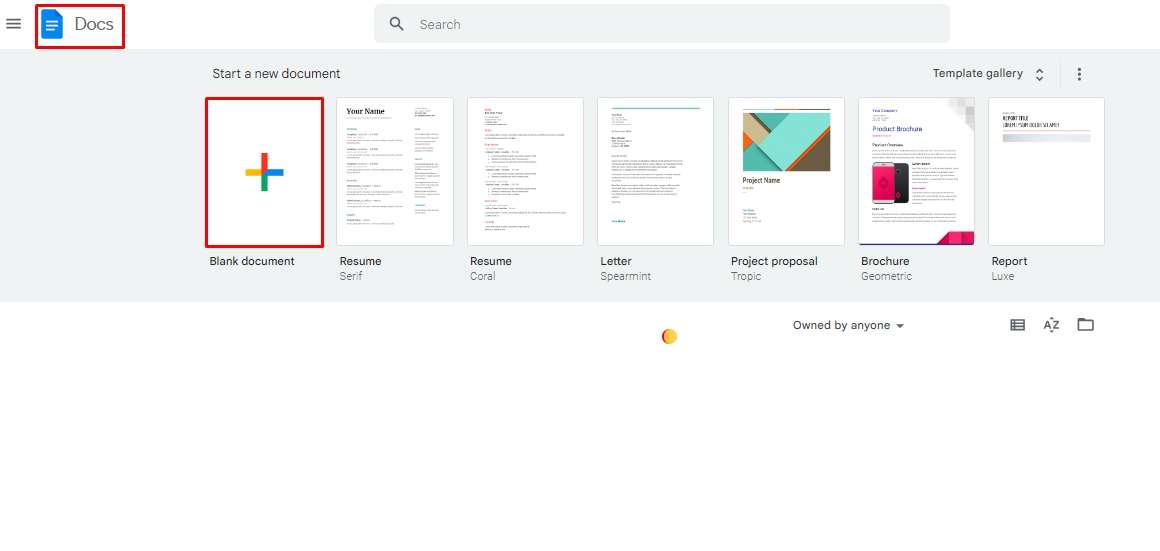
Open Google Docs and click (+) to create a blank document.
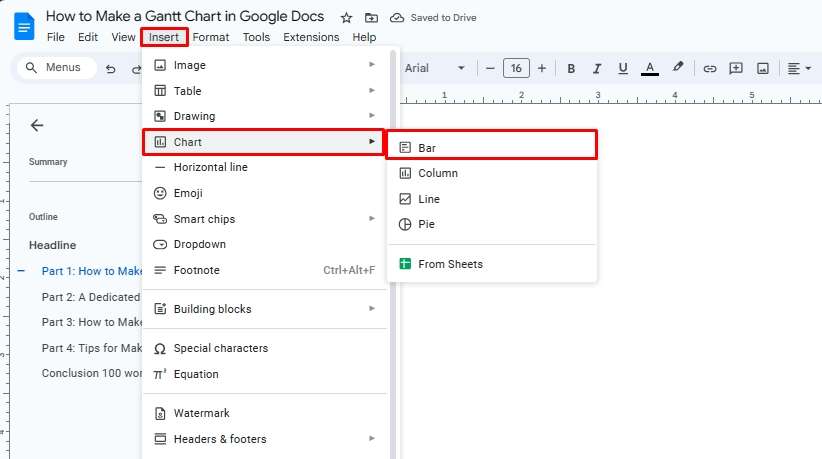
Go to the Insert tab and click Chart > Bar.
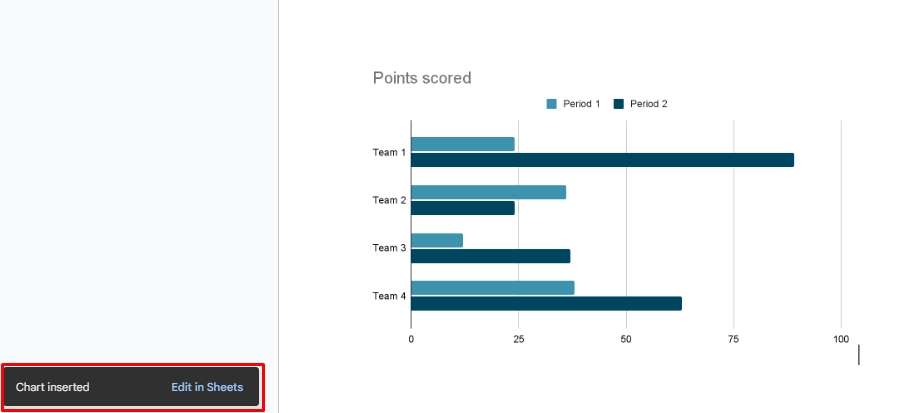
Now, click the Edit in Sheet pop-up at the bottom right of the page.
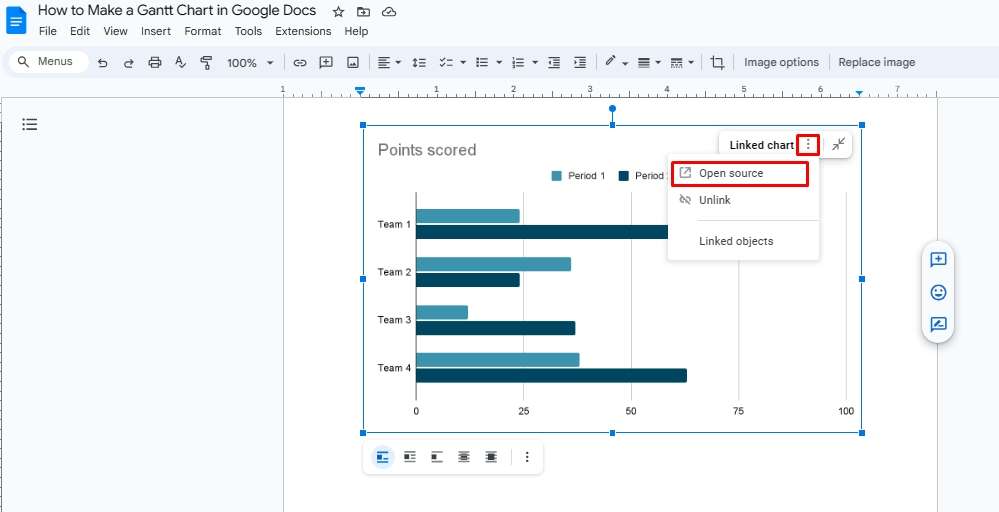
Or, click the ellipses icon on the top-right corner of the chart and select Open Source. It will take you to the Google Sheet for editing.
Step 2: Insert Data
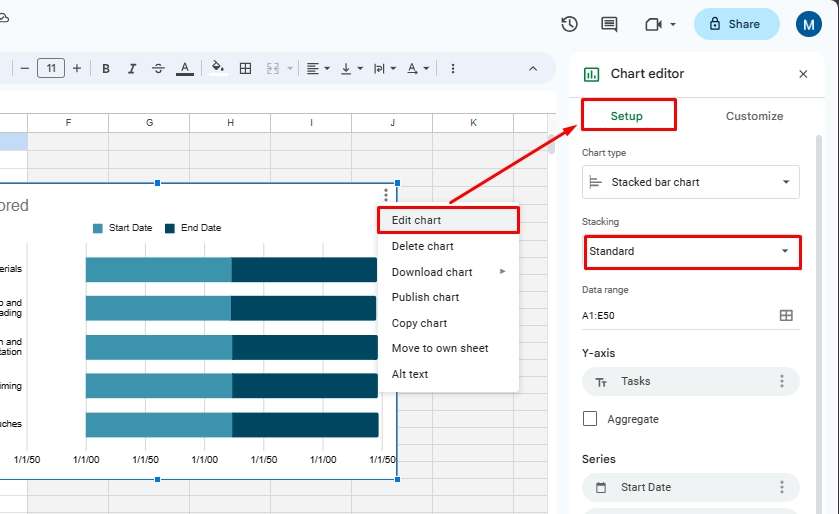
Once on the Google Sheets, adjust the chart’s layout to a stacked series. Click the ellipses icon on the chart’s top-right corner and click Setup > Bar Chart > Standard.
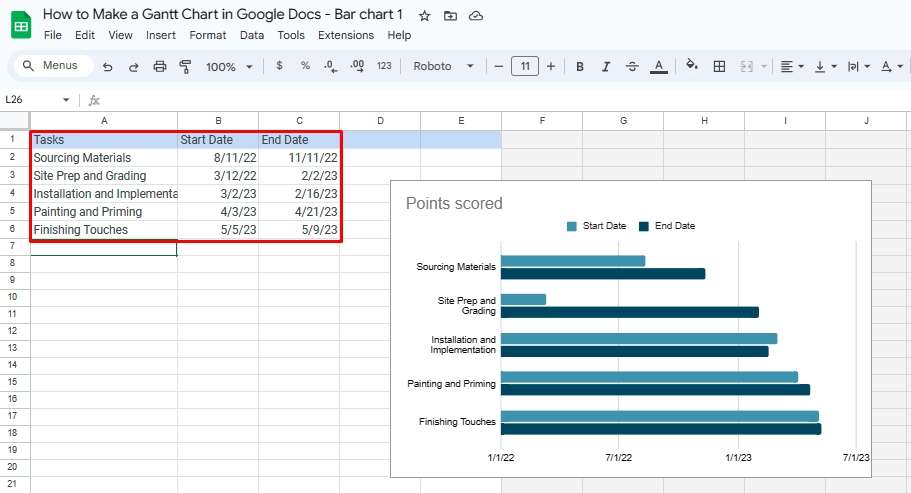
Next, insert the data in the Google Sheets columns.
- Column A represents the project’s tasks.
- Columns B and C represent the tasks’ start and end dates, respectively.
Double-check your chart’s data.
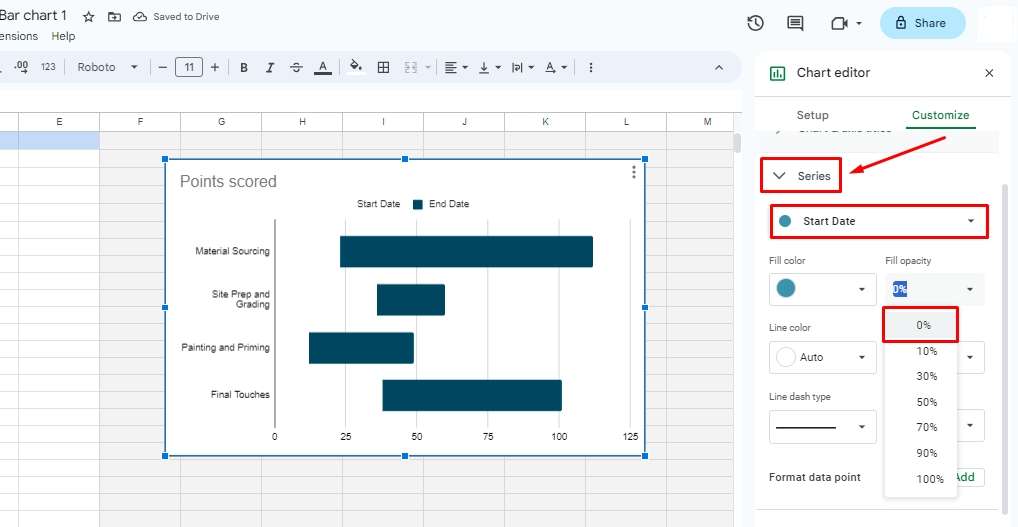
Once done, click the ellipses icon again and go to Customize. Click Series > Start Date, and change the fill capacity from 100% to 0%. It will display the duration of each task.
Step 3:
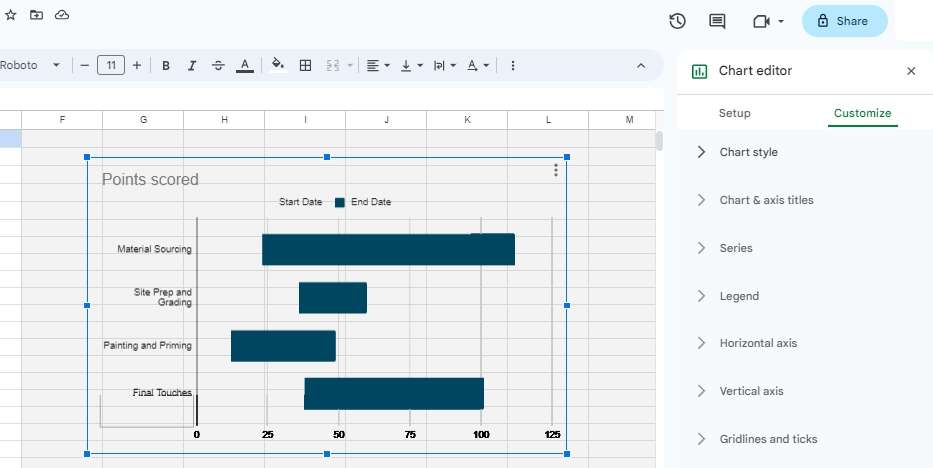
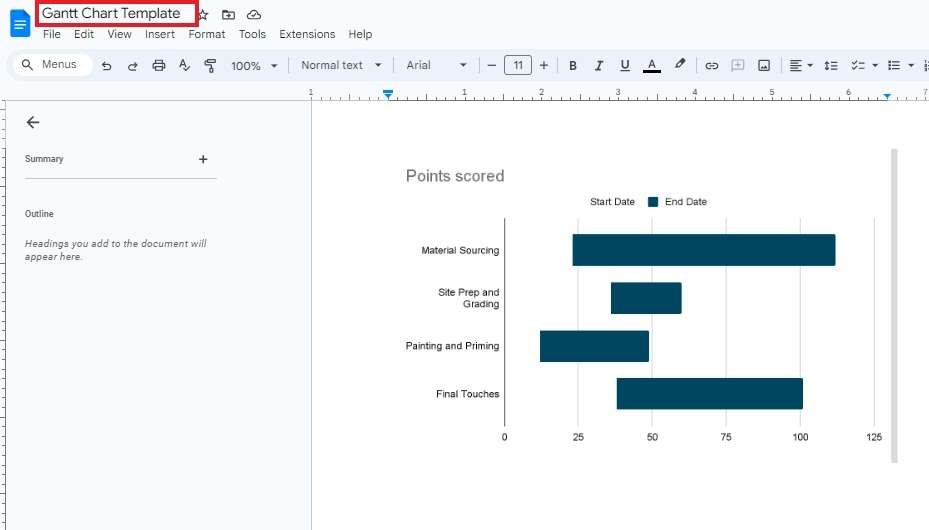
Congratulations, your Gantt chart is complete, but adding some colors will make it visually appealing. So, while you are on the Customize tab, change the formatting of your chart. It allows personalizing the background color, font, axis, and border color.
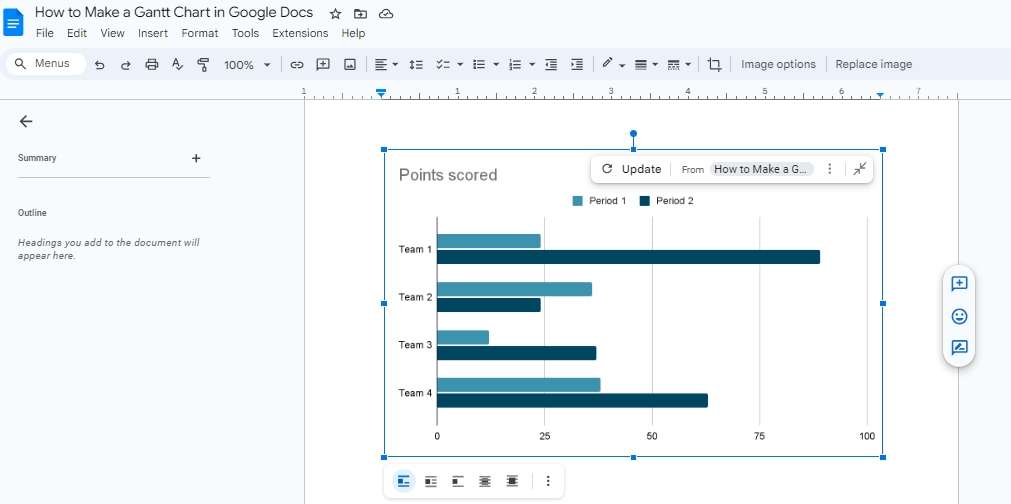
Once satisfied, go back to the Google Docs and click Update, and that’s it.
Step 4: Save the Template
Once the Gantt chart is ready, you can save the template for later use. Here is how you can do it.
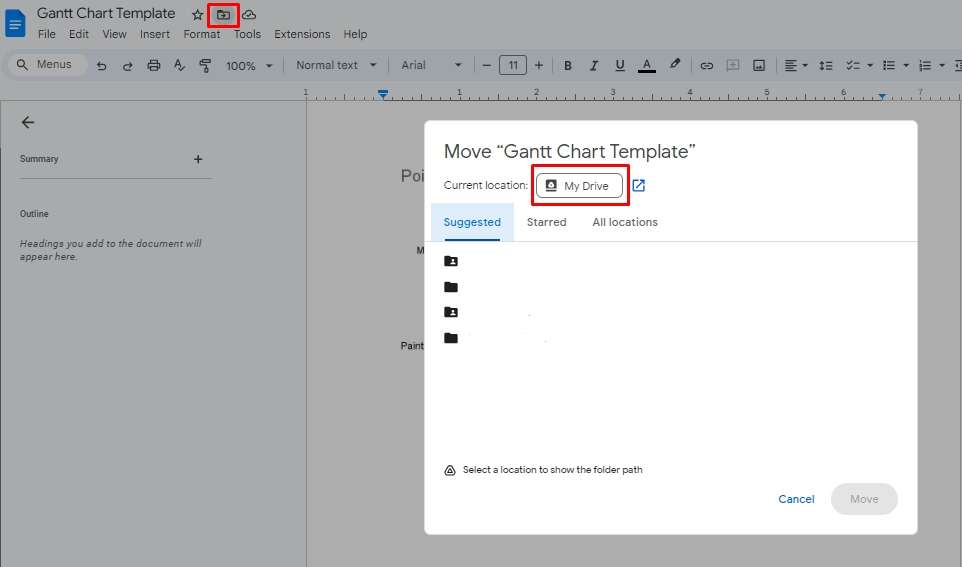
- Change the name of the document to Gantt Chart Template.
- Click the Drive icon beside the document name and choose a path. Click Move, and it will be saved in your drive.
A Dedicated Gantt Chart Maker Might Be Better
Google Docs undoubtedly comes in handy for creating Gantt charts for those familiar with the interface. However, it is a lot of work for one-time use as projects are changing daily, and rightfully so. Google Docs is a documentation tool so that diagramming will be hectic despite its chart functionality. The only way out is an intuitive project management tool like EdrawProj. It is a one-stop productivity software for big teams to collaborate.
EdrawProj: An All-in-One Project Management Tool
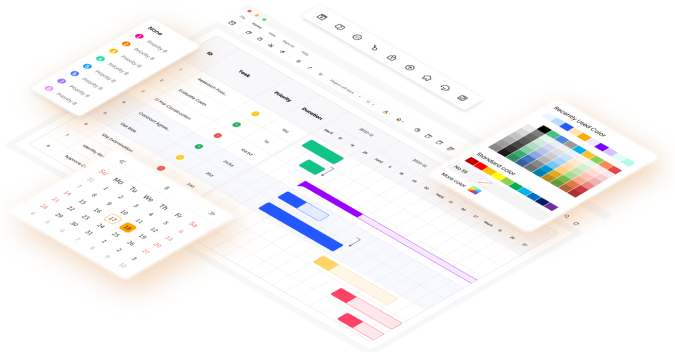
Wondershare EdrawProj is an advanced Gantt chart tool for seasoned managers and novices. Its intuitive UI and clean layout save time and effort in drafting presentations and visual documents. In addition, EdrawProj enables project managers to outline schedules, manage deadlines, allocate resources, and track progress. Here is what makes this project management tool better.
- Drag-and-drop functionality to prioritize tasks. With this, you can set dependencies, adjust task duration, and change the dates with a few clicks.
- Customizable color schemes differentiate the ongoing activities, completed tasks, and expected deliverables.
- A Gantt Chart Report function to visualize separate components of the chart. It gives you easily understandable valuable insights into the project’s critical points, task information, cost, and resources.
EdrawProj Vs. Google Docs: Which One is Better?
Now the question is, EdrawProj or Google Docs: which one is better? The only way to find out this is a side-by-side evaluation of both to understand which tool may be ideal for your skill set.
| Features | EdrawProj | Google Docs |
| Cross-Platform Support | Yes | No |
| Automated Task Management | Yes | No |
| Advanced Toolkit for Plotting and Updating Tasks/td> | Yes | No |
| User-Friendly Interface | Yes | Yes |
| Excel Data Import Function | Yes | No |
| Documentation/ Gantt Chart Report | Yes | Yes |
| Multi-Format Export Support | Yes | Yes |
How to Make a Gantt Chart in EdrawProj?
Making a Gantt chart in EdrawProj is straightforward and only takes a few minutes. Here is how you can save time and plot project timelines in minutes.
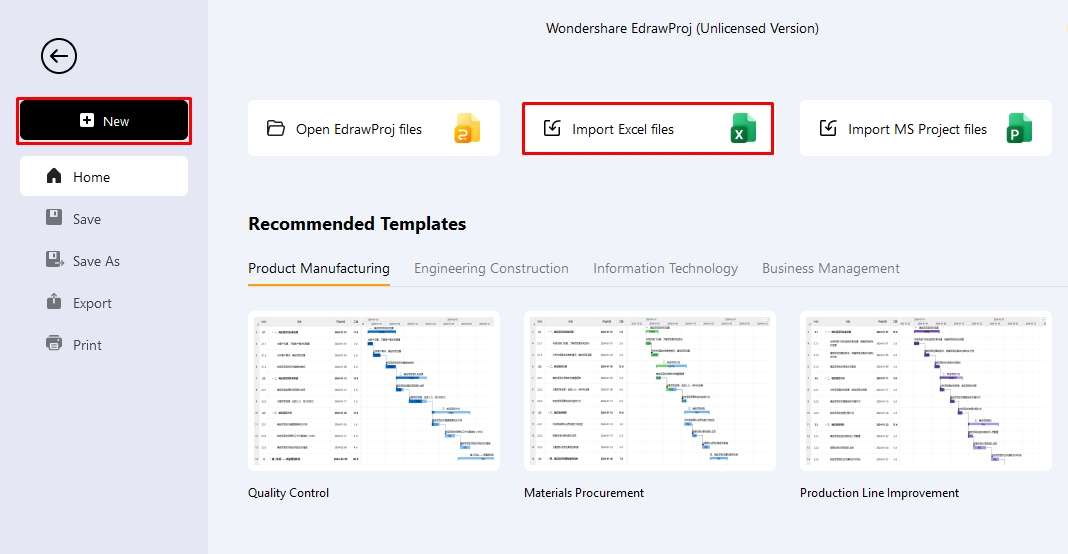
Step 1: Open the Editing Panel
Before plotting the chart, download the EdrawProj desktop version and log into your Wondershare account ID. You can also access it with your social media IDs (Google, Facebook, etc).
- Once launched, press New to enter the editing panel.
- Or click Import Excel Files if you already have the data available in an XLSL file.
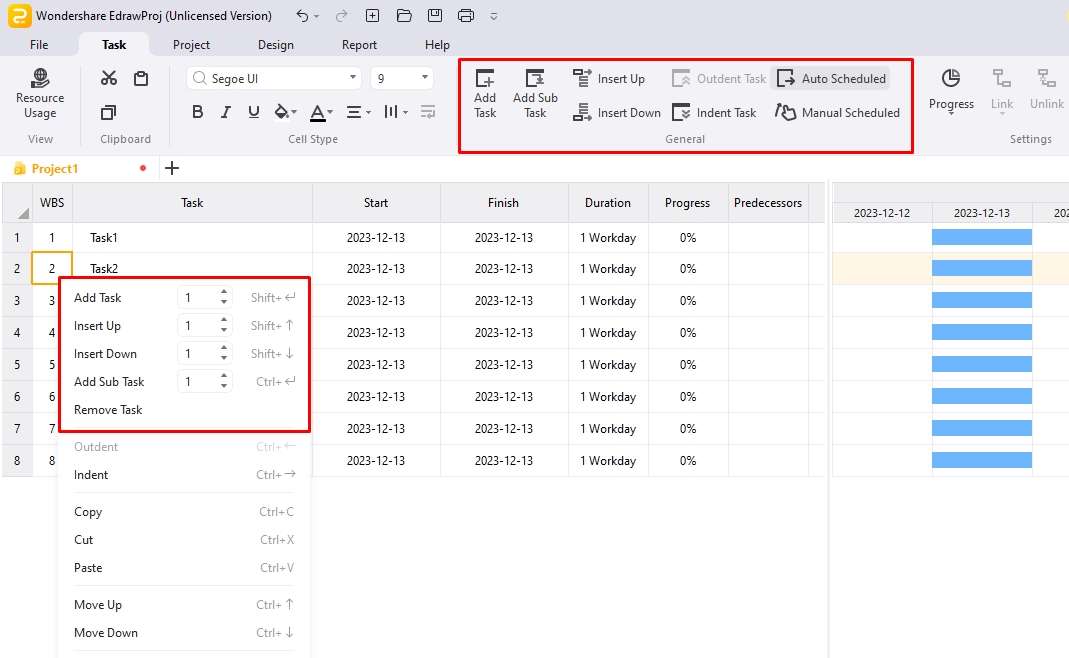
Step 2: Plot Tasks
Once on the editing panel, start adding tasks and subtasks.
● Add or Remove Tasks
Right-click any task, and a pop-up menu will appear. You can add, remove, and insert tasks and subtasks from here. You can also go to the Task tab on the top and manage tasks.
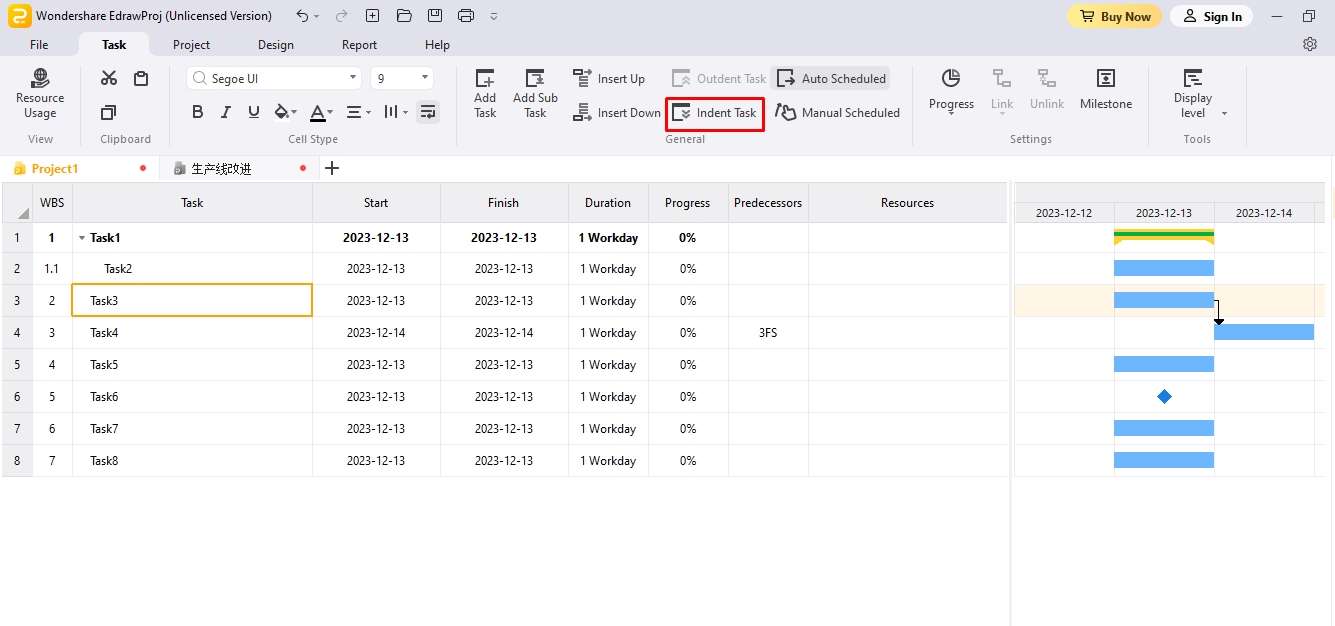
Indent/ Outdent Tasks
To add Indent, select any task, and go to the top-located Task Tab > Indent task, and vice versa.
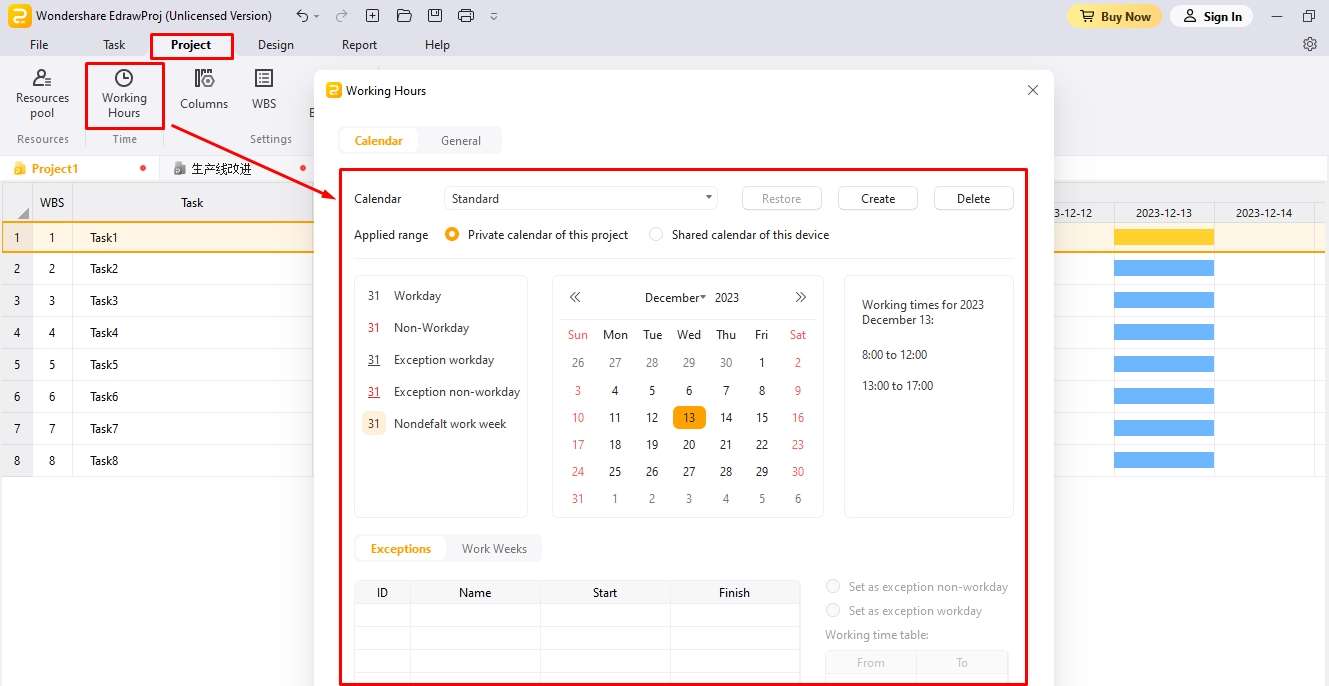
Adjust Time and Date
Adjust the time and date for all the tasks. Go to the Project tab on the top and click Working Hours. It allows modifying the format (date and time), duration, and setting deadlines.
Step 3: Personalize the Chart
Now, a basic outline of your Gantt chart is complete. The only thing left is adding project details.
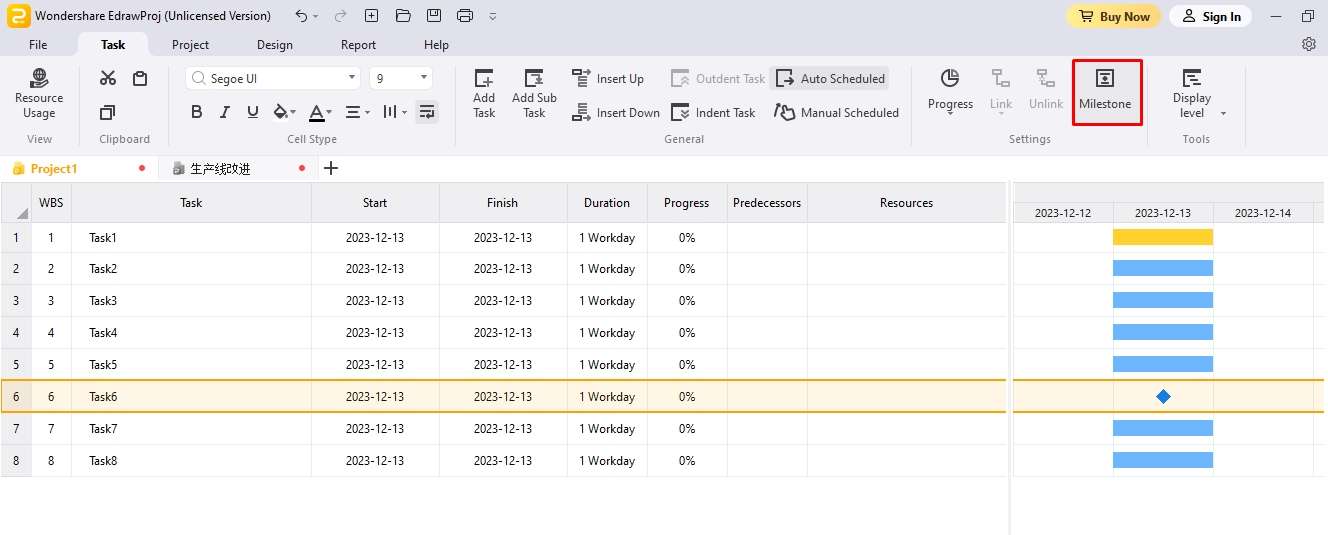
Add Milestone
To add milestones to your project timeline, select an activity, go to the Task tab at the top, and click Milestone.
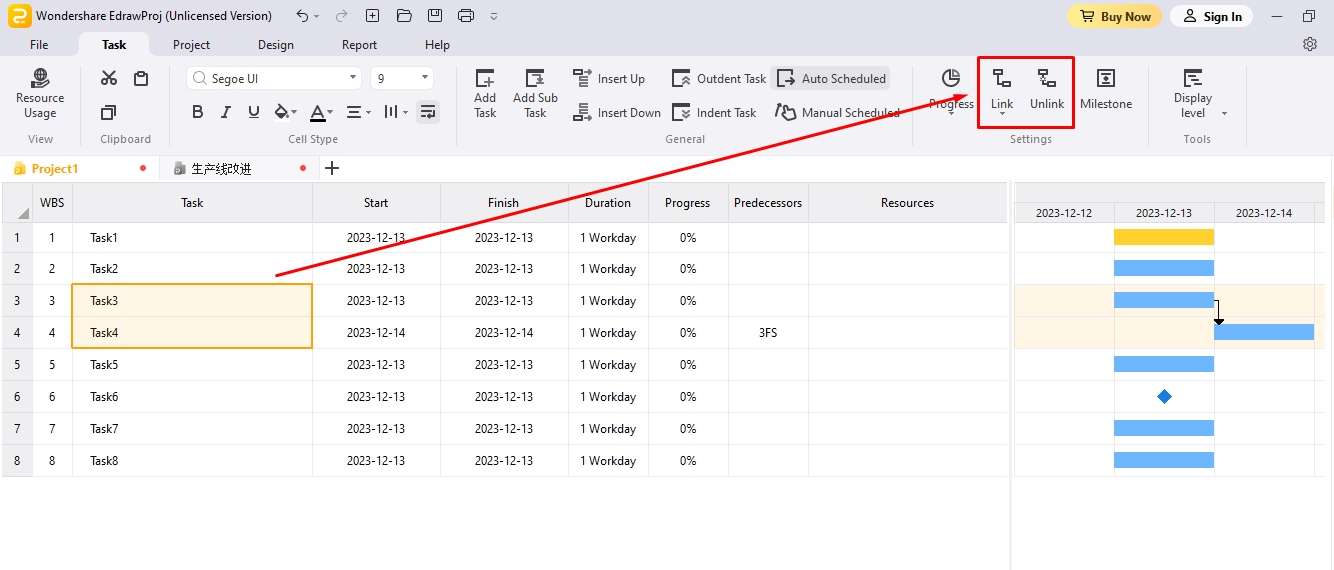
Link/ Unlink Tasks
You can also link and unlink tasks in EdrawProj. For this, select the two tasks you want to link, go to the Task tab at the top, and click Link. Do the same to unlink the two tasks.
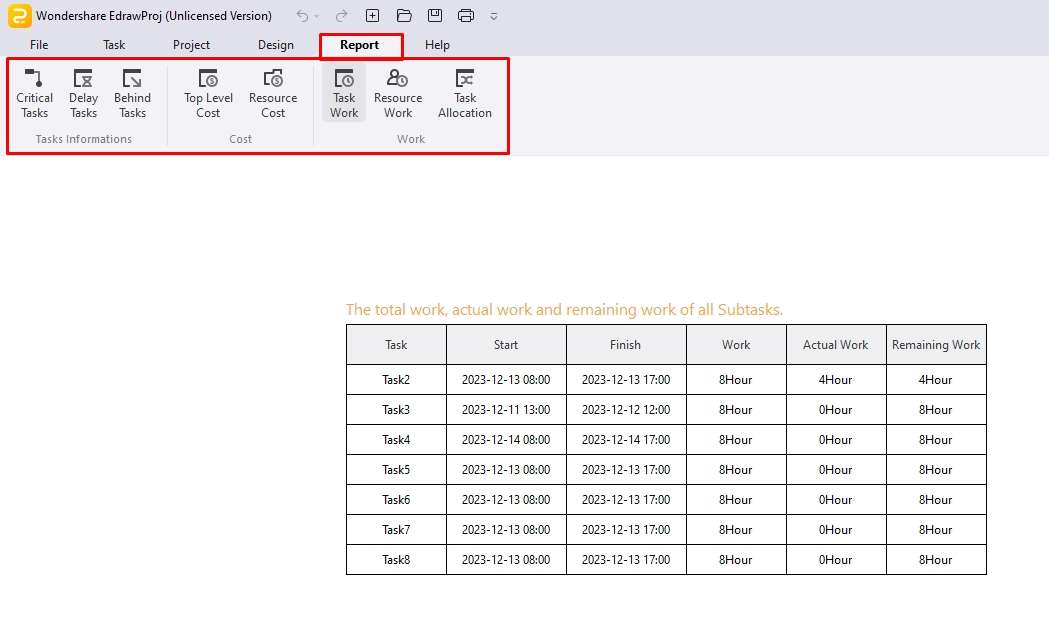
Step 4: Make a Report
You can also make reports of your Gantt chart in EdrawProj. Go to the Report tab at the top and click whatever you need specifically displayed on the screen.
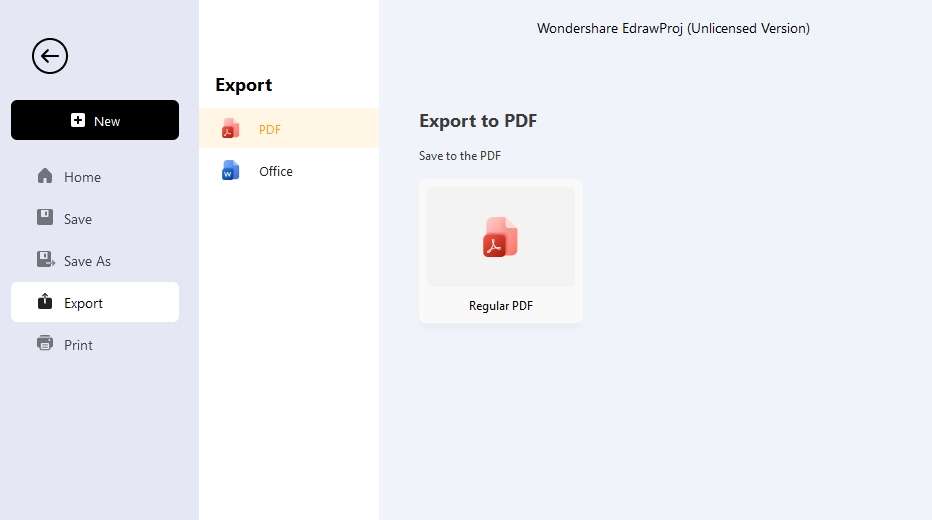
Step 5: Export the Chart
Finally, export your chart. Go to the File Menu on the top-right corner and click Export > PDF.
Tips for Making Gantt Charts
How to make effective Gantt charts on the canvas? Let us discuss some valuable tips to get the most out of a Gantt chart during project planning.
Use a Digital Canvas
Plotting a Gantt chart demands skills and resources. Ordinary software like Google Docs may not be your best bet against them. Thus, the wise way out is an advanced project management tool. It will help you visualize the most minor dependencies and logic between the activity sequencing.
Use a Calendar
A project timeline is about following up on dates and drafting lengthy schedules. Manually adding these dates would take forever. Therefore, calendars always come in handy. They help you display the days, weeks, and months to decide deadlines and breaks within the project.
Apply Colors
Gantt charts are already complicated for an average mind, and a bland bar chart with unlimited data can add to the difficulty. Using colors for bars, milestones, and resources to enhance each category is better. This way, viewers can grasp the information in a minute or two.
Add milestones
Ideally, a Gantt chart should have milestones. These events represent achievements in the project (deliverables, decision gates, etc). Adding them encourages the team to focus on the deliverables instead of getting daunted by the extensive tasks with a single destination.
Conclusion
Gantt charts on Google Docs are an excellent substitute for newbies stepping into professional life. The tool’s familiar interface gives you a clear sense of project planning. However, the manual formatting and lack of advanced tools to update your Gantt chart and build dependencies make it less practical for complicated projects.
This is where you might want to switch to advanced project management tools like EdrawProj. It is a powerful Gantt chart maker with an intuitive interface and advanced toolkits. It will help make schedules, manage resources, visualize critical paths, and follow up on budget. Just give it a shot, and you may like it for the ongoing projects.
A professional Gantt chart tool to plan, manage and track your projects, process and resources.

A Place for Project, Process, Resource Management