SIPOC - A Great Tool for Process Analysis in Six Sigma
What is SIPOC?
In six sigma, SIPOC is often used in the "Define" phase of DMAIC steps, as it helps clearly understand the purpose and the scope of a process. SIPOC shorts for suppliers, inputs, process, outputs and customers. As it is always completed by the sequence of process, outputs, customers, inputs, suppliers, sometimes it can also be known as POCIS diagram. The SIPOC is a vital component to a process map. With this tool, you build your first organized view of your work process and set the foundation for applying the breakthrough DMAIC strategy. A SIPOC structure helps the process owner and those working on the process to clarify the primary elements of a process and agree the boundaries of what they will be working on.
An Example - Catalogue Retailer Call Center SIPOC
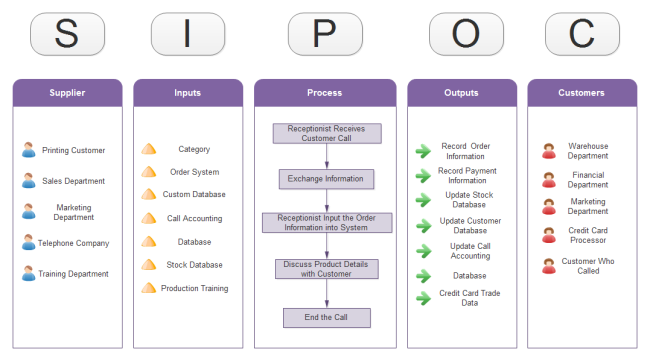
Here is an example of how a continuous improvement team uses a SIPOC diagram for a simple process. A catalogue retail company call center use this SIPOC diagram to define the scope of the process, including: the start and end of the process, the major steps, the primary inputs and outputs, and the key customers and suppliers. With this simple yet comprehensive picture at hand, every staff or member involved in this activity will have a deep and clear understanding of this process.
As it's a high-level picture, it won't include many details. The major steps on process part will be limited to less than 7. Usually a flowchart with arrow connectors showing the sequence can best present the steps. In this example, five steps are used to illustrate the main procedure.
Discover More Six Sigma Tools and Templates
Outputs are results the process produces, it can be the products, services, or information that are valuable to the customers. In this chart, obviously, outputs are mainly information and data.
Customers are recipients of the outputs. Every output should have at least one customer. It's beneficial to match the customer with outputs. For example, the stock database update output corresponds to warehouse department, and payment information update corresponds to financial department.
Once you have the process laid out and the inputs complete you can determine the suppliers and inputs. Where does the calls come from? We can see that the calls not only come from customers, but also come from inner company. For example, the sales department might call to check the stock data.
Importance of completing a SIPOC for Six Sigma
Completion of a SIPOC diagram is critical for the Six Sigma DMAIC process. Failure to complete a SIPOC diagram makes it much more challenging for the team when it decides what to measure and what must be measured in order to manage the project and achieve success.
How to Draw SIPOC Diagram
The diagram can be created quickly by drawing a chart with five columns. Each column is labeled, from left to right, with the letters SIPOC or the words suppliers, inputs, processes, outputs and customers. In the process column, you can use a simple flowchart to show the primary steps. Start Edraw SIPOC software, and you can finish these drawing steps in just a few minutes.
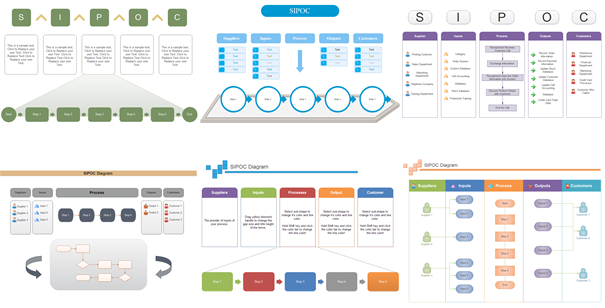
One of the easiest methods for making SIPOC diagram is using ready-made templates. There are plenty of high-quality templates available in Edraw for creating great SIPOC diagrams. All templates are well pre-designed and with automatic functions, easy to customize and reuse. The following methods you can try:
- To apply a ready-made template, please click Different Templates for Diversified SIPOC Design, or discover more templates on the Templates page, Flowchart category, Process section.
- To design a SIPOC chart on your own, simply open the List and Process library in Edraw, and make a SIPOC diagram instantly from a large collection of pre-made shapes.
- Or you can use a cross-functional flowchart to represent your SIPOC diagram. Click Draw SIPOC Diagram from Swimlane Flowchart for more information.
More Six Sigma Tools in Edraw
Edraw is an all-in-one visualization software containing various of diagram types that you can think of. Besides SIPOC diagram, Edraw also provides solutions for Cause-Effect Diagram, Value Stream Mapping, Brainstorming, QFD, Affinity Diagram, Scatter Plot, RACI matrix, PDCA cycle, and much more to help finish your six sigma. Among the best diagramming tools available, this software is perfect for experienced diagram designers or those who are just getting started.Available SIPOC Templates
Download a free trial and see first-hand how quickly and easily you can create effective great-looking SIPOC diagrams.
More Resources
Impact Effort Matrix Templates Free Download
Pareto Chart - A Six Sigma Tool for Measuring Process Performance


