Compare and Contrast Graphic Organizer Complete Guide
Edraw Content Team
Do You Want to Make Your Compare and Contrast Graphic Ogranizer?
EdrawMax specializes in diagramming and visualizing. Learn from this compare and contrast graphic organizer complete guide to know everything about compare and contrast graphic organizer. Just try it free now!
The art of comparing and contrasting is required in almost all sectors of daily life. Doesn't matter if you are a student or an individual working in a professional environment; you may need to compare and contrast different people or ideas. It is indeed a tough nut to crack. To deal with these challenges, the mathematicians introduced compare and contrast graphic organizers.
Venn diagrams are the most famous graphic organizers. They were introduced for the first time by John Venn in 1880. These compare and contrast diagrams have proved to be pretty useful for learners of all ages. One thing that makes "compare and contrast graphic organizers" stand out is that they are very easy to customize for any content you want.
Are you looking for a credible source to gather information covering what precisely a compare and contrast graphic organizer is, what types it is available in, and how to create it within a few minutes? This is a perfect read for you. Let's get deeper into the discussion.
1. What is the Compare and Contrast Graphic Organizer
A compare and contrast graphic organizer helps you utilize your study to compare and contrast two or more ideas, perspectives, events, policies, and people. Depending on your requirements, you can use this organizer in different ways, as listed below.
- Compare and contrast two huge ideas like constitutional democracy and direct democracy.
- Compare and contrast the characteristics of two well-known personalities.
- Compare and contrast the impact of two policies or events.
There are numerous methods for comparing and contrasting the characteristics of objects, individuals, events, and so on. Many different types of graphic organizers make examining these similarities and differences much easier.
- Compare - to evaluate (two or more objects, thoughts, persons, or other things) in order to find similarities and differences. For instance, to compare two literary works.
- Contrast - demonstrate unlikeness or differences; note the opposite natures, purposes, etc. For instance, compare and contrast the political rights of Romans and Greeks.
A compare and contrast graphic organizer helps you utilize your study to compare and contrast two or more ideas, perspectives, events, policies, and people.
2. Types of Compare and Contrast Graphic Organizer
Graphic organizers come in a variety of types. The suitable one depends on the task at hand. Some common formats include Tree, Cloud/Cluster, Flow Chart, Sequence Chart, Maps, Graphs, T Chart, Story Maps, Venn diagrams, and many more. Let's explore some commonly used types of compare and contrast graphic organizers.
- Venn Diagrams
- T Chart
- Graphs
- Tree Diagrams
A Venn Diagram is a graphic organizer composed of two or three circles that overlap. Venn diagrams play a key role when you need to compare and contrast two or more concepts. These diagrams are generally used to compare similar ideas to determine what makes them similar and different from each other. The Venn diagram shown below displays the comparison and contrast of three different concepts. John Venn, an English mathematician, invented these in 1880.
The best thing about the use of A T Charts is that you can create them within a few minutes, and it efficiently compares and contrasts two ideas. To create a T Chart, all you need is to draw one vertical and one horizontal line. The horizontal line intersects the vertical line from the top (this is how it becomes t-shaped) and divides it into two equal parts, as shown below.
The graphs are perfect for comparing and contrasting graphic organizers when you need to visualize and evaluate the numerical data of two or more concepts or ideas. They are equally good to use for non-numerical problems. The below picture shows how graphs look alike.
Tree diagrams break or divide the main concepts into multiple mini ideas to better understand the whole scenario. It supports a hierarchical organization. Both tree diagrams and flowcharts are pretty similar to each other. These diagrams show how every step or phase of the project or idea is connected to each other. The below picture shows a tree diagram. The box placed at the top is the main idea, and other boxes show the broken parts of the main idea.
3. Benefits of Compare and Contrast Graphic Organizer
Teachers and students use graphic organizers for a variety of reasons. Graphic organizers are useful teaching tools that make studying more interesting and productive by demonstrating relationships, visualizing and simplifying concepts, and organizing knowledge. A few of its benefits are stated below.
- Indicate Relationship
- Clarify Concepts
- Analyze the data
Graphic organizers help students imagine the relationships between various parts by using colorful shapes, icons, and connectors. Venn diagrams, for example, help students see and understand the similarities and differences between objects.
Graphic organizers may also simplify complex concepts by visualizing them, as an image is worth a thousand words. Ideas that can be seen are easier to comprehend, particularly for the learning process.
It is difficult for the brain to interpret and process a vast volume of information. The details can be logically organized using the graphic organizer. For instance, charts can help remember the difference between two objects, places, persons, etc.
4. How to Make a Compare and Contrast Graphic Organizer in EdrawMax
Worried about creating a compare and contrast graphic organizer tailored to your needs? EdrawMax is here to reduce your headache. Give it a try, and you will be amazed to see the features it offers.
Step1 Download, Install and Launch EdrawMax
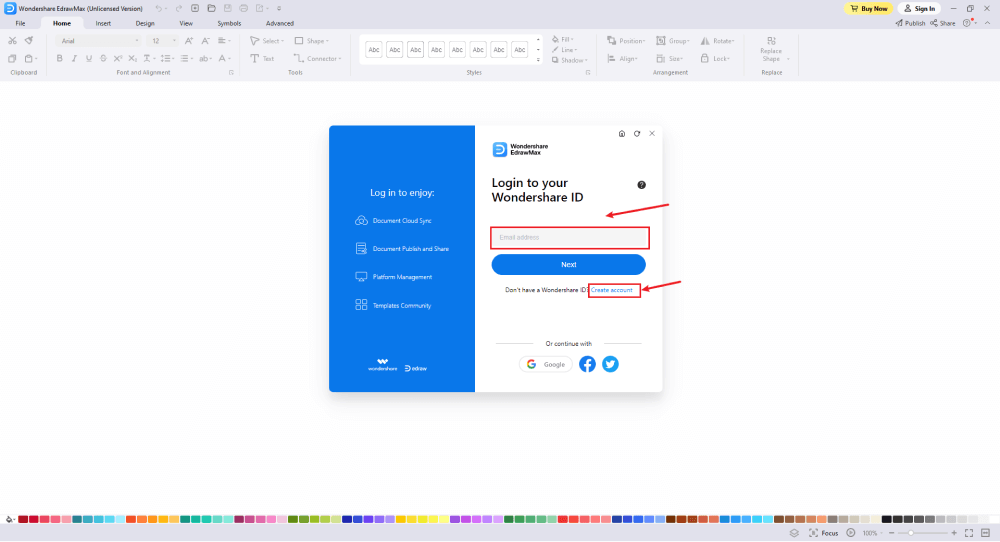
Start with downloading and installing EdrawMax on your PC or laptop. It will take a few minutes only. Launch the software and hit the "Sign In" button as soon as you install it. If this is the first time you are installing this tool, click on the "Create Account" to create a new EdrawMax account. Now, provide the desired information and press the "Create Account" button. If you already have an account, you can simply log in to EdrawMax by putting your registered email and password.
Step2 Choose a Built-In Template
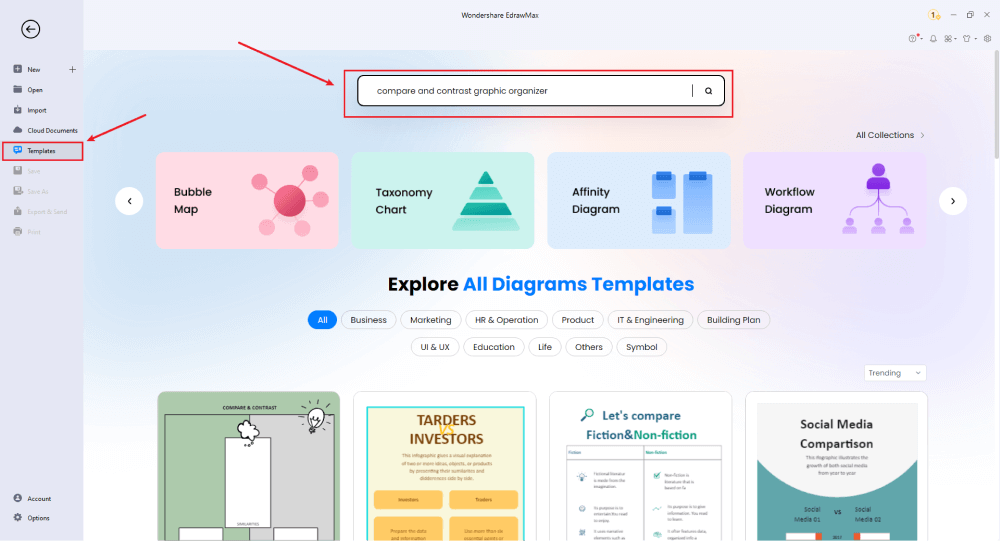
The availability of editable templates makes it easy for you to deal with complex problems. To find the desired templates, all you need is to click on the "Templates". You will find it in the left menu bar, as shown below. Now, type "compare and contrast graphic organizer" in the search bar, and you will see a couple of templates over there. Select the one that suits your needs the best and go ahead.
Step3 Making Graphic Organizer from Scratch
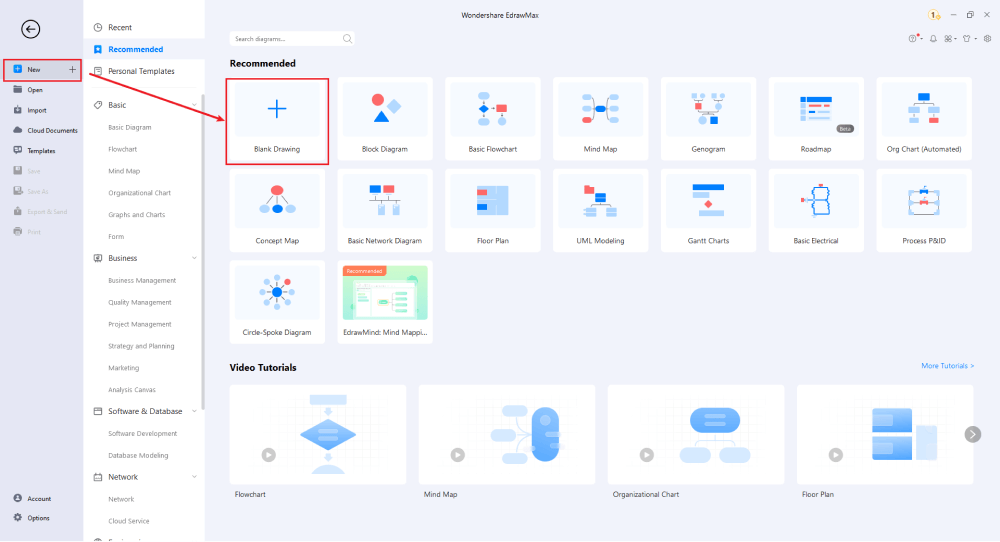
Don't you feel comfortable with using the built-in templates? No worries! EdrawMax provides you with an opportunity to create your compare and contrast graphic organizers from scratch. Tap on the "New" option from the left menu and press the button "Blank Drawing", as shown below. Once done, you will see a new window on your system's screen. There, you can draw any type of graphic organizer like a Venn diagram, T Chart, Graphs, Maps, etc.
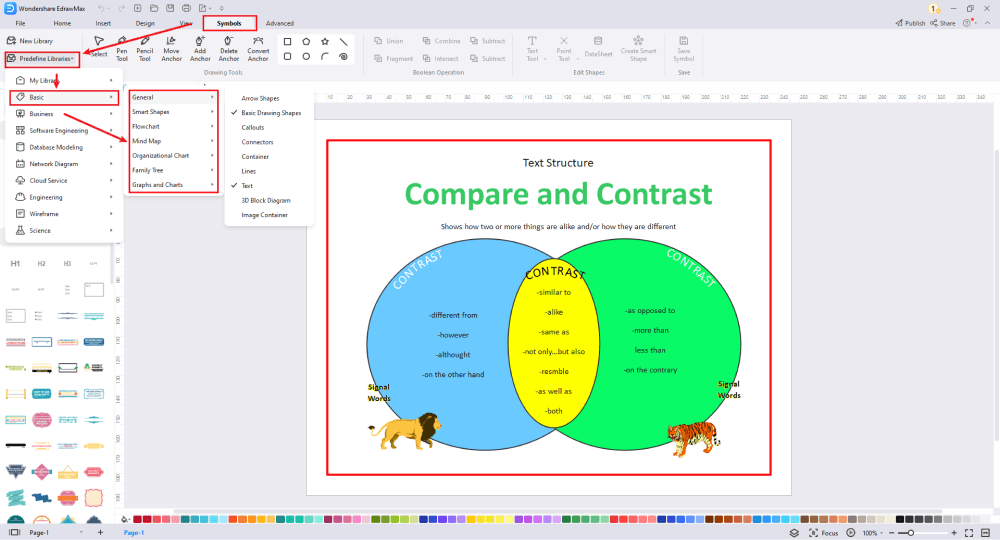
Step4 Select the Symbols
A wide variety of symbols and basic drawing shapes are available to make graphic organizers. Let's use the "circle" symbol and draw a Venn diagram. Tap on the "Symbol" menu from the top and click on the "circle". Now, draw three circles in a way that they slightly overlap each other, as displayed below. Once you are done with making your graphic organizer and want to change its position on your screen slightly, hit the "Select" option, click on the graphic organizer, and move it to any position you want.
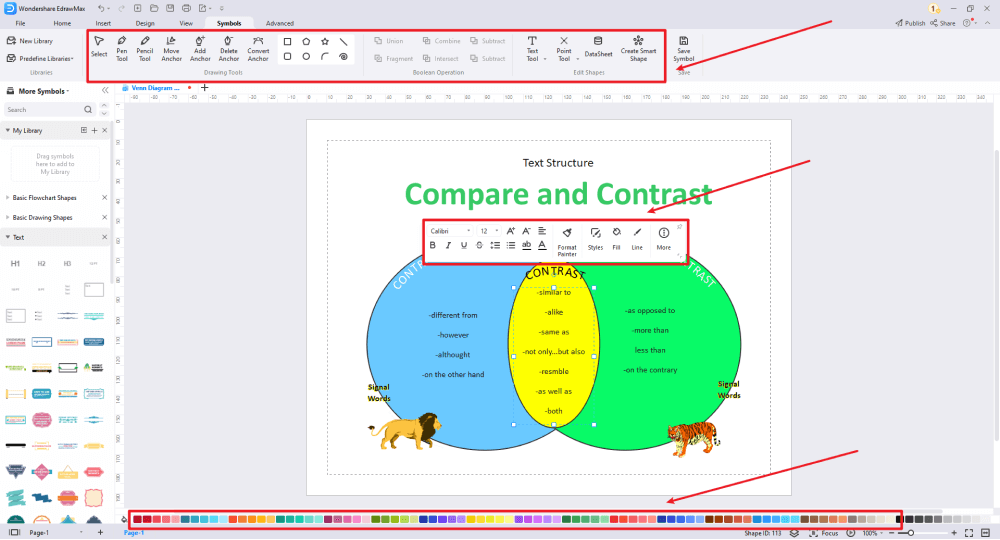
Step5 Customize Your Graphic Organizer
Customization makes the whole idea easy to understand. EdrawMax offers different components to create a graphic organizer. Adding labels, engaging colors, and specific instructions to your drawing adds extra value to it. The below picture presents a Venn diagram that shows similarities and differences between three concepts (displayed with the three circles). The overlapped region shows similarities, whereas the remaining part of the circles displays key differences.
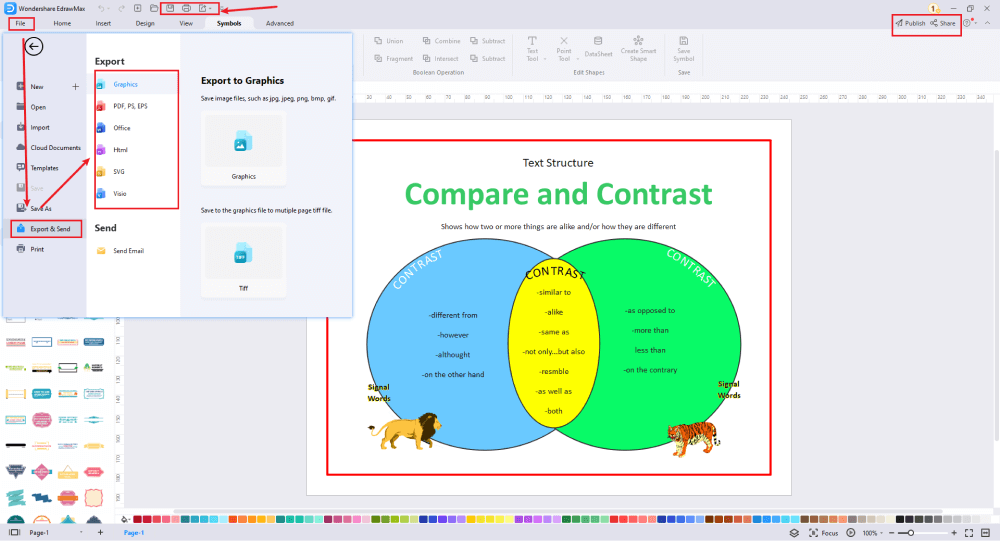
Step6 Export the Final Compare and Contrast Graphic Organizer
Is your compare and contrast graphic organizer designed? Great! Now, you can export it to any format you want. The most commonly used file formats available in EdrawMax are; Microsoft PowerPoint, Word, Excel, HTML, Graphics, SVG, and PDF. Go to the top menu and click on the "File" option. Now, tap on "Export & Send" and choose any file format to export the final drawing.
Tips & Considerations
While creating a compare and contrast graphic organizer in EdrawMax, don't forget to conduct detailed research to understand what the topic demands and what is better to include. Try inserting pictures to make the drawing more appealing. You can introduce a color coding scheme to improve the overall learning experience. Utilize different components like pen, shape formatting, and connectors.
Basically, it is simple to create a graphic organizer in EdrawMax, just grab a template and keep customizing, drag and drop professinal symbols to make your plan better. If you are still confusing about how to create a graphic organizer in EdrawMax, just check this graphic organizer guide, or check the video below. Or you can find more tutorial videos from our Youtube.
5. Free Compare and Contrast Graphic Organizer Examples & Templates
There are 7 examples of graphic organizer that you can refer or use immediately. Just click the image to download EdrawMax , and download the templates accordingly. Then double click to open the templates and customize as your prefer. Or open the templates from EdrawMax Online, and duplicate the templates. Click this graphic organizer examples to get more inspirations.
Example 1: Venn Chart
Above is an example of a Venn diagram template available at EdrawMax. A Venn diagram is a diagram that uses circles to depict relationships between objects or finite groups of objects. You can make use of this template to compare and contrast the similarities and differences of two or more objects, ideas, concepts, products, places, etc.
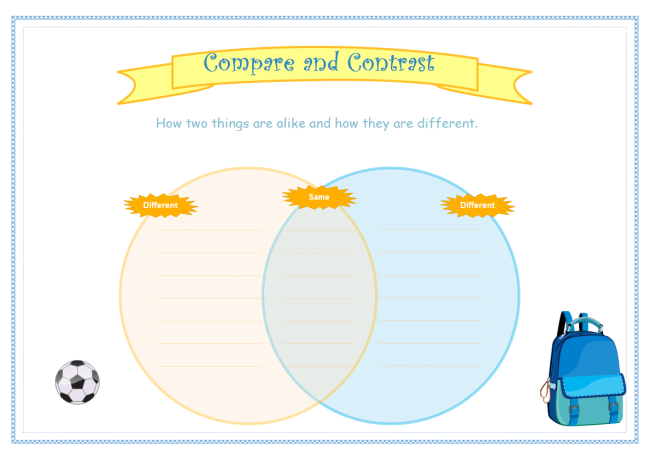
Example 2: Compare and Contrast Worksheet
This compare and contrast worksheet is simple but very useful. You can print it out and let students fill in the blank areas when you teach them to differentiate two concepts or items. If you want to change the number of text boxes in the "different" part, you can download the EDDX file of the template and edit it in EdrawMax.
Example 3: Compare and Contrast with Topics
This cute comparison and contrast diagram template is great to be used in PPT presentations and worksheets. It will make students' homework interesting and enjoyable. Come and click the picture to download the PDF or EDDX file.
Example 4: Compare and Contrast Chart for Students
This compare and contrast chart is designed to help your students with better analyzing of the similarities and differences between two concepts. Download it now and save tons of time from creating similar graphic organizers.
Example 5: Comparing and Contrasting Rain & Snow
The graphic organizer has made it super easy for researchers and scientists to compare and contrast complex topics like snow and rain conveniently. The figure below presents a detailed analysis of the differences and similarities between snow and rain and helps students creatively understand the overall scenario. As far as the learning process is concerned, the colorful visuals and graphics make it more appealing and engaging.
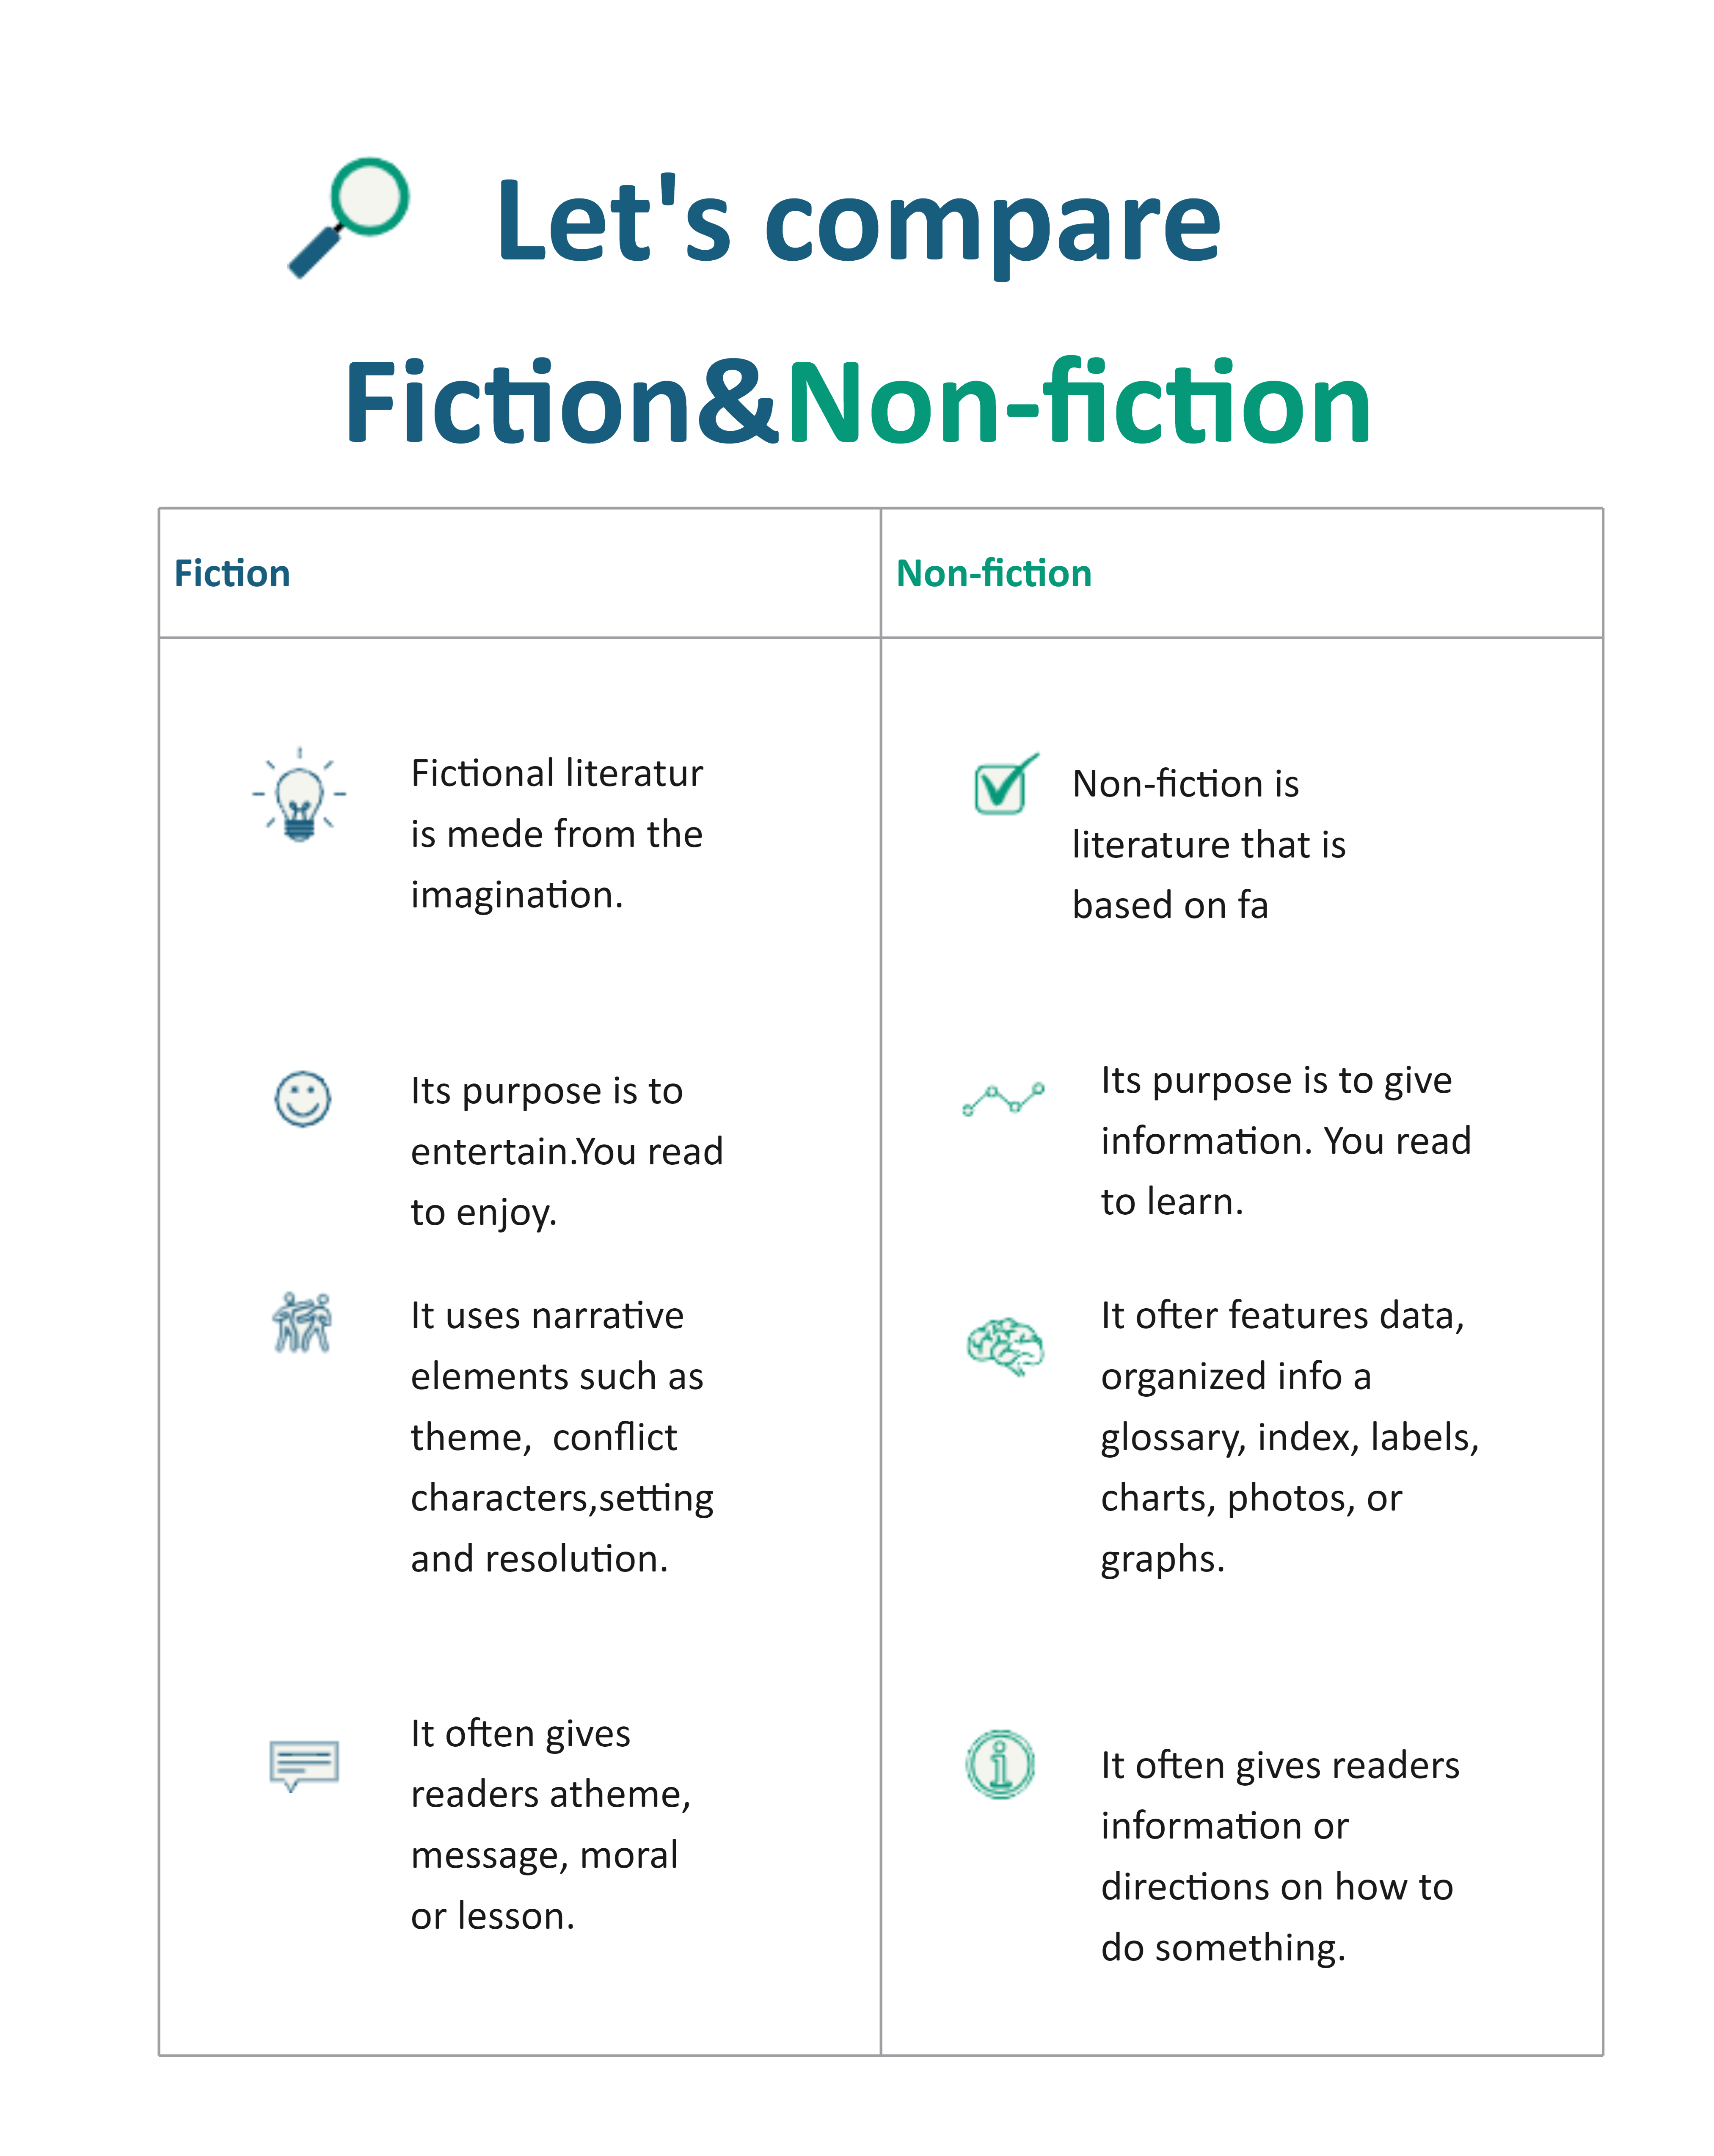
Example 6: Compare and Contrast Two Ideas (Fiction vs. Nonfiction)
The T Chart below compares and contrasts the two big ideas, i.e., fiction and nonfiction. The different traits are listed in tabular form to better understand how these two concepts are different and similar to each other. The traits compared in the table are; how literature is made, what is its purpose, what is it used for, and what it offers.
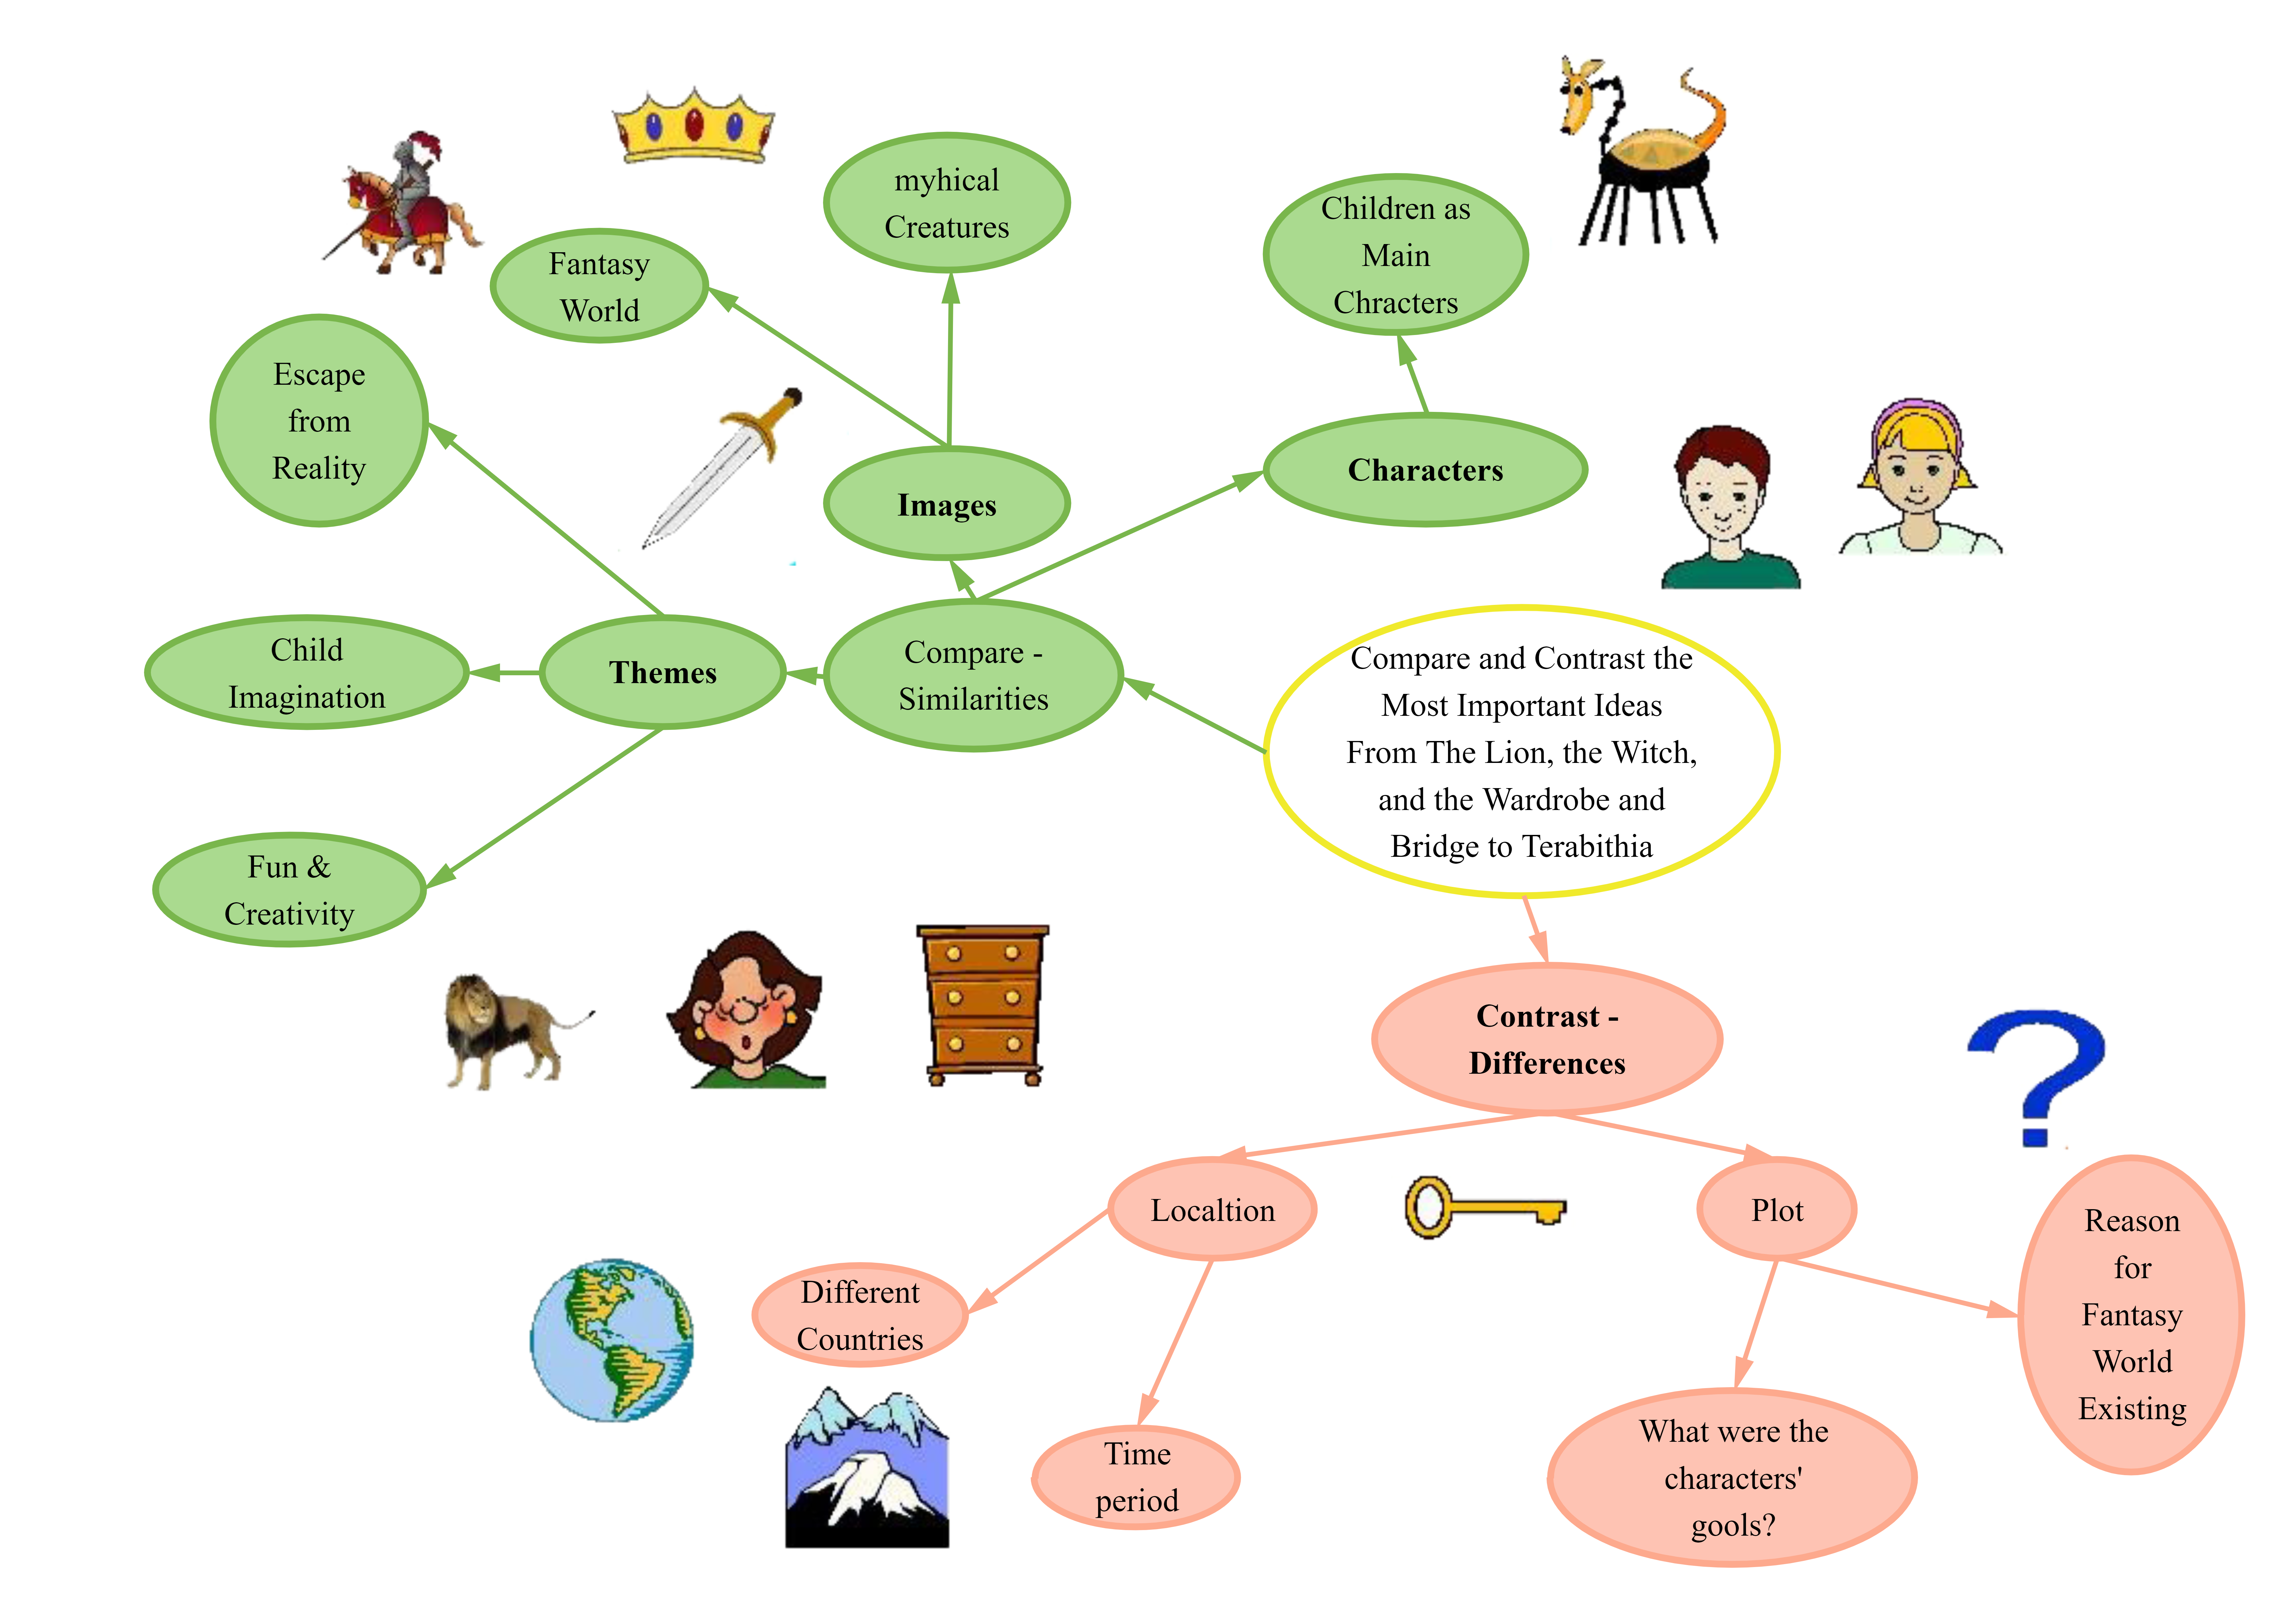
Example 7: Compare and Contrast Students' Ideas
This example is all about understanding the similarities and differences between two different student ideas. A double bubble map is drawn to understand the whole concept easily. This map is used for a variety of purposes, e.g., comparing and contrasting two or more artifacts, places, persons, ideas, and events.
6. Free Compare and Contrast Graphic Organizer Software
Are you on the hunt for a versatile tool to create graphic organizers according to your requirements? Worried about the pricing factor? Look no further! EdrawMax is a trusted software that helps you create engaging graphic organizers for free. The best part of using this diagramming tool is that you can make editable graphic organizers and mold them for any content or idea. The world's top-rated brands have recognized EdrawMax and have been using this tool for many years.
EdrawMax promotes independent learning with the help of engaging visuals and graphics. It helps you solve complex problems by visualizing your target goals. If you run a team of professionals, you can use this diagramming tool to make a timeline and assign work to every member of the team. Some great features of EdrawMax are:
- A huge number of customizable templates
- Complete diagramming power
- Customized shapes and fonts
- File backup and encryption
- Supports popular file formats (e.g., graphics, PDF, Excel, HTML, Word, PowerPoint, SVG) to export the final drawing
The most appealing factor associated with EdrawMax is that it is trusted by more than 25 million users around the globe.
7. Final Thoughts
Do you often need to compare and contrast two or more concepts, policies, or people? Find it difficult to do this all manually? Looking for a helping hand to assist you in this regard? This is where a compare and contrast graphic organizer comes in. It is available in different types, e.g., graphs, maps, tree diagrams, flow charts, Venn diagrams, and the list goes on.
Every type of compare and contrast graphic organizer has its unique functions, and you can choose any of them keeping in mind your requirements. Do you want to create a graphic organizer on your own? Look no further than EdrawMax. It is a reliable and trusted software that not only helps you make a compare and contrast graphic organizer, but you can also create any other drawing you want.

Graphic Organizer Complete Guide
Check this complete guide to know everything about graphic organizer, like graphic organizer types, and how to make a graphic organizer.
You May Also Like
Dichotomous Keys Complete Guide
Knowledge
Conceptual Framework Complete Guide
Knowledge
GCP Architecture Diagram Complete Guide
Knowledge
AWS Architecture Diagram Complete Guide
Knowledge
Rack Diagram Complete Guide
Knowledge


