Construction Gantt Chart - Key Points You Should Know
- Part 1: What is a Construction Gantt Chart?
- Part 2: Why Use Construction Gantt Charts?
- Part 3: Main Types of Construction Management
- Part 4: Construction Gantt Chart Software Recommendation
- Part 5: General Construction Process
- Part 6: How to Estimate Construction Project Cost?
- Part 7: How to Create a Construction Gantt Chart?
Part 1: What is a Construction Gantt Chart?
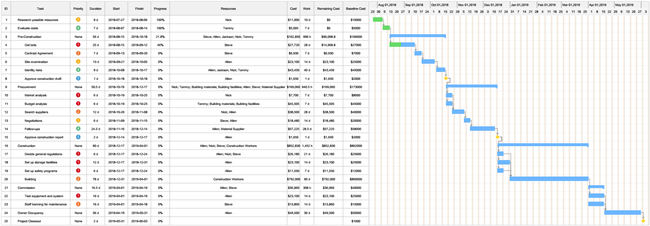
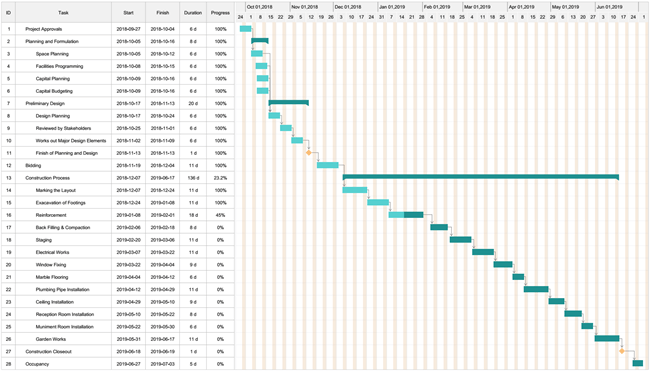
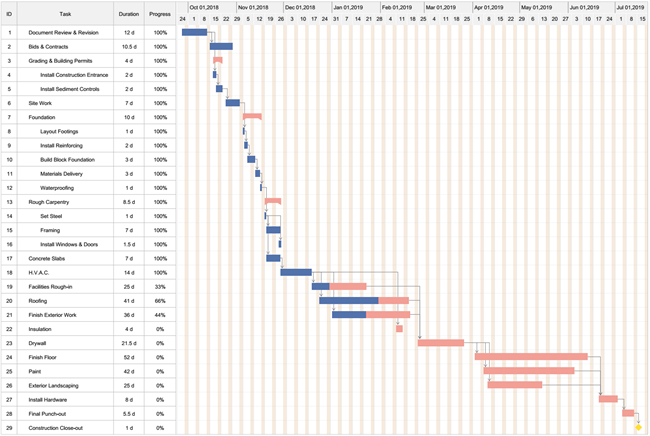
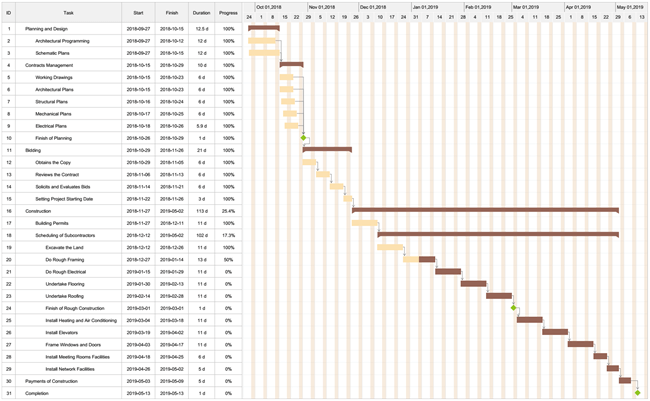
Construction Gantt charts show a clear visual colored-bar based presentation of a number of breakdown individual tasks within a time period. The horizontal axis shows the time sequence while the vertical axis lists all the tasks need to be completed.
Project managers can use construction Gantt charts to adjust tasks relationships, manage task period, update progress, insert milestones, assign resources and generate cost reports etc. You can click on the general construction Gantt chart example below for more details.
Construction management is a type of professional service that integrates with advanced project management theories and models to plan, design, and construct a building. Normally, construction management includes the control of project period, budget, safety record, construction inspection, risk management, and quality assurance etc. So far, construction projects have been used in building many places such as airports, schools, hospitals, governmental halls and so on.
Part 2: Why Use Construction Gantt Charts?
Time and task management are always vital in construction management projects, and Construction Gantt Charts are great for managing various kinds of task relationships.
For example, the task sequence, the priority level of each task, the dependency of tasks, the completion time of tasks, the duration of every single task and more. In this case, a construction Gantt chart offers a great network based on a logical progression toward a final success of a project.
Edraw Project: a professional interactive Gantt chart tool
- Visualize how projects evolve over time
- Schedule, mange, and track your projects in real-time
- Provide various Gantt chart templates and easy-to-use
- Easy to estimate project costs and manage budgets
- Compatible with MS office files (e.g. Microsoft Project)
- Collaborate with team members effortlessly
Part 3: Main Types of Construction Management
Public and Civil Government Building Construction
This mainly refers to agricultural facilities, economical buildings, public water supply channels, governmental buildings, educational institutions, hospitals, military halls, museums, transportation infrastructure facilities, manufacturing plants, seaports and more.
Residential Construction
This type is what we see and use every day, for example, our home buildings, houses, apartments and so on.
Commercial Building Construction
This is for the uses of commerce, business, trade and services, which includes shopping malls, private banks, international hotels, office buildings and more.
Part 4: Construction Gantt Chart Software
Generating simple, manageable, shareable and flexible Gantt charts for many industries and fields is exactly what EdrawProj can do for you.
The easy and intuitive user interface makes it quick for the beginner to get started on creating visually appealing Gantt charts in just minutes. The software also has advanced project management capabilities such as cost reporting and monitoring. Get started with EdrawProj right now by clicking on the Free Download button at the end of this page.
![]()
Part 5: General Construction Proces
A typical construction project should be based on the following steps to create your construction Gantt chart:
Pre-Construction
This section normally involves the project approvals; planning and formulation of existing facilities, capitals, schedules, scope and budgets etc; the design process of major components of the project; and the bidding process of the construction project.
Construction Process
The process is the most important part of an overall project. A project manager or team leader manages the implementation of the project according to the Contract Documents. Some other key issues and activities include the budget management, the regular meetings between parties, the follow-up notifications of all the key project milestones, the shutdowns of certain utilities, the clearance of chemical materials and so on.
Project Close-Out
In theory, this is usually the final step of a construction project when the constructor has done all remaining items and have completed all final invoice of the project. However, in reality, the customer may often review the construction Gantt chart with the team leader to check the whole project for unfinished items.
Part 6: How to Estimate Construction Project Cost?
The way you calculate your construction project cost and budget greatly influence the finishing date and profitability of your project. For a quicker and accurate result, you should do the following:
Step 1: Develop your own database of costs and pricing based on the resources of your subcontractors according to specific task scopes;
Step 2: Calculate based on the unit price for a certain period of time; for example, the weekly or monthly price times the given time schedule (without overlapped tasks). This method also works for multiple tasks or teams. However, don't calculate every piece of equipment or every hour of working labor to avoid inefficiency.
Step 3: Consider potential influencing factors such as complex site conditions, delays in specific tasks and other difficulties that we may face during a construction project. In this case, try to put an estimated increase in percentages on your original cost or budget.
Step 4: Regularly check and compare your data in the construction Gantt chart weekly, monthly or quarterly, and make adjustments if necessary.
Part 7: How to Create a Construction Gantt Chart?
Before creating a construction Gantt chart, we need to download a Gantt chart tool.
Here are the basic steps for you to quickly create a general and simple construction Gantt chart:
Step 1: List and break down all the phases of your project, then adding individual corresponding tasks; or set a task as a milestone.
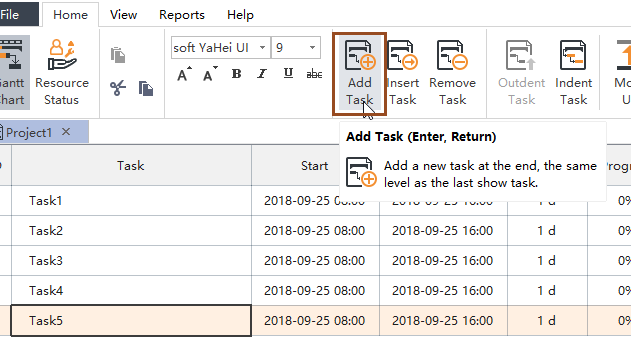
Step 2: Rename your individual task.

Step 3: Set task starting and finishing date/hours, choose working days, time unit, date format and more; Now you will find the duration column for each task has been calculated automatically.
![]()
Step 4: Set task relationships by indenting/outdenting separate tasks, or building sequence links between two tasks; You can also determine task priorities by simply inserting colorful numbering labels.
![]()
Step 5: Manage your project resources by defining resources name, unit, type, standard rate, overtime rate, group No., member e-mail, and additional remarks etc. Now you can update the progress bar to track your project.
![]()
Step 6: If you wanna try a different taste of construction Gantt chart theme, then simply using the auto tool to switch between built-in themes.
![]()
Step 7: Print or export your construction Gantt chart to PDF or Excel format for your team members, external partners and stakeholders.

Related Resources:
Top 6 Gantt Chart Skills You Should Know for Your Next Project
