The Easy Guide to Process Mapping

Today, we will talk about a very useful planning and management technique, process mapping.
What is Process Mapping?
A process map is a simple tool for planning and management that visually presents the flow of work. Process mapping allows you to identify value-added and non-value-added activities within a process or system to determine where you need to improve.
Thus, in simple words, a process map shows a series of events that produce an outcome. A Process map is also commonly known as flow chart, process chart, process flow chart, functional process chart, functional flowchart, workflow diagram, process model, process flow diagram, and business flow diagram.
The purpose of process mapping is to improve efficiency and get an insight into a process. It identifies repetition, bottlenecks, and delays. Process maps are commonly used for:
- Simplifying and understanding a process.
- Identifying process ownership responsibilities and metrics.
- Analyzing how a process can be improved.
- Showing others how to do a process.
- Improving communications between different individuals engaged in a process.
- Providing process documentation.
Types and Examples of Process Mapping
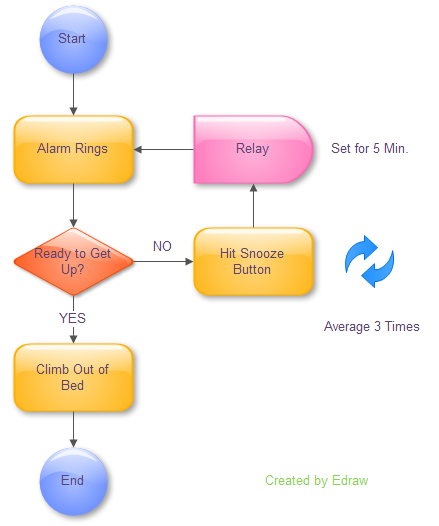
1. Flowchart
A flowchart is a basic map visualizing different steps of a process, including inputs and outputs.
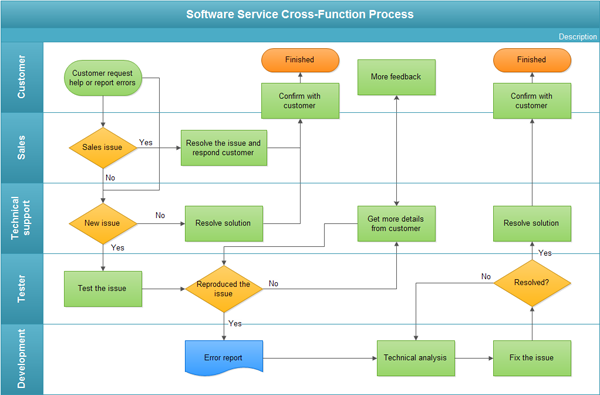
2. Swimlane Diagram
A swimlane diagram is also called a cross-functional map. It differentiates between the subprocess responsibilities and shows the relationship between each process step and the functional unit.
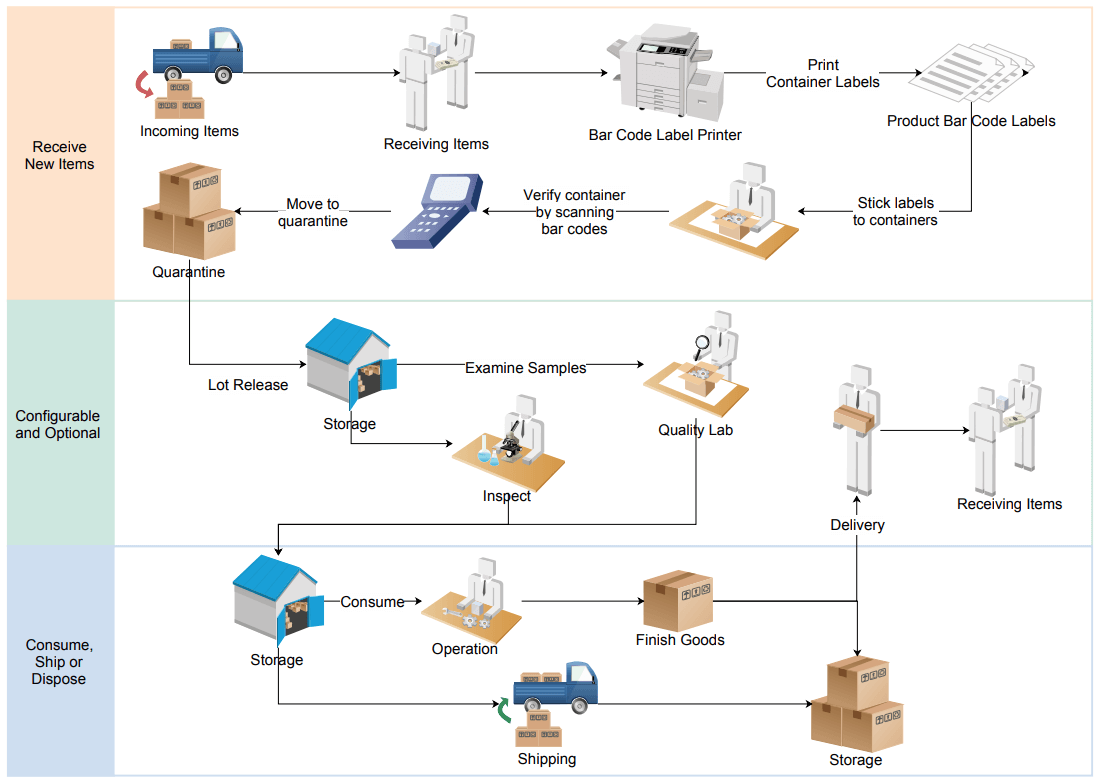
3. Workflow Diagram
The workflow diagram shows the process in the “flow” format and does not use any UML symbols. It describes the steps needed to complete a process and points out the responsibilities of each step.
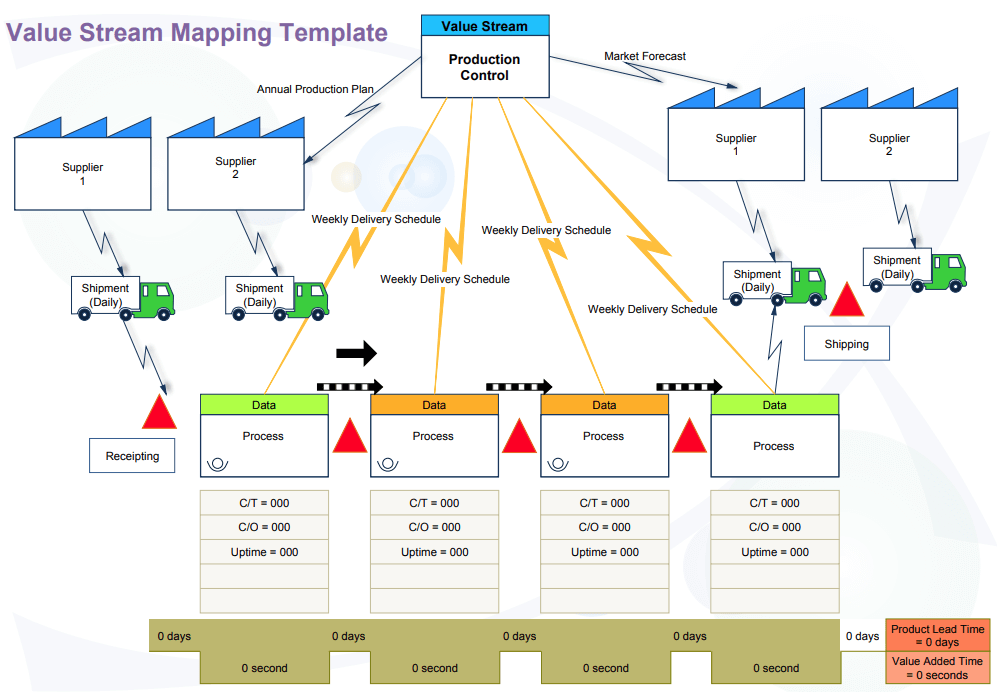
4. Value Stream Mapping (VSM)
It is a simple management technique to analyze and improve processes that make a product or provide customers with a service.
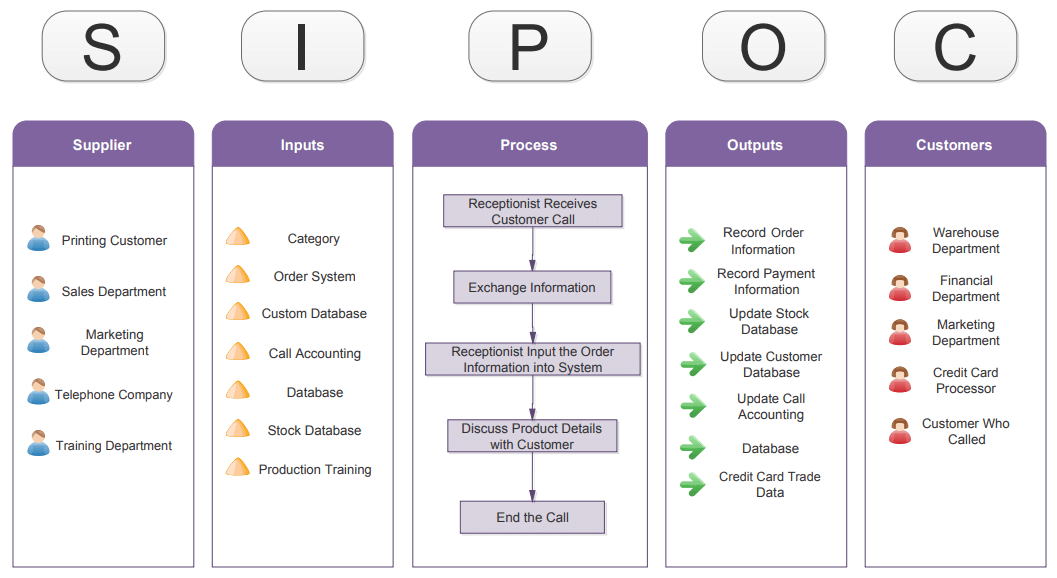
5. SIPOC
SIPOC stands for the supplier, input, process, output, and customer. This is an advanced process map that presents a very detailed visual representation of a process. It is a practical and quick method to understand any process from start to finish.
How to Make a Process Map?
Process mapping is a streamlined tone to provide a better understanding of a process. Process maps can be created in common desktop software like Microsoft Word, Excel, PowerPoint, etc. However, many other online tools like Edraw give you a more customized platform to create a process map.
Process maps communicate your process to other individuals to help you achieve your management goals. Therefore, it's important to know how to map a process and build strong communication and understanding with your teammates.
Here is a simple guide to help you create a process map:
Step 1: Identify the Process
Whether you want to understand an underperforming process or create a new one from scratch, you must:
- Identify the main process to visualize.
- Type the title or process name to get started.
Step 2: Set Up a Strong Team
Bring together a team of like-minded and strong team members to manage and provide the right input.
Step 3: Brainstorm the Steps Involved
Along with your teammates, gather all the necessary information from the start of the process to the end. Note down all the steps, inputs, outputs, roles, and time durations. You should:
- Note down steps.
- Decide the level of details you require.
- Delegate different activities and problems to two different teammates.
- Set time limit.
Step 4: Set Boundaries
Take the steps you identified as earlier and figure out the boundaries.
- When and where the process begins?
- When and where will the process stop?
Step 5: Determine Process Steps
Arrange the steps of your process in sequential order. Use a verb to begin the description and show the general step by step flow of the process.
Step 6: Draw the Basic Flowchart
Start from the beginning and draw a basic flowchart process map showing each process in the current state. Use symbols to represent a specific element in the process map.
Step 7: Identify Areas of improvement
Identify all the inefficiencies and delays within the process and create an improvement plan.
Step 8: Implement Changes
Implement the improvements and monitor the results. Review the flowchart with other teammates to reach detailed analysis.
Step 9: Standardize the Changes
Once you are happy with the outcomes from the improvements, standardize the changes, and inform all the stakeholders (team members, workers, suppliers, supervisors, customers, etc.).
Step 10: Finalize the Process Map
Review the flowchart and make sure you have included all the important information like the title date and symbol key. A process chart should have all the steps, and it should clearly show all the responsibilities and key individuals involved.
Best Process Mapping Tools
Process mapping offers valuable insights into how businesses and organizations can improve their processes. When such important information is usually presented it becomes easy to understand and collaborate for any project.
Here are the best process mapping tools to help you create detailed process maps:
1. EdrawMax
Edraw Max is the business technical diagramming software that allows you to create flowcharts, mind maps, organizational charts, network diagrams, workflow diagrams, floor plans, engineering diagrams, including 280+ types of diagrams and charts.
The current version of EdrawMax is available for both online and desktop use. It also offers a wide range of inbuilt templates to help you create all types of charts quickly and easily.
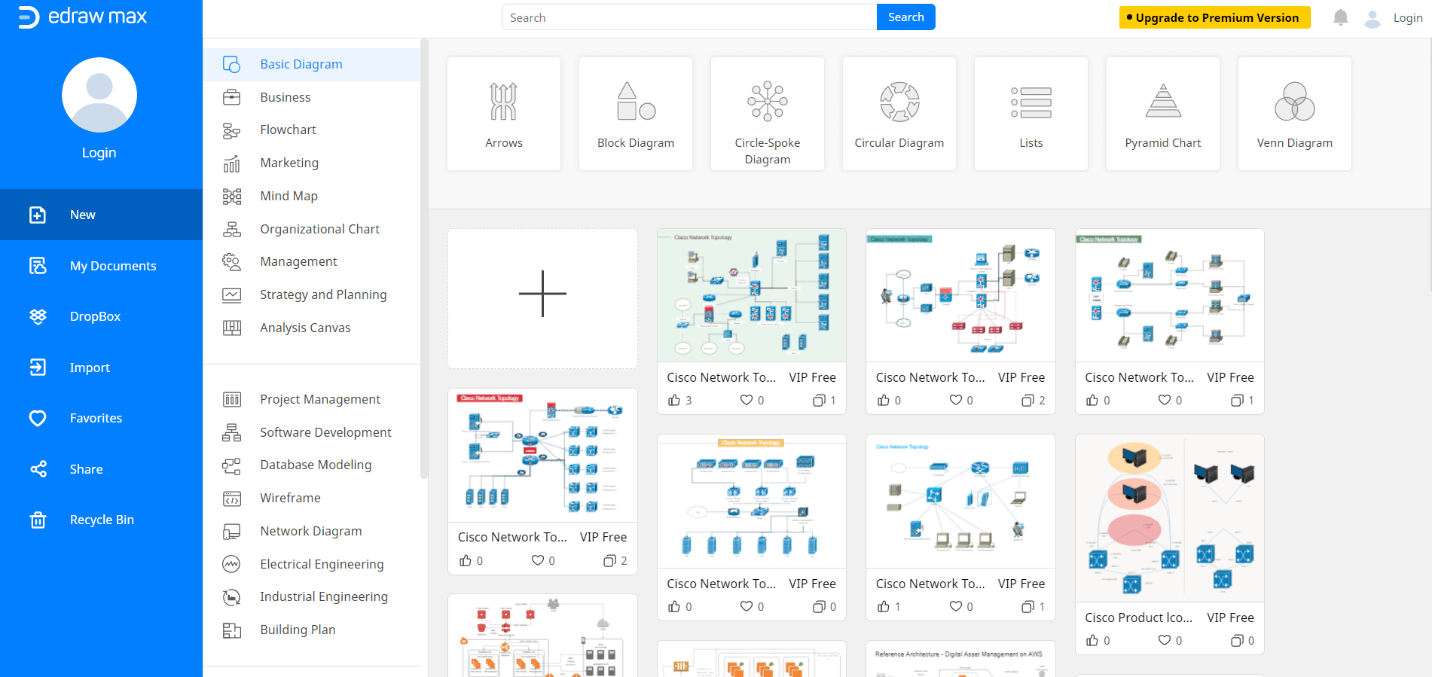
Image Source: https://www.edrawsoft.com/edraw-max/

An all-in-one platform for 210+ diagrams.
・ Simple alternative to Visio
・ 26k+ symbols
・ 10K+ free templates
・ 10+ AI diagram generators


2. Lucidchart
Lucidchart is a web-based platform to create drawings and business charts. It is a popular tool that offers cross-platform accessibility.
Lucidcharts comes with many features and functions to create process mapping. It allows you to share your charts with others in real-time.
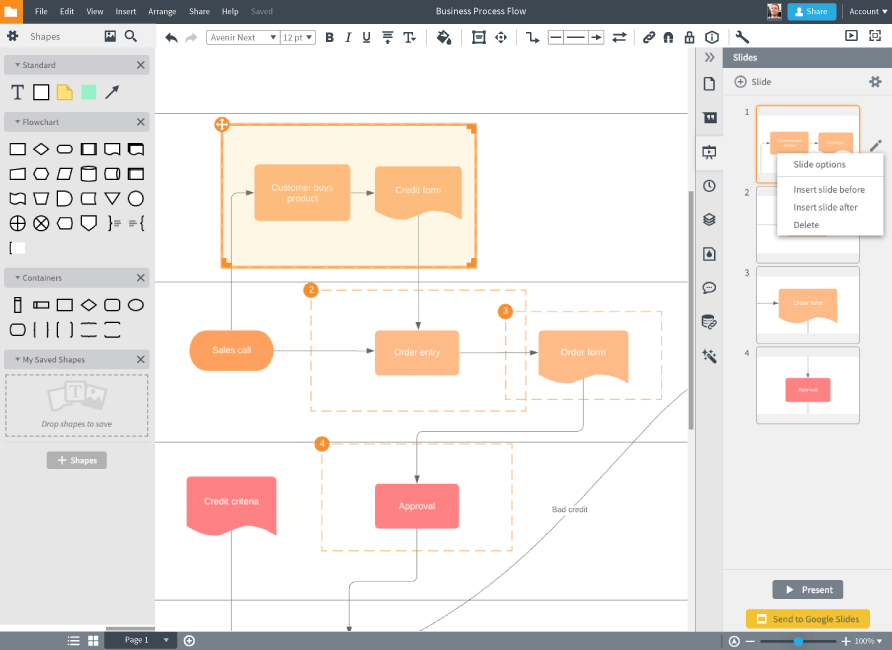
Image Source: https://www.lucidchart.com
3. Creately
Creately is an online software to draw and collaborate concepts. It can be used as a chart and diagram maker as well. It is a straightforward application that does not require any advance and technical skills. So you can easily build flowcharts, infographics, and other visuals here.
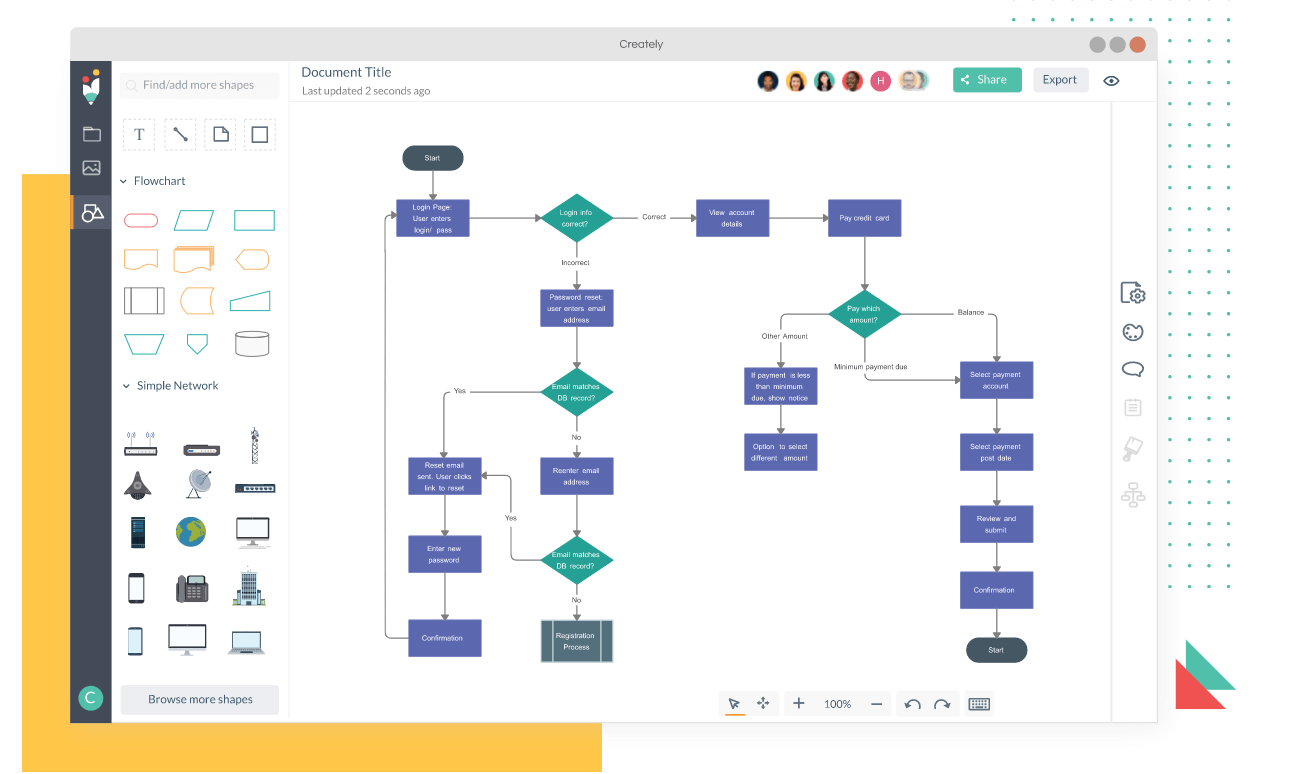
Image Source: https://creately.com
4. Microsoft Visio
Microsoft Visio is a great tool for process mapping, but it is rather expensive as compared to others. This software can also be used for drawing different diagrams like flowcharts, building plans, data flow diagrams, 3D maps, and many more.
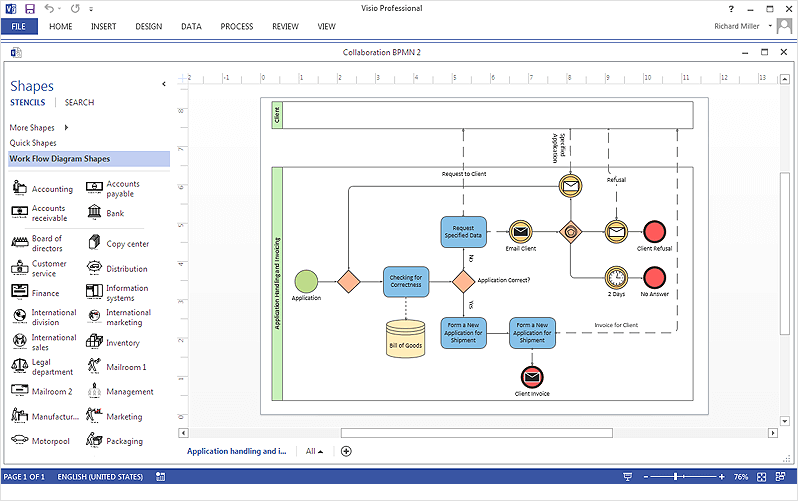
Image Source: https://www.conceptdraw.com
Conclusion
All the process mapping tools mentioned above have their pros and cons; however, one stands apart from the rest – Edraw Max. The single tool offers everything, including cross-platform accessibility, online and offline versions, affordable pricing, multiple free templates, and lots of other features. Whereas, the other tools mentioned here lack one or two of these features and come at a higher subscription.

