What is a Histogram
Know it All about Histogram
Histograms are a visual aid for statistical approximation of the data using the bars of different heights and widths. It represents the distribution of the continuous data by condensing them into user-specified ranges. In a nutshell, they sum up large quantities of data into easy-to-read graphs that help communicate information more efficiently.
The term histogram has a Greek origin and was first used in the late 19th century by the famous English mathematician and biostatistician Karl Pearson to refer to a common form of graphical representation. Thus he is credited with introducing histograms.
This suggests that Karl did not invent these charts, and histograms were used long before they got this name. However, the birth date and origin are still unclear. Nevertheless, after Karl’s name, these charts became more popular and started to get recognition among researchers and analysts.
Histograms are an important tool for visually representing a data distribution. These charts summarise large quantities of data and represent the frequency of values. Therefore, they aid in determining the data distribution trend and medians. They are also effective in highlighting the gaps and outliers in data.
A histogram can be used when you want to:
A Histogram is made of four main components, which are:
1. Title
This marks out the information included in a histogram.
2. Horizontal Axis (X-axis)
This represents the intervals the data is divided into. The intervals are uniform and help in summarising a large number of data sets. Individual data values are not displayed.
3. Vertical Axis (Y-axis)
Y-axis represents the frequency of the data plots, which is the number of times a value occurred in that interval.
4. Bars
The bars have variable height and width and are used to represent the data plots. The height corresponds to the frequency of a value, while the width represents the length of the interval.

Histograms are important tools for displaying the frequency distributions, showing how repetitive a value is in each set. Given below are some common histogram shapes that represent the different distribution of the data.
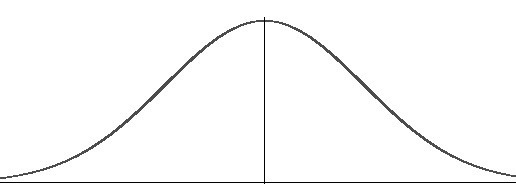
1. Normal Distribution
A bell-shaped curved graph is used to represent the normal distribution. The points on the one side of the average are likely to be present on the other side, so the graph has a very symmetrical shape.
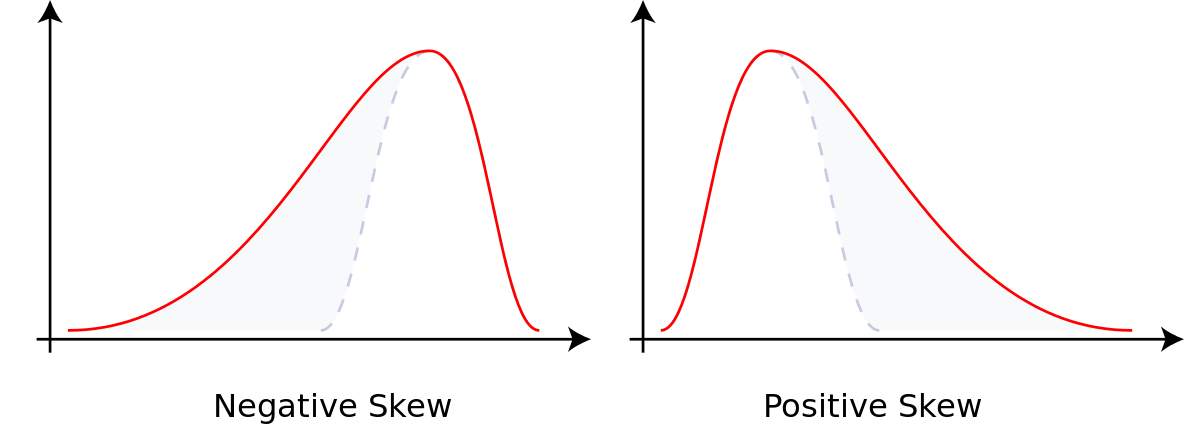
2. Skewed Distribution
In a skewed distribution, the peak is inclined towards the limit, and a tail proceeds away from it. It is an asymmetrical distribution that can be skewed to the right or left. While the right skew distribution is termed positively skewed, a distribution skewed to the left is negative. We get a right-skewed distribution if all the collected data has a value greater than zero, whereas the left-skewed is formed when data has values less than 100.
3. Random Distribution
As the name suggests, this type of distribution represents a random pattern and has several dispersed peaks. If a histogram represents this shape, it can be concluded that different processes were combined and how each needs to be analysed separately.
4. Bimodal Distribution
Also known as the double peak graphs, the bimodal distributions represent that the data from two different processes have been merged to form one data set. If this is the case, the data from both processes should be analysed separately.
Step 1: Collect the data values for a process.
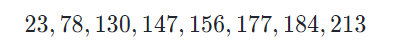
Step 2: Now decide on a suitable width for each bar. The range should have uniform intervals and should fit all the data.
Step 3: Select the number of bars for a histogram. Avoid using too many or too few bins.
Step 4: Create a frequency distribution chart for your data plots by checking how many values fall in each bin.
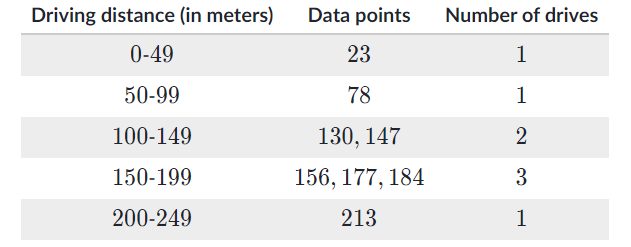
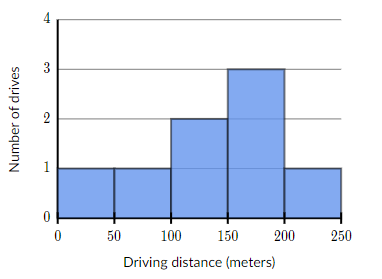
Step 5: Draw a graph and label the axis. Scale the axis with the intervals chosen in step 2 and the y-axis with the frequency of data values.
Step 6: Draw a bar graph for each interval, so the bar matches the frequency for each value. The bars should have no spaces between them.

・ Simple alternative to Visio
・ 26k+ symbols
・ 10K+ free templates
・ 10+ AI diagram generators
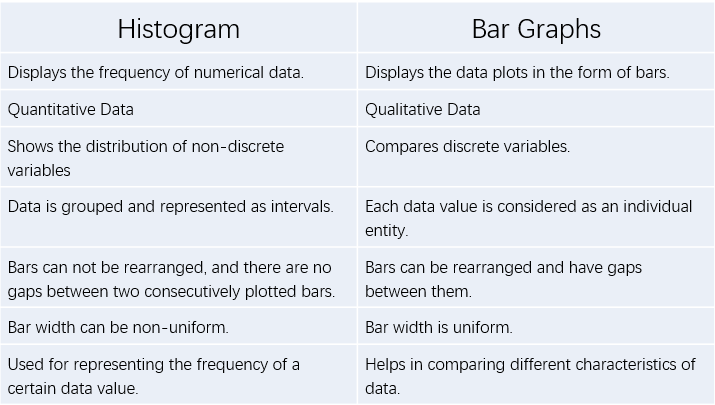
People often argue that histograms are a type of bar graph. Well, that not true. They may look similar, but both are two distinct graph forms.
For a better understanding of histograms, let’s look at some examples given below.
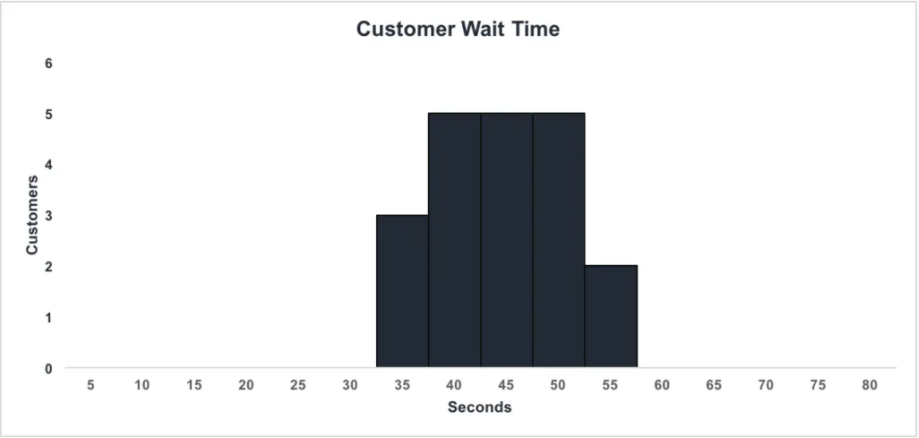
1. Customer Waiting Time
This is a histogram that is plotted for the waiting time experienced by customers at a certain place. The data was collected and then divided into suitable intervals to fit all the values. From the histogram, we can easily interpret that three customers waited for 35 seconds while 5 of them had to wait for atleast 50 seconds. Such graphs are a good way to check the efficiency of a system and improve the service.
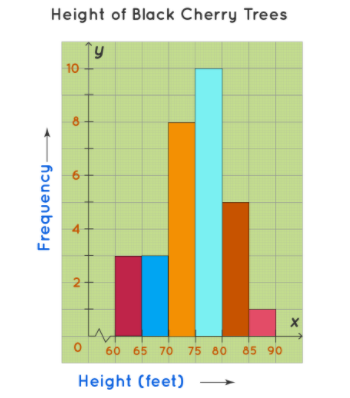
2. Height of Black Cherry Trees
This is another example where a histogram is plotted for the height of cherry trees in an orchard. The orchard had 30 trees, and the height was measured for each of them. The data is then grouped in the form of a frequency distribution chart that sets the intervals and records the frequency for it.
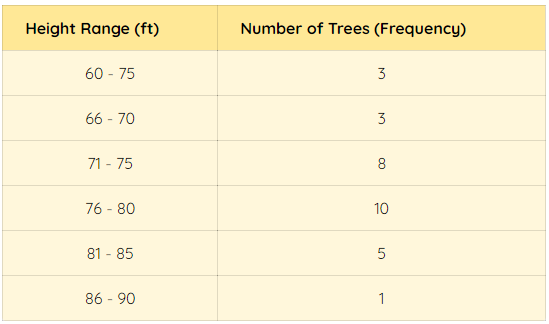
A histogram for the data is drawn that clearly shows that the most trees in the orchard are 75-80 feet heightened. The graph is easy to follow and helps in determining the height distribution of trees in the orchard.
The End! I expect you have learned everything you wanted to know about a histogram. They are a visually pleasing and creative way of summarising the data that could significantly improve your presentation skills. Creating them is simple, but with Edraw Max, it gets even simpler- a gamut of tools and a user-friendly interface is a good way to quick-start your creativity.


