Expenditure Cycle Flowchart Complete Guide
Edraw Content Team
Do You Want to Make Your Expenditure Cycle Flowchart?
EdrawMax specializes in diagramming and visualizing. Learn from this expenditure cycle flowchart complete guide to know everything about the expenditure cycle flowchart. Just try it free now!
Did you know the secret to increasing the revenue of your business? You find it true or not, but its pathway passes through proper expense management and expenditure cycle flowchart. What’s that, you may say. Let me explain!
Being a business owner, you may have an idea about running expenses. These do not stop at all. You need goods to generate your products. That makes it accurate to say that you can’t eliminate them. However, you can manage them in a way that they don’t pose a negative impact on your business invoice.
The best way is to keep track of your money spent through a roadmap that the expenditure flowchart provides you. That’s not all! If you want one for your business, this article will provide you with an editable flowchart example for free.
1. What is Expenditure Cycle Flowchart?
The cash spent on business expenses can become a problem if left unnoticed. Therefore, tracking the expense of your business is vital for improvement. You may ask how it is possible. To regulate your business expenses, you need to get the help of an expenditure cycle flowchart.
Before jumping in to review this visualization, let’s see what the expenditure cycle is.
The expenditure cycle is a repetitive set of processes by which a business spends money on goods and services. In general words, this accounting procedure deals with the operations linked with goods purchase and payment methods.
The purpose of the expenditure cycle is to help monitor how the company spends money. Plus, it depicts how well it manages the cash expended to support its operations. As the name suggests, this cycle connects the informational flow of money spent within the business. That means the expenditure cycle will track every cent and penny transferred within the firm. However, with complex numerical statistics in hand, creating a chart isn’t easy.
That is where the expenditure cycle flow diagram comes in. A visually presentable chart gives you a concise roadmap of money spent within your business. It helps the company’s managers track their spending, manage cash flow and stay in control of expenses. The expenditure cycle flowchart is an easy way for everyone involved in accounting to keep track of the expenses approached by your business.
Here’s the complete deal:
Assessing all that expense data goes through a step-wise judgment. This procedural judgment requires two sequenced conditions.
- You must first define what your expenses are before you can create a realistic budget. It includes defining the currency that each expense will cost you per month. Remember, it includes all items, such as rent/mortgage payments.
- Once you know how much it costs to keep up with all these bills each month, you can focus on creating budgets based on those numbers.
Once you are done with all that, everything is ready to get in place within an expenditure cycle flowchart. By placing everything in its place and connecting them with appropriate informational flow links, you can easily keep track of the money spent in the cycle.
2. Components of the Expenditure Cycle
Like any other cyclic pathway, this dataflow also has a series of components that make it a whole.
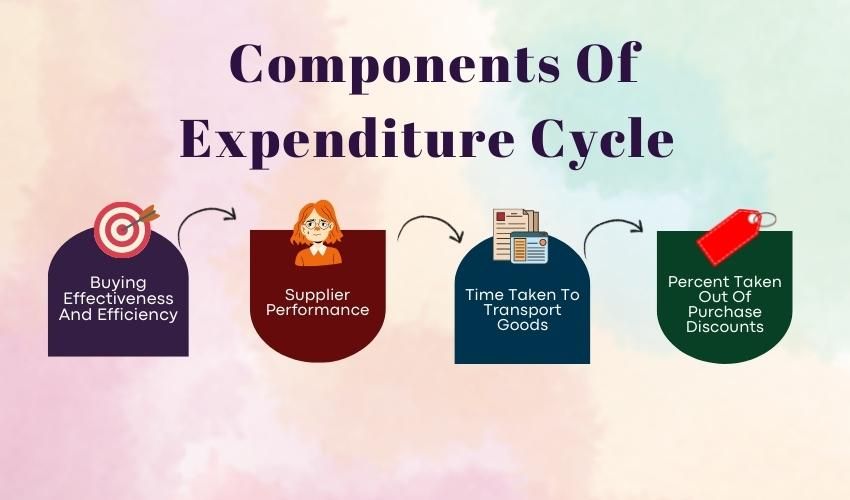
- Buying Effectiveness And Efficiency
- Supplier Performance
- The quality and timeliness of responses from suppliers
- The level of competition between suppliers
- The amount of time taken to research each supplier
- The amount of time taken to negotiate a deal with each supplier
- Time Taken To Transport Goods
- Percent Taken Out Of Purchase Discounts
Purchasing efficiency means getting the best possible price for your product. It depends on how well you can match your needs with what's available on the market at the time. For example, there are times when the competition between suppliers for certain products is at its peak. However, if you can’t find your product or other options that fit your need ideally, do not buy based on reputation and competition. Instead, it's worth waiting until another supplier has come up with something more suitable.
It gets better with the effectiveness:
Effectiveness means you do things without wasting time or energy on unnecessary tasks. For instance, searching for new suppliers or checking out different models before deciding won’t bring fruitful results if you spend all the time on them. If time is money, then it makes sense that efficiency would be important to get maximum value from every dollar spent.
The supplier performance cycle is the time it takes for an order to complete with a supplier. Generally, it includes everything from receipt of an order request to delivery of products. The swift and reliable experience throughout these processes shows exceptional supplier performance. As a result, it helps make a better expenditure cycle flowchart to track expenses.
There are a couple of factors that can impact this performance, including:
After the above two phases, things start shifting from the receiving sector to the production unit. Once you are all set with your supplier, it is time to take the goods from the receiving center to the production unit. You may wonder how it impacts the expenditure cycle. The more time it takes for transport, the lengthier the cyclic pathway will be. That means if you can somehow reduce the time, the expenditure cycle flowchart can become swift and less complex. Furthermore, the time taken in that process can affect its information flow.
The final part of the expenditure cycle is all about purchase discounts. Basically, businesses tend to assess this task through two separate systems. One is a voucher system, and the other is a non-voucher system. As the name states, the first one deals with discounts and allowances with in-hand vouchers. Whereas the non-voucher system uses open invoice lists and paid check process.
Both of these processes impact the expenditure cycle accordingly. That means both can make the process slow or quick in different purchase conditions, varying with vendors.
3. Expenditure Cycle Flowchart Examples
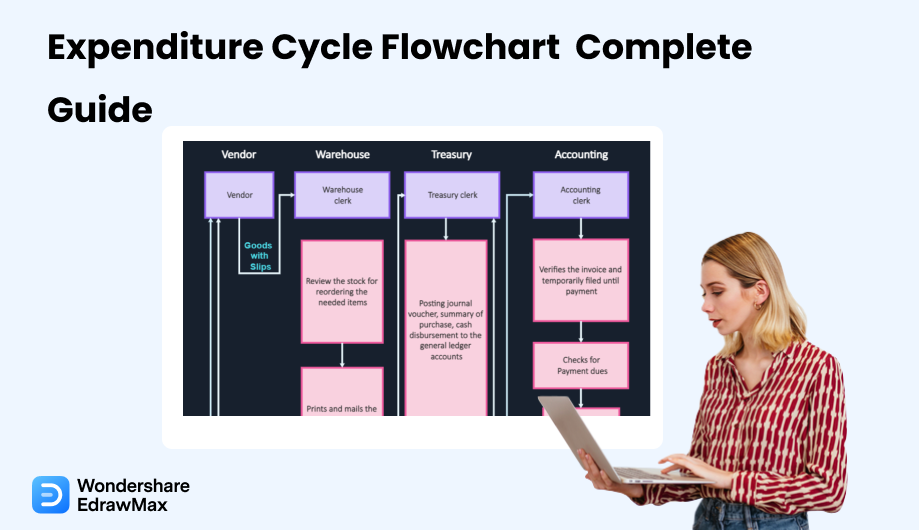
This expenditure cycle flowchart example shows the most crucial steps for recording the financial transactions of a business. A complete accounting cycle starts with recording journal entries and ends with a post-closing trial balance.
After all the theoretical information, things may have become confusing for you. After all, the expenditure cycle is a complicated flowchart in itself. However, there is a way to understand its primary roles and processes. That way goes from the expenditure cycle flowchart example.
In addition, the example will show you the way to assess the main roles and connections within the framework. Starting from the visual representation, you can see it is a vertical chart diagram. Due to its standing orientation, it is easier to fit extra data inside the chart.
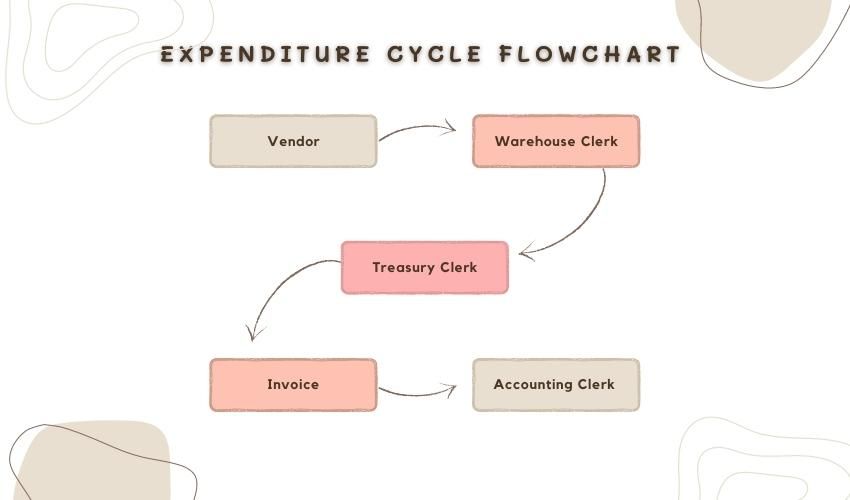
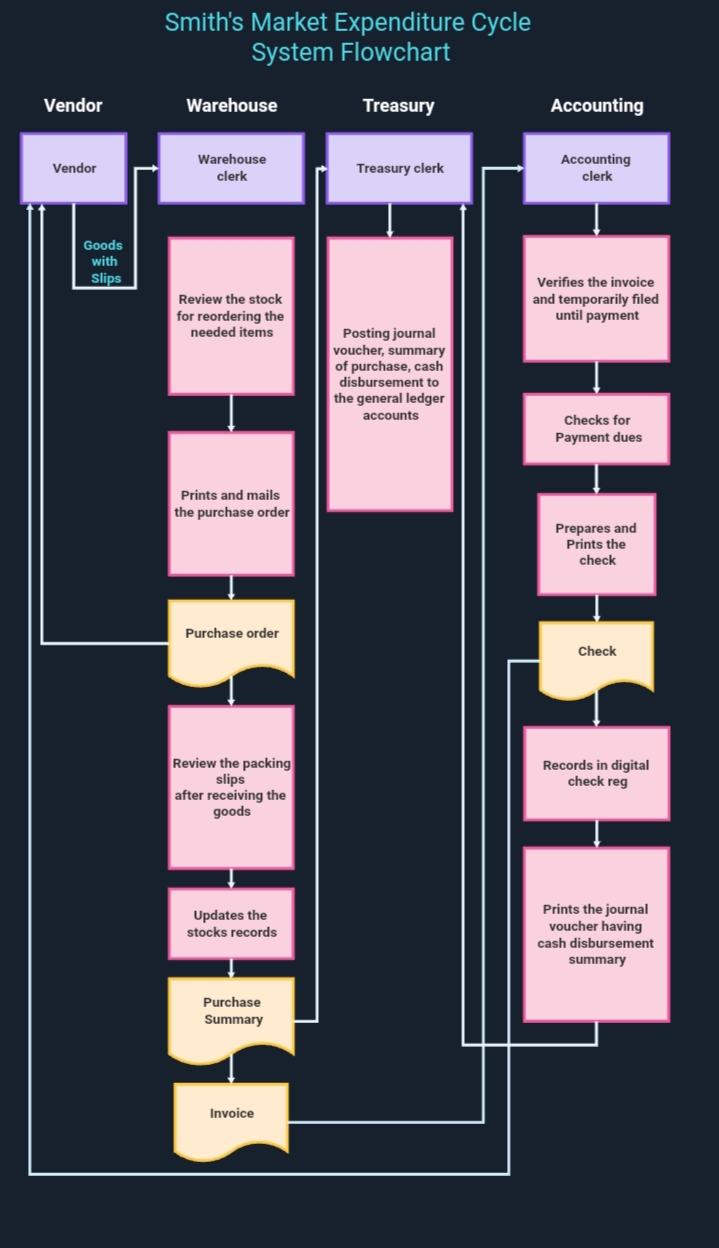
The above example is an editable smith market expenditure cycle flow diagram. This market focuses on 4 main components.
- Vendors
- Warehouse
- Treasury
- Accounting
Each one of them goes down to authority sub-levels that connect departments. For instance, the purchase order personnel in the warehouse connects the sector directly with the vendor.
The expenditure cycle flowchart helps you track the expenses and gives you a detailed and organized employee task. That means you’ll be able to identify the cash spent by every person with the help of this flowchart.
As for the display, it appears to be appealing and accessible simultaneously. A business owner won’t have any difficulty understanding the transaction framework. Besides that, while investigating, it highlights the factors that impact the expenditure cycle for the management committee.
4. More Expenditure Cycle Flowchart FAQs
What is the difference between the revenue and the expenditure cycle?
The revenue cycle involves all the processes that lead to generating revenue for a company and its customers. Specifically, it involves selling goods for profit. In comparison, the expenditure cycle is about allocating resources to the various departments within a business. In particular, it refers to a series of steps in purchasing the goods for product creation.
What are the three basic activities of the expenditure cycle?
The basic activities of an expenditure cycle help outline its exposure within the business. An ideal expenditure cycle focuses on three fundamental activities given below:
- 1. Ordering goods. Remember, it involves ordering the services and supplies also.
- 2. Receiving the goods and storing them appropriately.
- 3. Paying for these goods and keeping track of the cash spent.
Why are basic activities of the expenditure cycle important?
Basic activities of the expenditure cycle help you to control your money. Without them, you cannot know how much money you have and where it's going. That is why you will not be able to ensure that your spending is aligned with your goals. Besides that, they help you understand how expenses will change over time which helps you make better decisions about your business or personal finances.

An all-in-one platform for 210+ diagrams.
・ Simple alternative to Visio
・ 26k+ symbols
・ 10K+ free templates
・ 10+ AI diagram generators


5. Final Thoughts
The expenditure cycle flowchart outlines the process of managing how a business spends its money. It includes all the steps involved in making purchases and paying for goods and services such as rent, salaries, or equipment maintenance. Understanding how this works will help you manage your company's finances better. Therefore, you can focus on what matters most - with EdrawMax growing your business profitably!
Flowchart Complete Guide
Check this complete guide to know everything about flowchart, like flowchart types, flowchart symbols, and how to make a flowchart.
You May Also Like
Accounting Flowchart Complete Guide
Knowledge
Human Anatomy Complete Guide
Knowledge
Digestive System Diagram Complete Guide
Knowledge
Programming Flowchart Complete Guide
Knowledge
Organizational Chart Complete Guide
Knowledge
Personal SWOT Analysis Complete Guide
Knowledge


