Benefits of Fishbone Diagrams
Definition of Fishbone Diagrams
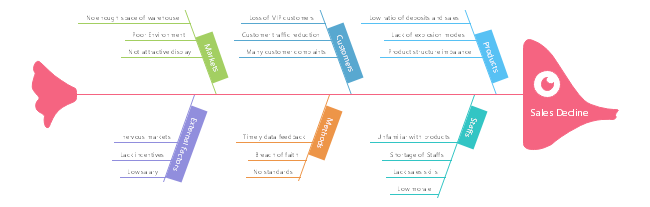
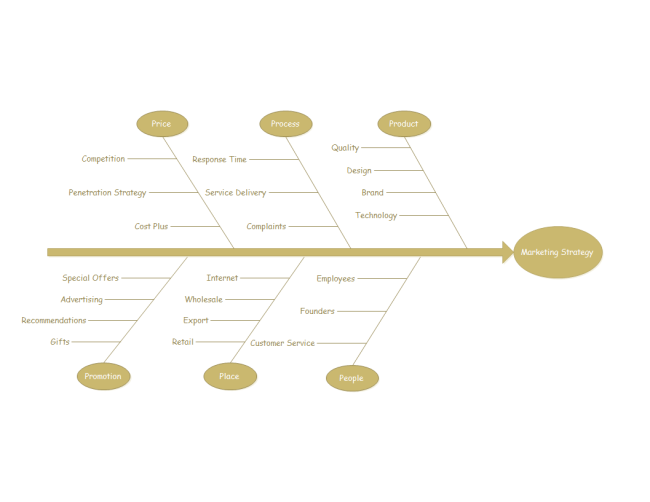
The fishbone diagram, or the cause and effect diagram, is a simple graphic presentation that displays all the possible causes of a problem. It is also called the Ishikawa diagram. Here is a fishbone diagram example depicting the causes of low market share from five perspectives: customer, advertisement, personnel, competitor, and sales channel.
Benefits of Fishbone Diagrams
Fishbone diagrams are very useful because they portray information in a neat and comprehensible way. There are 5 major benefits of Fishbone Diagram:
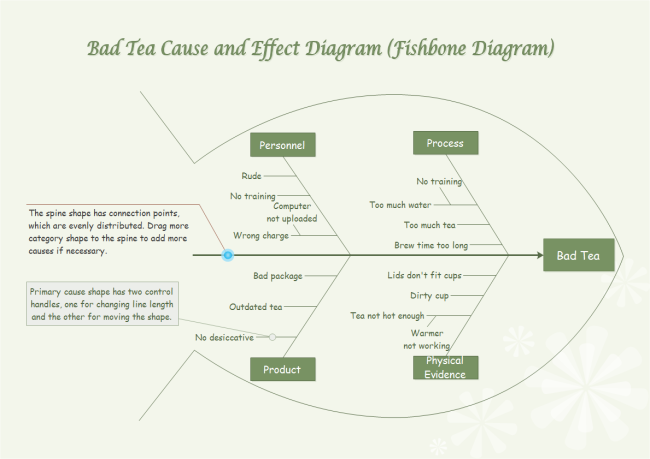
1. Display relationships clearly and logically - The fishbone diagram captures the links and relationships among the potential causes and results displayed in the diagram. Categorized logically, the correlation can be understood at a glance.
2. Show all causes simultaneously - Any cause or causal chain featured on the fishbone diagram could lead to the problem. The fishbone diagram illustrates each and every possible reason in a single diagram, which is beneficial for in-depth analysis. This makes it a useful tool for presenting the problem and solutions to stakeholders.
3. Facilitate brainstorming - Edraw fishbone diagram is a great way to boost and structure brainstorming about the reasons for a certain result because it captures all the causes.
4. Stimulate problem solving - Seeing the reasons in visual graph and exploring the root cause may stimulate your team to find out possible solutions to the problems.
5. Help maintain team focus - The fishbone framework can keep your team focused as you discuss what should be done to solve the problem or achieve a common goal. It helps to analyze every involved party. And it ensures that nobody is wasting energy chasing nonexistent problems.
Check out the following example to see how to apply 8P method in cause and effect analysis to solve problem.
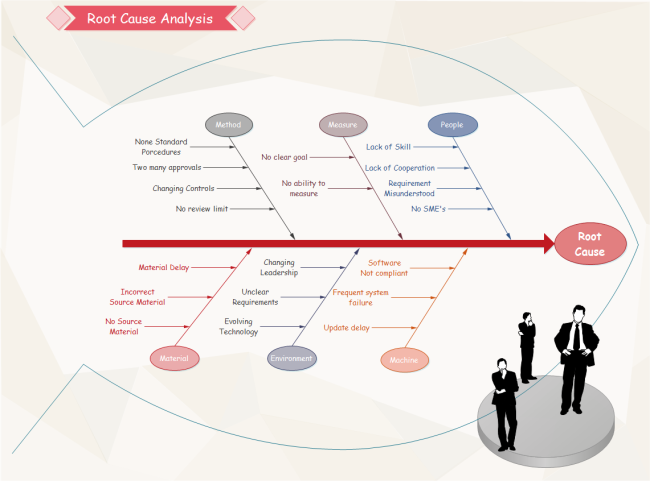
You can also apply 6M and 5W1H method in cause and effect analysis for better solutions. These two methods are simple but useful, making your fishbone diagram more organized and structurized.
Easy-to-Use Fishbone Diagram Maker
With an easy and efficient fishbone diagram maker, you can even create a fishbone diagram in minutes. Thanks to its built-in symbols supporting drag-and-drop use, even beginners can gain professional-looking fishbone diagrams. The ready-made templates and examples help users get started as fast as lighting.

An all-in-one platform for 210+ diagrams.
・ Simple alternative to Visio
・ 26k+ symbols
・ 10K+ free templates
・ 10+ AI diagram generators


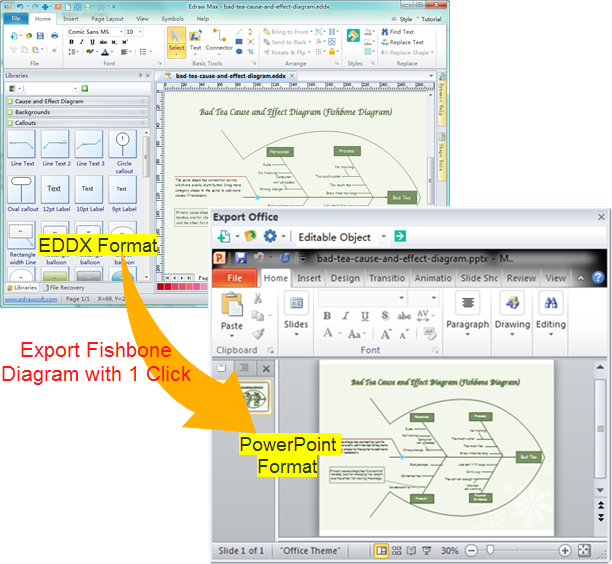
Create Fishbone Diagrams in PowerPoint Format
You may need to have ppt format fishbone for presentation. No worries. In Edraw, 1 click turns the fishbone diagram into a fully editable PowerPoint file. Just click the Export button on the Quick Access Toolbar.
Discover More Fishbone Diagram Templates
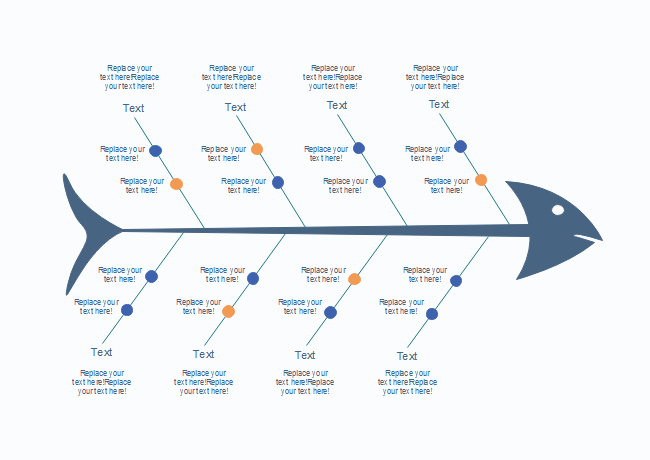
Select one fishbone template from Edraw templates library of fishbone diagrams to find what you want.
|
|
|
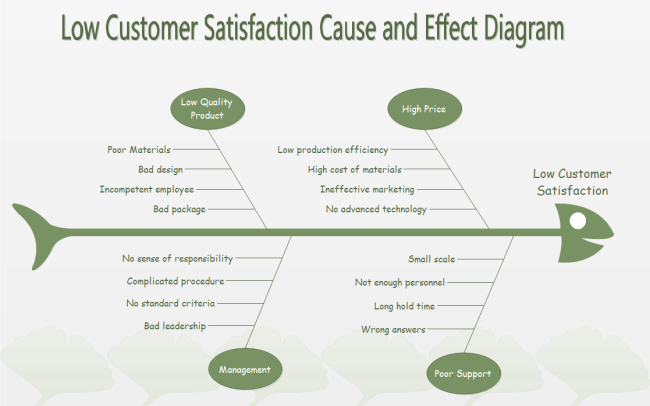
| Root Cause Analysis Template | Node Fishbone Diagram Template | Fishbone Diagram for Low Satisfaction |
|
|
|
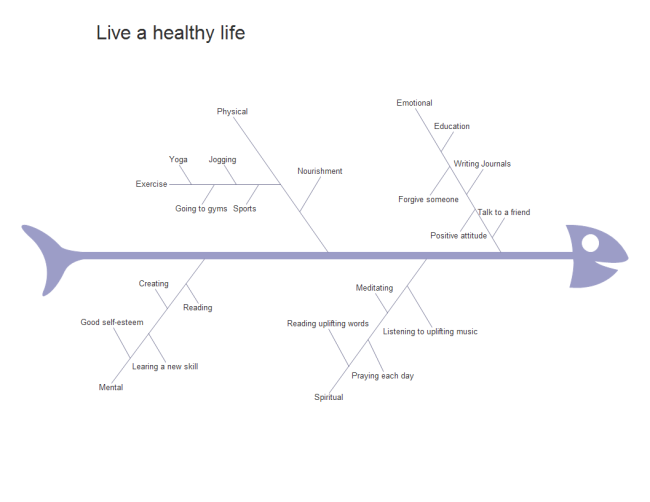
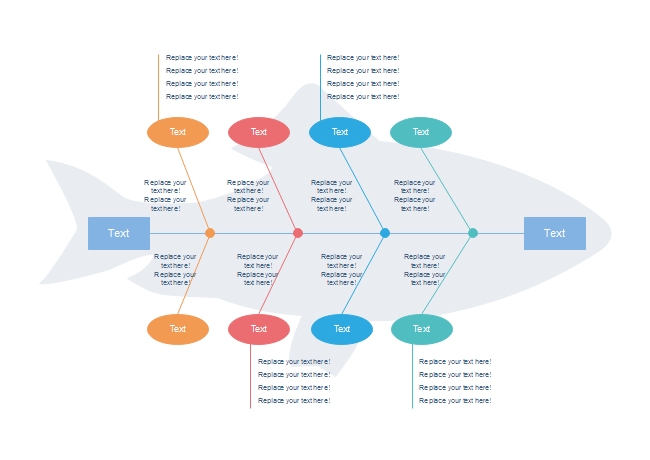
| Healthy Life Fishbone Diagram | Fishbone Diagram Presentation Template | Marketing Strategy Fishbone Diagram |


