What is Value Stream Mapping? - Concepts and How to Use It
Contents
What is Value Stream Mapping?
Value stream mapping (VSM) is a technique used by firms to define, analyze and optimize the information/materials flow required to the whole production process. The model, which contains both values adding steps and non-value-adding steps from the customers' standpoint, is similar to the flowchart structure. The main purpose of value stream mapping is to help managers and team leaders build an efficient and integrated resources and information flow system for their organizations.
The History of Value Stream Mapping
The model was first pointed out by Charles Knoeppel in his book regarding efficient methodology. Latter, value stream mapping analysis became popular with the development of the Lean process management in the 20th century, and was used by many leading companies such as Toyota. By the 1990s, value stream mapping has been used in more worldwide sectors and fields from manufacturing to software development.
Why Use Value Stream Mapping?
The model can help us to:
- Speed up or prioritize the overall production or service process. It offers an overview for you to see at a glance the restraints and delays in your process, or you can check single status about the progress of each task.
- Identify and eliminate waste for all of your production activities, for example, design, delivery and many more. The most common types of waste for production management including overproduction, unnecessary waiting time, too complex process, the excess stock and so on.
- Furthermore, you can evaluate a value stream mapping by connecting all activities so as to create a common vision for your project team for any future changes.
Value Stream Mapping Symbols
VSM symbols have a number of common categories for the usages of all industries and fields: process, material, information, general and the extended ones. These intuitive symbols help you depict various work activities and information flows. Moreover, these symbols are not standardized so you can modify them for the specific requirements of your project. Here are the most widely used ones for each category.
Process
This category includes symbols for showing customers or suppliers, dedicated process flows, data boxes (e.g. cycle time) and the workcell (multiple processes).


Material
The section covers symbols for displaying inventory, push arrow, shipment car, material pull (removal of materials in a supermarket), and the supermarket (an inventory "supermarket").


Information
The category has symbols of the sequenced pull, the Go See Glasses (gathering information by checking details), the production kanban (triggers the production of predecided parts), the verbal information and the ERP (enterprise resource planning) and MRP (material requirements planning).


General
This part below shows you the Kaizen Burst symbol ("Kaizen" is a Japanese word that means continuous improvement), the timeline symbols and the symbol for other information that you may want to provide to others.


Extended
The additional symbols here show more options for drawing your value stream maps. For example, the airplane, the warehouse, the phone and so on.


Value Stream Mapping vs. Six Sigma
VSM is part of the Six Sigma methodologies. These two models share the common goal of eliminating waste for a better efficiency. However, they are differences in two main aspects as shown below:
- Value stream mapping and Six Sigma identify waste in different approaches. The former type focuses more on non-valued-added activities, while the latter type focuses more on process variations.
- Normally, VSM gathers and shows a broader range of details than Six Sigma chart, for example, the gain of raw materials to the delivery of final goods or service.
You can also find out more about the relationships between VSM and value chain analysis.
Applications of Value Stream Mapping
In the past, VSM was mainly used in the manufacturing industry. However, nowadays the model is also used in many other industries and fields such as engineering, finance, human resources, legal, marketing, software development, logistic, public service and many others as shown below:
- Software Development - As an incredibly fast-paced industry with many market demands and high user requirements, value stream mapping analysis can assist software development teams in reducing handoff delays, solidifying their Lean process, analyzing use cases, defecting reports, and refining their development process to enable a sustainable delivery.
- Business and Management - Value stream mapping model can help business managers do office and administrative tasks in order to improve organizational efficiency.
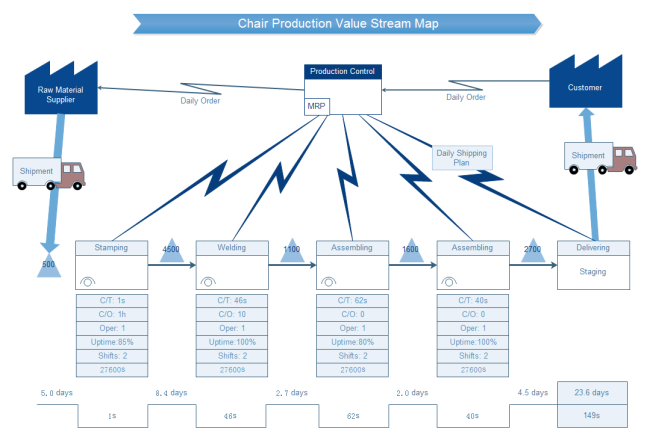
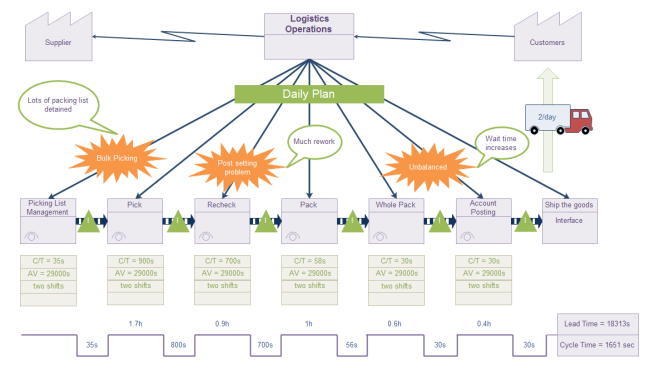
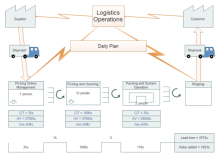
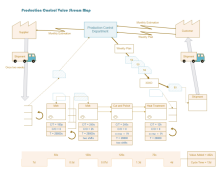
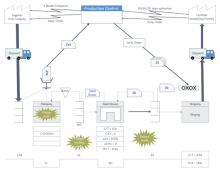
Here is an example of the logistic value stream mapping (click it to learn more).
How to Implement a VSM Analysis Efficiently?
Here are some common steps for you to undertake a value stream mapping analysis for nearly all industries and fields:
1. Select a product or product family group that your business wish to map out and analyze. You can do this from your customers' standpoint (price reduction, quality problems etc.).
2. Decide the scope of your map. Your team should consider the starting point (raw materials etc.) and the endpoints (end users etc.) of your VSM process.
3. Quickly list all of your process steps required to deliver the product or service. By doing so you can collect more information to fill in your gaps.
4. Determine the process details based on your work activities (both value-adding and non-value-adding ones), inventories and information flows.
5. Draft your current state VSM based on the information you got. Draw a table or data box under each process block to do so. You can also know about total process times and lead times for inventory through your processes by using time lines.
6. Collecting your data such as product cycle time, inventory size, number of operation staffs, scrap rate and net available working times. Then you can add data to related data boxes on your map.
7. Evaluate your map by thinking about capacity (e.g. inventory levels and waste), constraints, user experience (in this case you may need the customer journey mapping for more insights) flexibility and the consistency of your product lines and information flows.
8. Create your future state VSM and ideal state VSM by mapping out your process for each step. The latter ones are in a simpler structure for you to highlight and illustrate project goals. A simple ideal state value stream mapping looks like the diagram below:
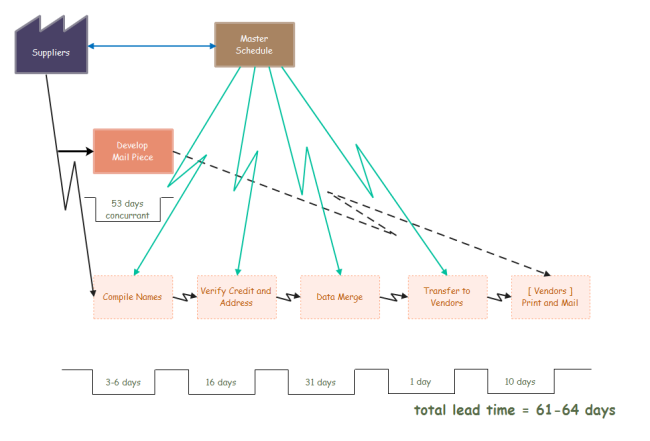
9. Conclude and find solutions by monitoring your results (excessive inventory, low uptime, poor quality and so on) for continuous improvement. Try to find out potential costs and determine the root causes of your product.
Additional Value Stream Mapping Tips
Here are some tips:
- Try to avoid assumptions or impressions that you didn't obtain based on your direct experience. Walk through your entire process or stream.
- You can review your stream from endpoint to your origins to see things from different perspectives.
- If you have lots of products or limited budget, first go for the most valuable product. Then move on to something more complex. Similarly, if you have many suppliers, focus on your most key suppliers or grouping them into similar types.
- If you need to include historical data sets, be sure to verify them using your current inputs and outputs for each step.
- Introduce leaders who have first-hand views on system performance from different departments within your organization to carry out the mapping process.
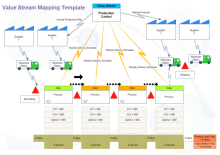
More Free Value Stream Mapping Templates
Below are some of the free download value stream mapping templates for you. Click one of them and get started as soon as possible.
|
|
|
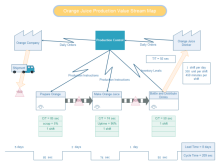
| VSM General Template | Operation VSM Template | Orange Juice Production VSM Template |
|
|
|
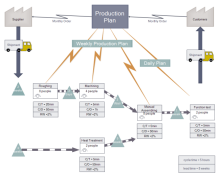
| General Production VSM Template | Production Control VSM Template | Sample VSM Template |
How to Create Value Stream Mapping Diagram with Software?
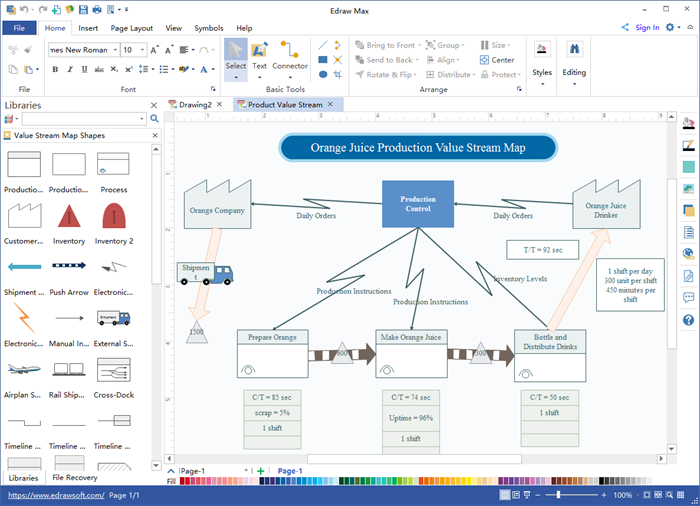
With an easy-to-use VSM diagram software, you can quickly create any vsm diagrams even without professional drawing skills. Here we gonna show you how to draw a VSM diagram, then you can try to add more details based on your needs:

An all-in-one platform for 210+ diagrams.
・ Simple alternative to Visio
・ 26k+ symbols
・ 10K+ free templates
・ 10+ AI diagram generators


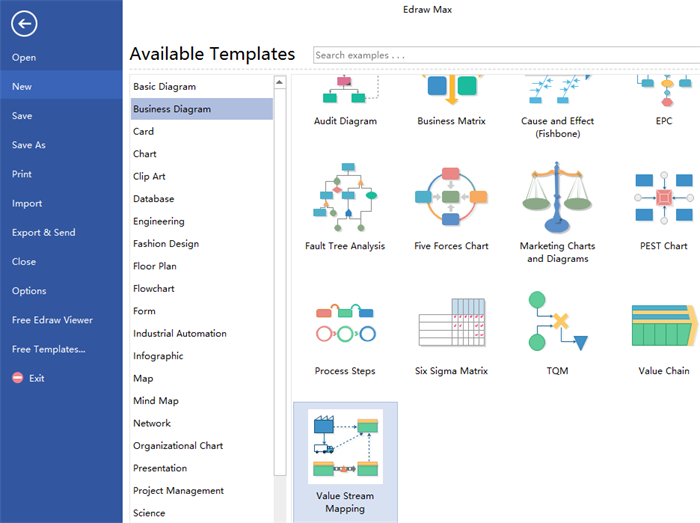
Step 1. Open a Blank Page
Start a value stream mapping diagram software, click New > Business Diagram, then double-click the icon of Value Stream Mapping to open a blank drawing page. Alternatively, you can choose a built-in value stream mapping template for a quick start.
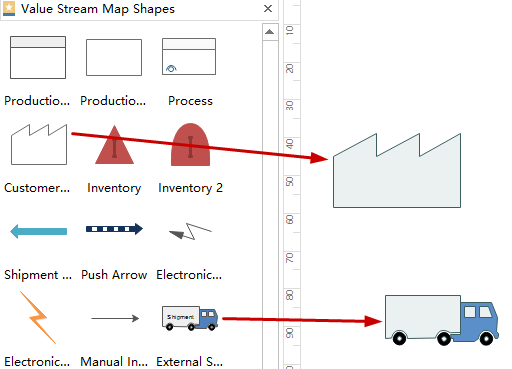
Step 2. Add Shapes
Drag and drop editable value stream mapping symbols and shapes from the preset left libraries to the right side drawing board.
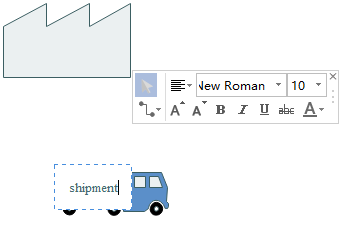
Step 3. Add Texts
Double-click the symbols and shapes to add texts and then edit their fonts, text colors, sizes and more.
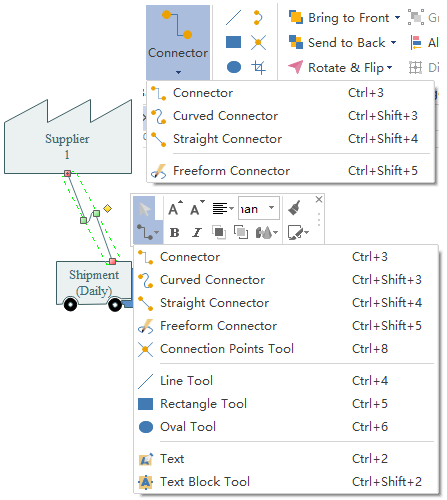
Step 4. Connect Shapes
Use connectors in different forms, such as the curved connector and the straight line connector, to quickly connect your shapes. Moreover, you can also add connection points to your shapes.
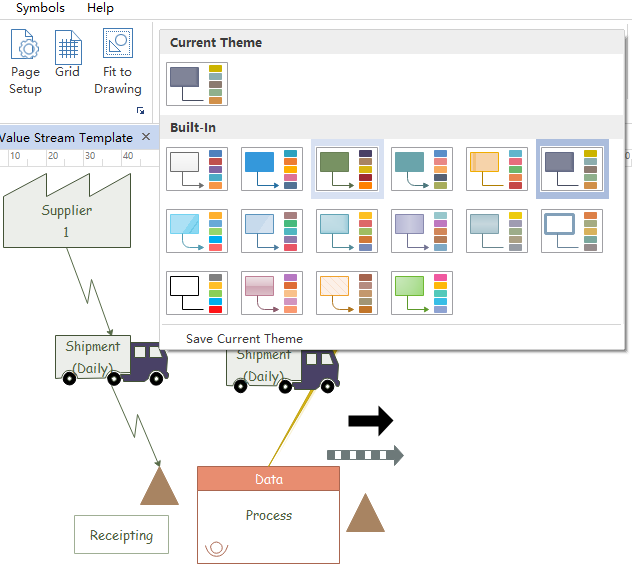
Step 5. Change Diagram Theme
Go to Page Layout > Theme to pick up a built-in theme to make your diagram more visually appealing than before.
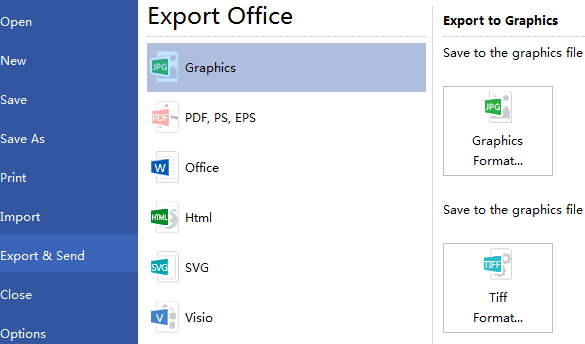
Step 6. Save, Print and Export
Go to Export > Send, so you can select many different formats including PDF, Graphics, MS Office, MS Visio and more. Besides, you can save files on the Edraw personal or team cloud, or print in different paper sizes.
Value Stream Mapping Diagram Software Recommendation
Try the advanced and dedicated Edraw Max for all sorts of business diagrams including value stream mapping . Enjoy the customizable and simple solutions to help you with daily system operations. Get started easily by using a preset template, dragging and dropping value stream mapping symbols on your drawing board, connecting and editing with auto-create theme tools. You can also save your files on the Edraw personal or team cloud and feel free to make further changes for your map. Free download right now by clicking on the Download PC Version or Mac Version at the end of this page.
Explore More:
Learn Value Chain Analysis Definition with Examples
Editable Value Chain Analysis Templates to Boost Productivity


