Explain Value Chains and Value Stream Maps with Pictures
Contents
What are Value Chains?
Value chain analysis (VCA) is the process to be used for analyzing how enterprises identify their most significant valuable factors and activities for product or services. Each of the value chains has a close connection with specific engagements in product development. There are two main types of VCA: the Primary Activities and the Support Activities. The former ones are functions applied for conversing and distributing elements during the process of, for example, the inbound and the outbound logistics; the marketing and sales; and the customer service aspect. The latter ones are generally used as back-ups.
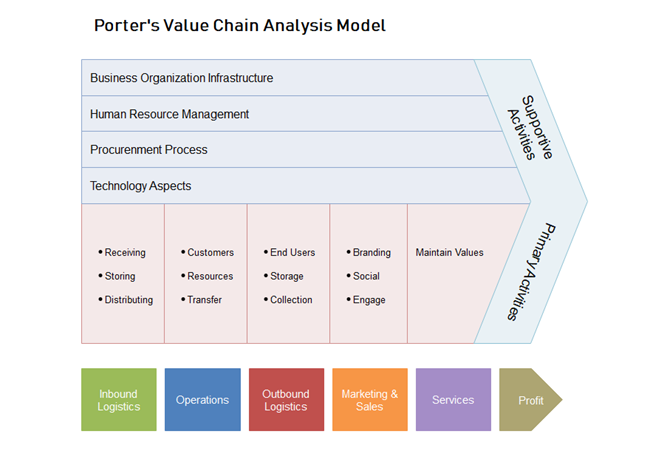
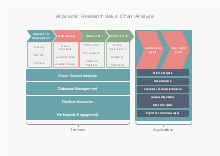
Above is an example of the very first value chains model from Porter showing Primary and Supportive activities. If decision makers could use VCA models appropriately, then a cost-effective and advanced competitive advantage outcome can be achieved both in the short and long run.
What are Value Stream Maps?
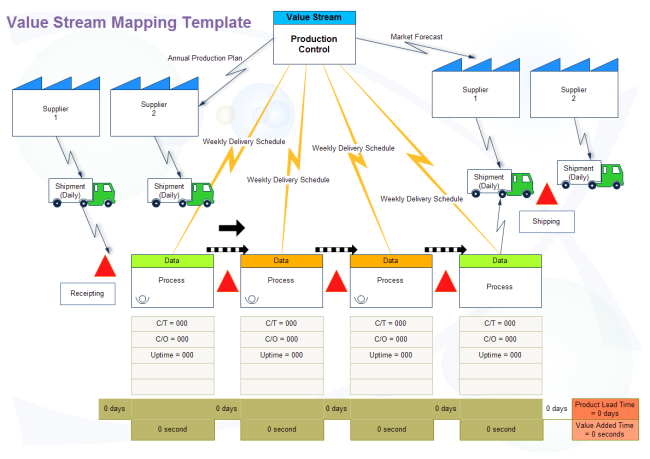
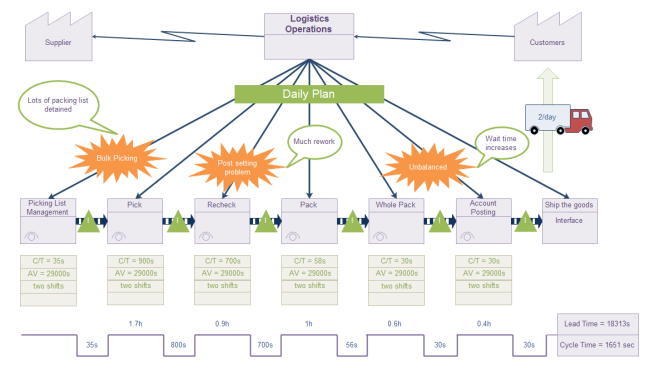
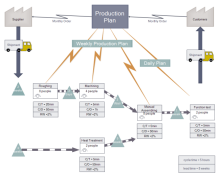
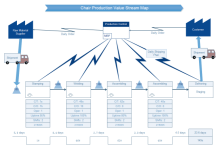
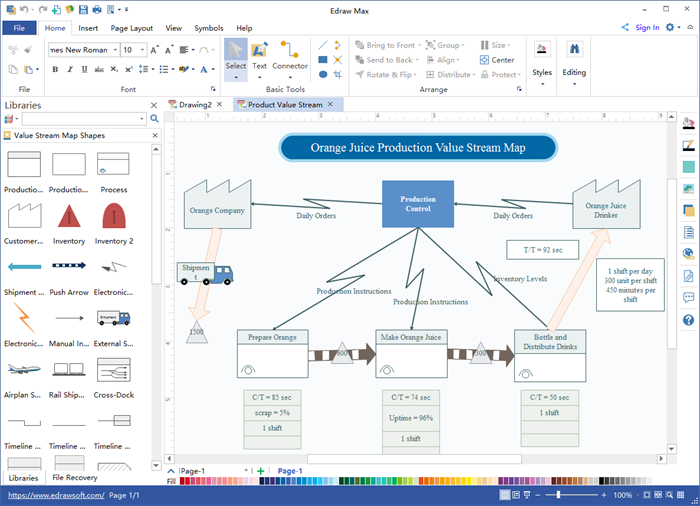
Value Stream Maps (VSM) are used to illustrate and strengthen the process of product delivery and service. Value stream maps are quite useful in exploring items that have less value to customers and reducing waste in many industries. What's more, managers can identify the root cause of the waste by visualizing the current process based on such a model. In reality, waste is usually in the form of system delays and storage constraints etc. The value stream map here shows a typical production control process.
Most Popular Value Stream Maps Symbols
VSM symbols specifically present information flows and different work activities. There are four key categories of VSM symbols: process, material, information and general. Below are some most widely used ones (check out this article of value stream map symbols to see the full list).
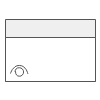
Process and General Types
These two categories are mainly about presenting customers, suppliers, cycle times and databases during a single, or multiple delivery processes.


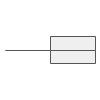

Material and Information Types
These VSM symbols normally refer to inventory, shipment channels, the control management and conversation of products.


Key Differences between Value Chains and Value Stream Maps
- Value stream maps are usually used for documenting a series of steps during transactions. Value chains diagrams present the dominant business factors that are used to assign metrics or measurements for operating successful executions. Therefore, value stream maps could be regarded as the combinations of value chains factors for the purpose of making profits.
- Value chain analysis focuses on competitive differentiation strategies that based on cost-analysis and potential resources; In contrast, value stream Maps are mainly about a specific group or category of customers.
- Value chain analysis is based on functional business aspects, whereas value stream maps are driven by steams of work projects.
Practical Usages of Value Chains and Value Stream Maps
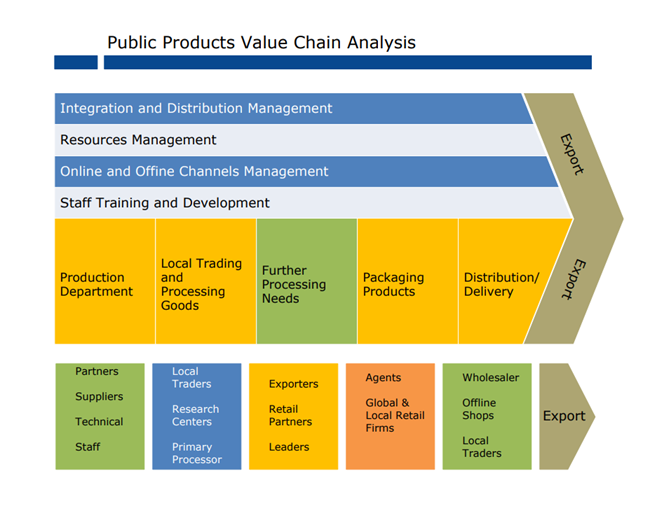
In business organizations, especially large-scale enterprises, the operations of both value stream maps and value chain analysis models are necessary. The use of value chains would assist managers to identify key features within their companies easier than before, while the value stream map model could strengthen the internal communications between different departments. The value chains example here indicates the key factors in the public goods sector could be traders, selling channels and the resources distributions etc.
More real-life examples include:
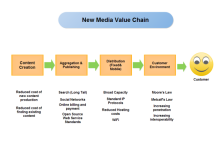
- Companies in the insurance or advanced technology sectors may need a specific value stream for customer feedback or for their new software;
- Cross-national organizations usually have value streams for their overseas communications and work efficiency;
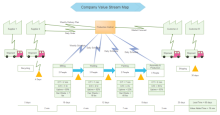
- In manufacturing or logistics companies, value stream maps and value chains are used for identifying competitive advantages and monitoring waste in the production or delivery process by monitoring materials (just like the value streams map example below):
More Value Chain and Value Stream Map Examples and Templates
The following free chart examples and templates includes the main categories of charts for business and educational uses. Feel free to click on any of them to see more details.
Create Your Business Diagram Right Now
You can easily create any kinds of value chain and value stream maps by using the preset auto-create options to change themes, colors and fonts. It is also conveniently to directly drag and drop any built-in business diagram symbols on your drawing board. Have a try right now by clicking on the free download buttons at the end of this page.
Explore More:


