What is a Stem and Leaf Plot?
Know it All about Stem and Leaf Plot
The Stem and Leaf plot is a concept in mathematics that makes it more fun. In addition to this, aside from making it more fun, it helps in dealing with loads of data efficiently and effectively. The “stem” is basically on the left side that displays the first digit. However, the “leaf” is on the right side. And the main purpose of the leaf is to display the last digits.
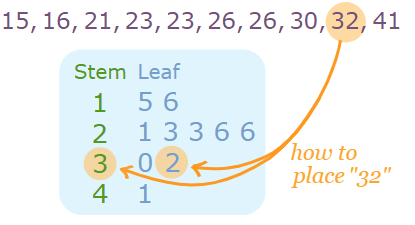
Source: www.mathsisfun.com
The Stem and Leaf plot has made our lives much easier. Such diagrams help us tackle the data smartly. Furthermore, since it spreads the data, it improves its readability. So, one could never miss out on any number while playing with the data.
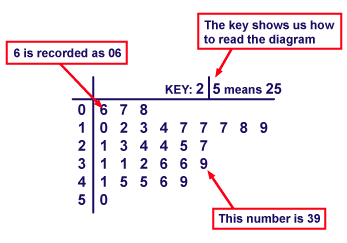
Source: scottstemmath.weebly.com
A stem and leaf plot is a unique table that helps us smartly split the data. For example, 568 and 561 can be split and written like 56 | 8,1. This has improved its readability. Such diagrams have eased inferential and nonparametric statistics.
This diagram is from Arthur Bowley’s work in 1990 and is considered one of the smart tools in exploratory data analysis. The tool got popular and was widely being used by mathematicians and researchers.
They differ from Histograms and hence, are more valuable than any of the whilom tools in mathematics. Credit goes to Mr. Arthur, whose work had helped the evolution of Stem and Leaf diagrams that are widely being used in research and mathematics as of now.
The Stem and Leaf plot is primarily a table that is separated by a vertical line. Thus, the left column has all the stems, and the right column has all the leaves that contain numbers associated with the numbers in the left column.
See the below diagram for your reference. The diagram shows two columns, left and right, for stem and leaf, respectively. Some data is given in the rectangular box and then that data is plotted into the diagram to improve the readability.
As mentioned above, Stem and Leaf plots are widely being used in mathematics and research. This is because it splits the data in a smart way and enhances its ability. In addition to this, it has extensive use in exploratory research as well. Other than this, the Stem and Leaf plots are also being used in:
The Stem and Leaf plot is not complex anymore. In fact, it is fun. It has made mathematics fun for us. Thus, if you plan to create your own diagram, you can follow the below-mentioned steps one by one.
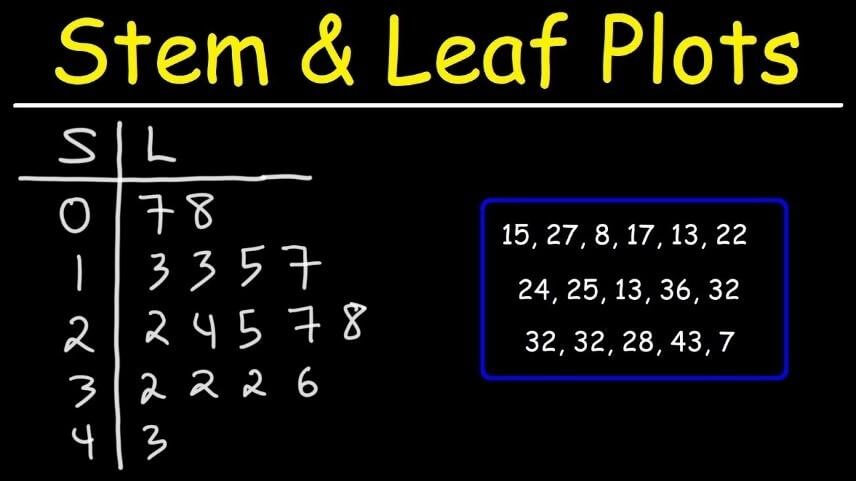
Let’s consider the example mentioned in the above picture. First, the set of the data is given. All you need to do is identify the smallest and the largest numbers from the data, which are 7 and 43, respectively.
Now all you need to do is identify the stems from the data. This means splitting the data (numbers) into two parts. Since there are two digits in each number, you can split the numbers and identify the first digit as the stem. In contrast, the second digit of each number would be considered as the leaf.
Now draw a vertical line giving you two columns. Mention all the stems in the left column and all the leaves in the right column. In this way, you will end up splitting the data.
Since a single stem can have multiple leaves. Therefore, mention all the leaves with the stem they are associated with and cross-check it against the given data to make sure if you have written all the figures.
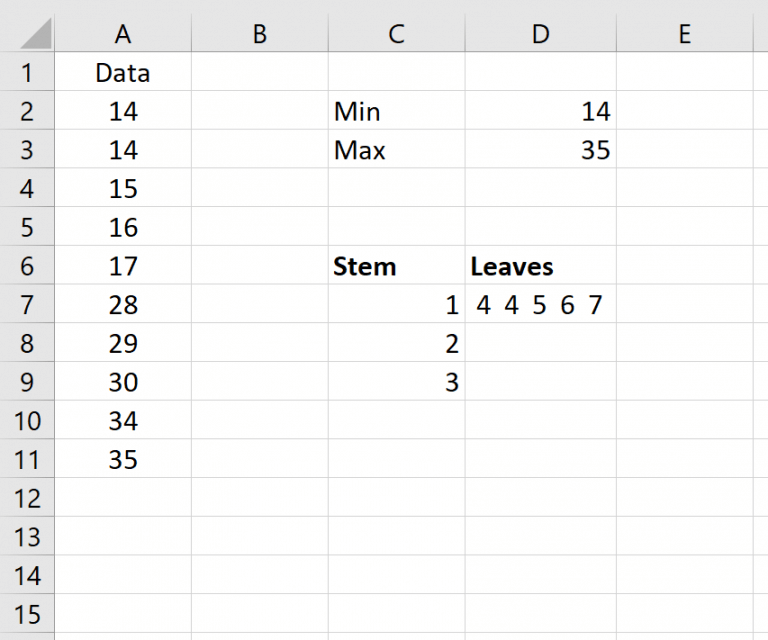
Creating a Stem and Leaf diagram in Excel is as easy as creating it on paper. We have mentioned the steps for you. Following the below-mentioned method, you will be able to create a Plot and Leaf diagram in Excel. Let’s begin.
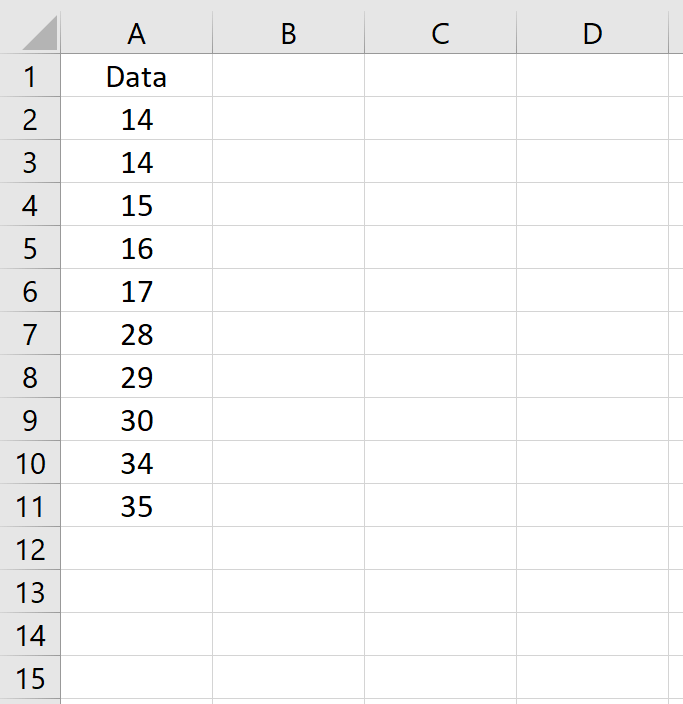
In a single column, enter all the data values you are given.
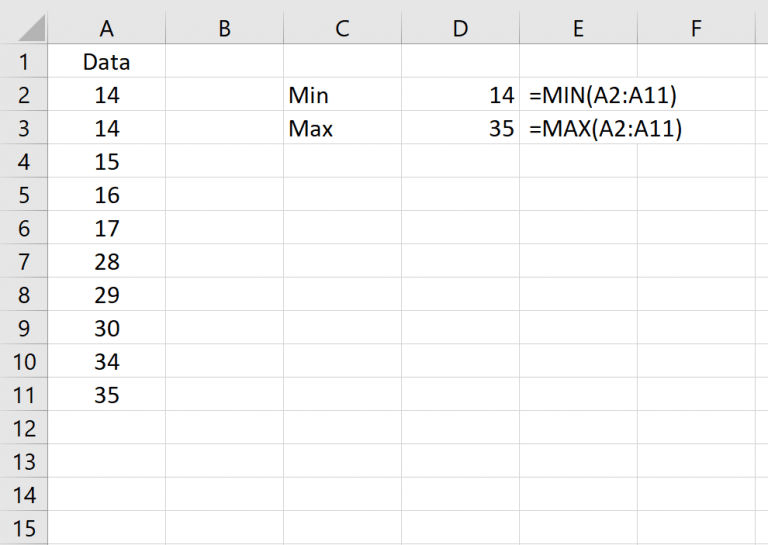
Write the formula in Excel and find out the minimum and maximum values in the set.
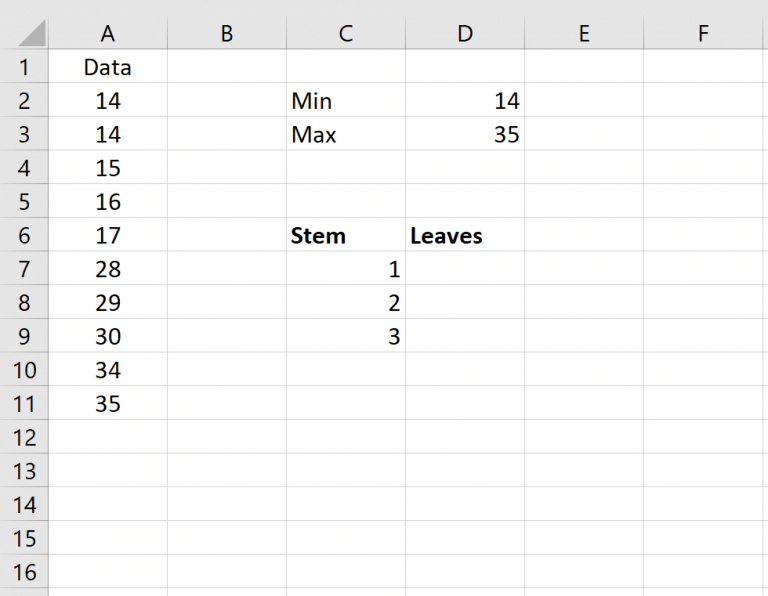
Input the stems manually in the other column.
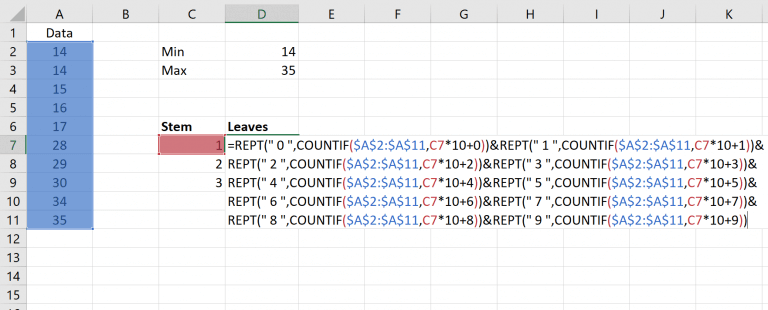
Input the formula and calculate the leaves. Once you calculate it for the first row, drag it down, and repeat the same procedure for every row.
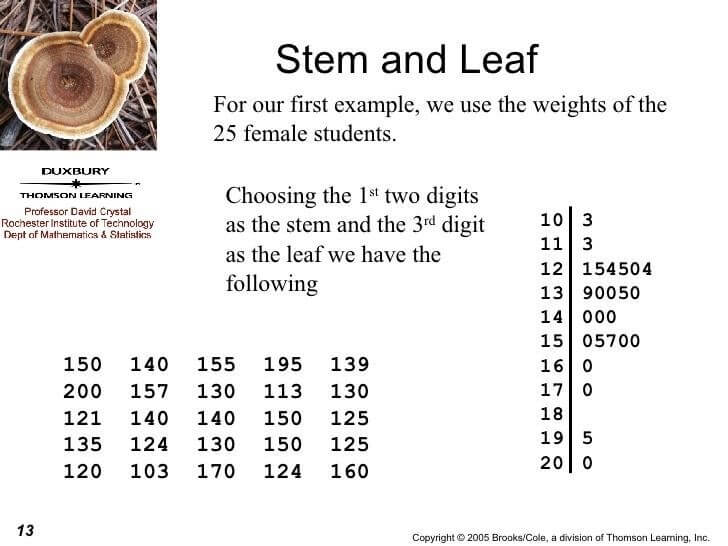
For Stem and Leaf plots with hundreds, there are three digits. So, the method is to mention the first two digits in the first column of the stem. And the rest of the digits are mentioned in the second column of “Leaf”.
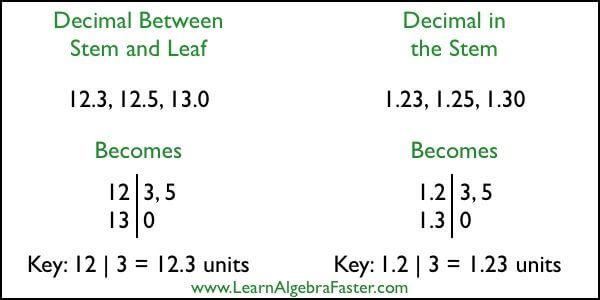
So, this is the case of decimal numbers. As mentioned in the picture, the first two digits, including the decimal point, are written in the first column. And the rest of the digits are mentioned in the second column.
All in all, stem and leaf plots are a visual representation of a large set of data that we break down smartly. They are being used widely in many areas like Mathematics and research, and yet there are many tools available that can help you draw your own Stem and Leaf diagram. However, the best tool that professionals recommend is EdrawMax. It has thousands of built-in tools and techniques that you can use to develop the Stem and Leaf Plot.

・ Simple alternative to Visio
・ 26k+ symbols
・ 10K+ free templates
・ 10+ AI diagram generators


