BCG Matrix
Know it All about BCG Matrix
First, BCG is an acronym that stands for Boston Consulting Group – the developers of this BCG matrix.
Therefore, a BCG matrix is a corporate portfolio analysis tool that helps businesses with long-term strategic planning. With it, a company can easily decide where to invest, develop, or discontinue products by simply evaluating its growth opportunities by accessing its product portfolio.
The analysis is provided in a graphical representation that is relatively easy to analyze as well as understand. A matrix diagram can help analyze data in a single group or compare two or more pieces of data at once. Keep in mind that it can be used to compare people, data, materials, equipment, including other things.
KEY Notes:
a) Market Growth Rate = company sales this year – company sales last year.
b) Relative Market Share = Your Strategic Business Unit (SBU) Sales this year – Leading competitors’ sales this year, Or

You might wonder Why should I use the BCG matrix & what are its purposes really?
The purposes of a BCG matrix are:
The following are the benefits of a BCG matrix:
A BCG matrix comprises four distinct categories, namely Dogs, Question marks, Stars, and Cash Cows. So, what does each component mean or stands for?
BCG matrix will always be a helpful tool when used accordingly. Below are five steps on which to perform a proper BCG matrix analysis:
Step 1. Select the unit to be analyzed:
This is the first step and probably one of the essential steps. Keep in mind that a unit refers to a firm, product, separate brand, or SBUs. Thus, it is good to clearly define the unit to be analyzed since the selected unit will definitely have an effect on the whole analysis.
Step 2. Define the market:
Market definition is necessary for any BCG analysis since you will have poor classification with an incorrectly defined market. Defining the market will help better understand the unit’s portfolio position.
Step 3. Calculate your firm’s relative market share:
Use the relative market share formula give above to calculate your firm’s relative market share. Keep in mind that you can calculate relative market share in two ways: using market share or using revenue. This will be shown on your X-axis in the BCG matrix.
Step 4. Determine your firm’s market growth rate:
You can determine your company’s market growth rate by comparing company sales this year with company sales last year. These values will be represented in percentage, and you can compare them with leading companies to get definitive measures and results.
Step 5. Draw a BCG matrix:
After competing for all the calculations, you can now plot your firm’s BCG matrix using those values. So, to illustrate your values on the BCG matrix table, you can use the circle to represent each brand. The size of each circle should clearly match the amount of business revenue generated by that brand. For example,
Step 1: Open EdrawMax
Download and open EdrawMax desktop software .

・ Simple alternative to Visio
・ 26k+ symbols
・ 10K+ free templates
・ 10+ AI diagram generators
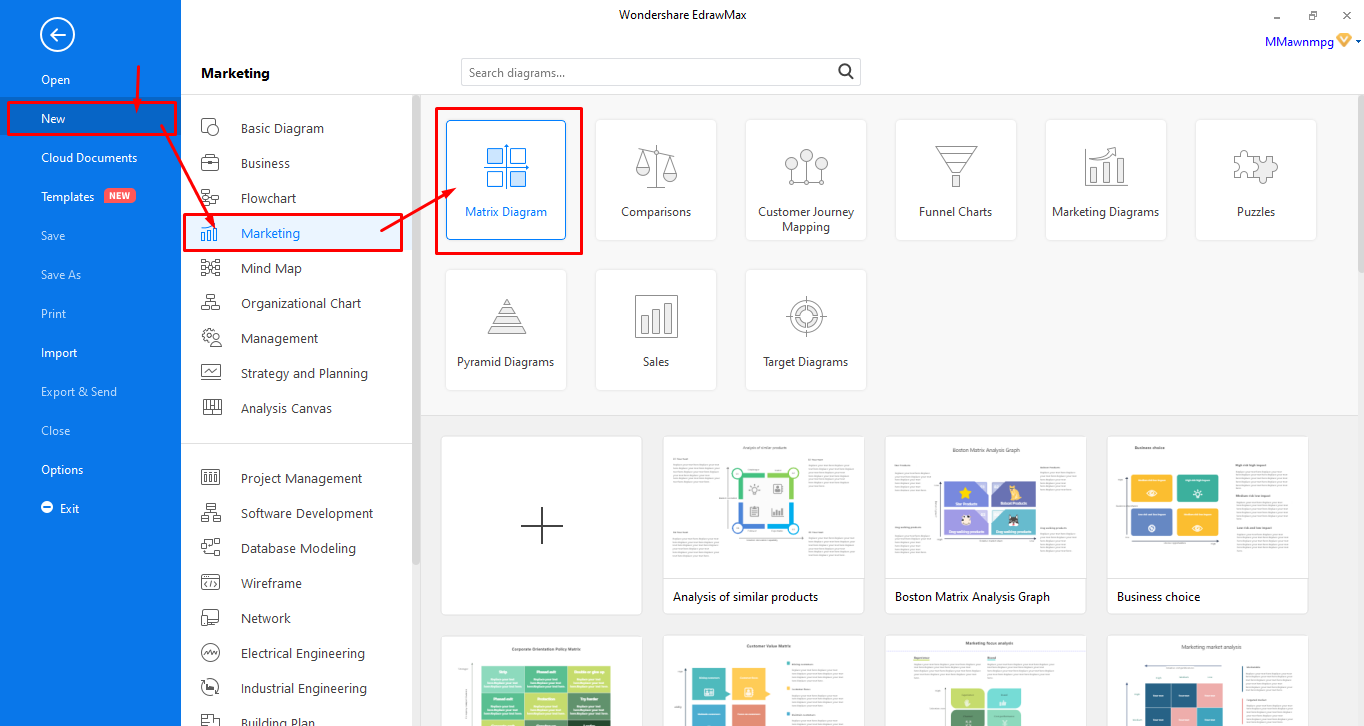
Step 2: Select Matric Diagram
On the blue navigation pane situated to your left side of your screen, navigate to [New], then select [Marketing] > [Matrix Diagram] and let it load.
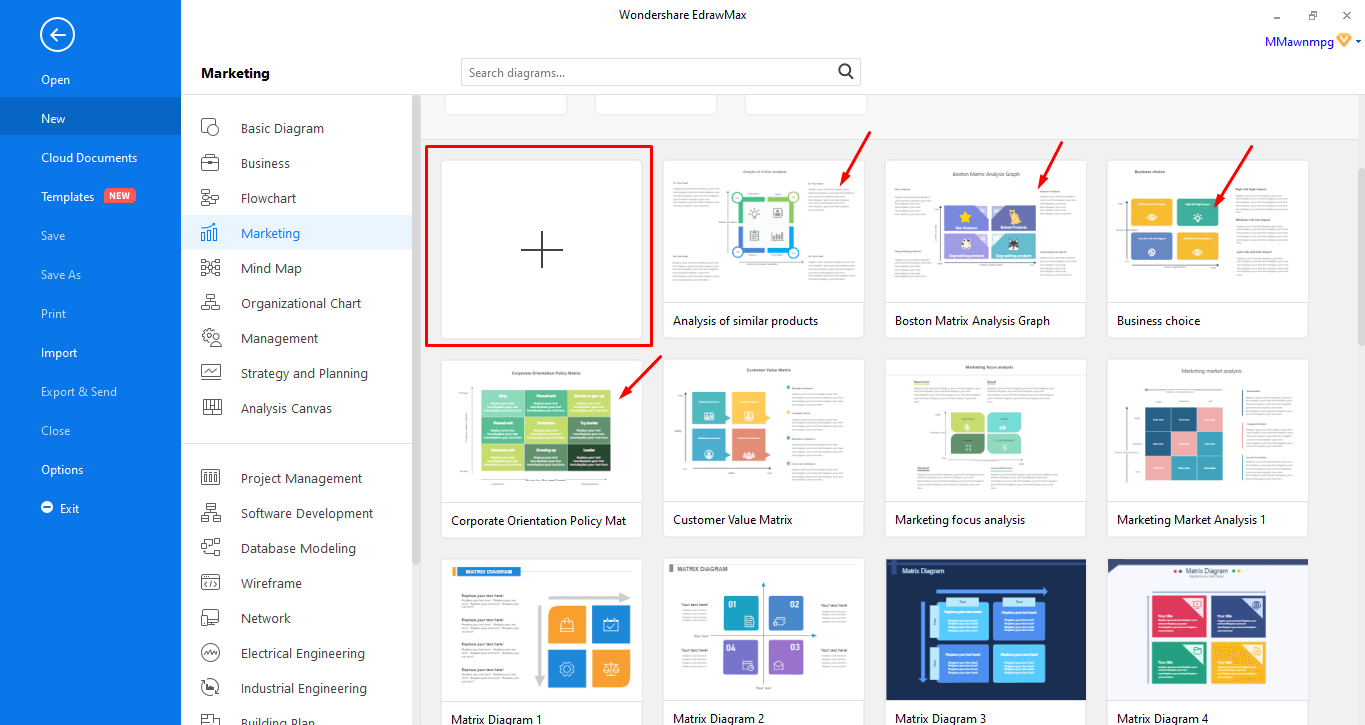
Step 3: Select the template or Create from scratch
In this step, you will have to choose which option you will use before heading over to the designing process. You will have two options:
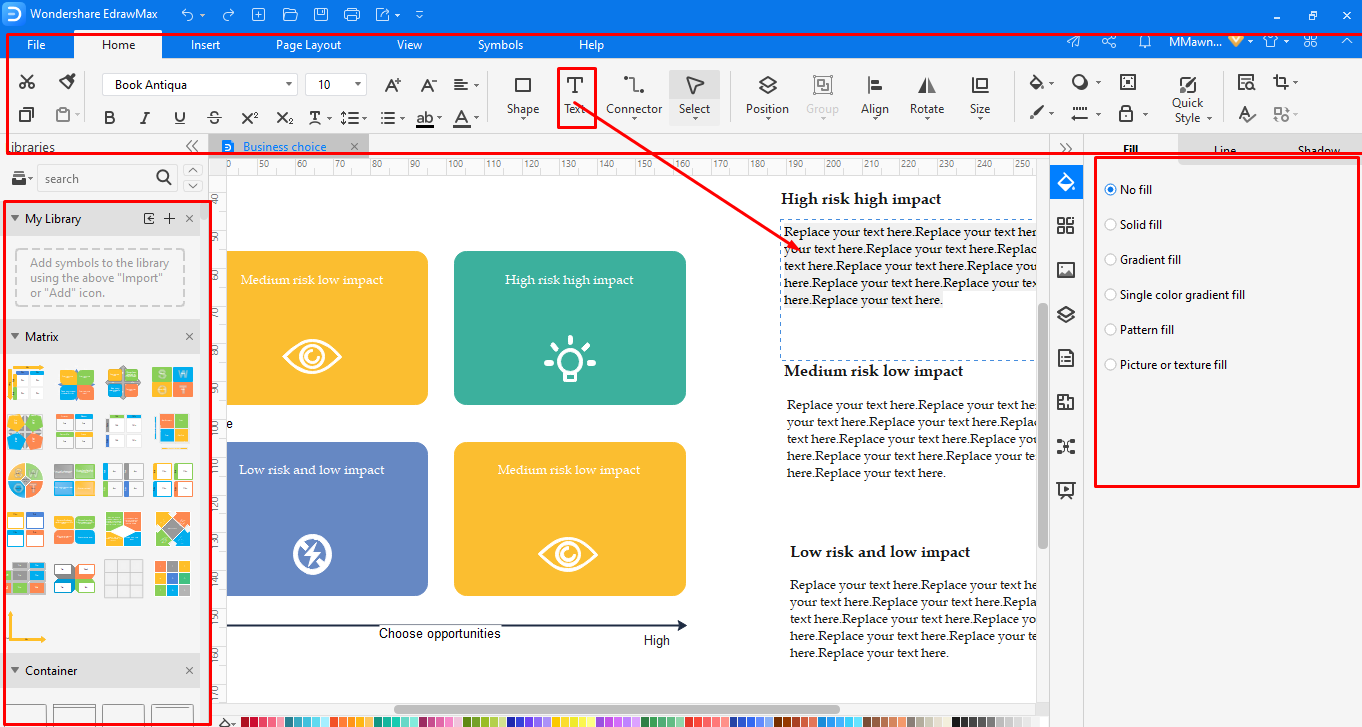
Step 4: Edit or Design your diagram
Well, regardless of your choice, whether you chose to go with one or two, you will still need to do some editing and designing to create a complete BCG matrix diagram. Don’t worry; it is quite a simple process that will involve dragging and dropping symbols on the blank page, adjusting size, color shape, and adding text.
All the required tools for any of these processes are included and clearly labeled here.
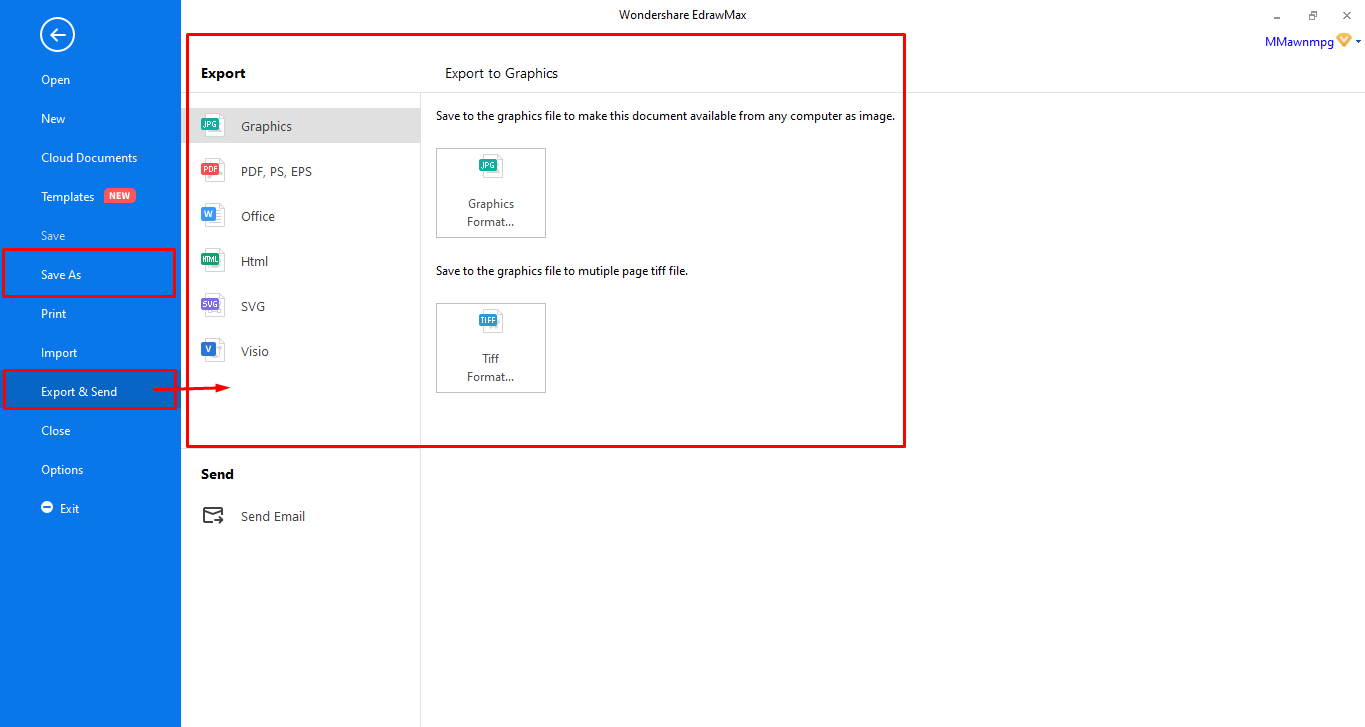
Step 5: Save, Export, and Share
This is the final step. In this step, you can save, export, or share your complete file by clicking on File], and a blue navigation pane will (if using software) appear – there, you can choose what to do next. Also, you should know that EdrawMax allows you to export your file in different formats.
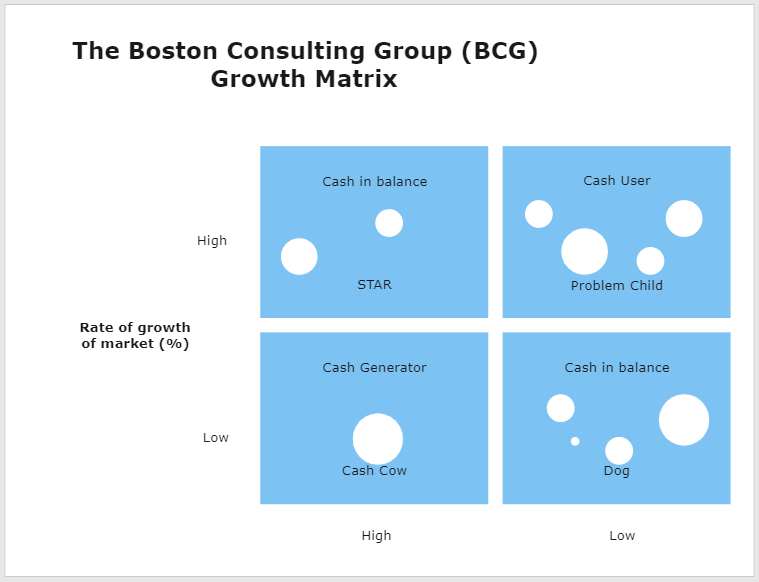
The diagram below is a Boston Consulting Group (BCG) Growth Matrix, which shows their planning strategy. This technique focuses on products and services’ graphical representation to analyze and determine whether this group should hold products, sell products, or invest in a new market.