Ishikawa Diagram
Part 1: What is Ishikawa Diagram
Quality innovator Kaoru Ishikawa developed Ishikawa diagram during the 1960s. He aimed at using it as a way of measuring quality control processes in the shipbuilding industry. It has performed so well that it is now known as one of the top quality tools.
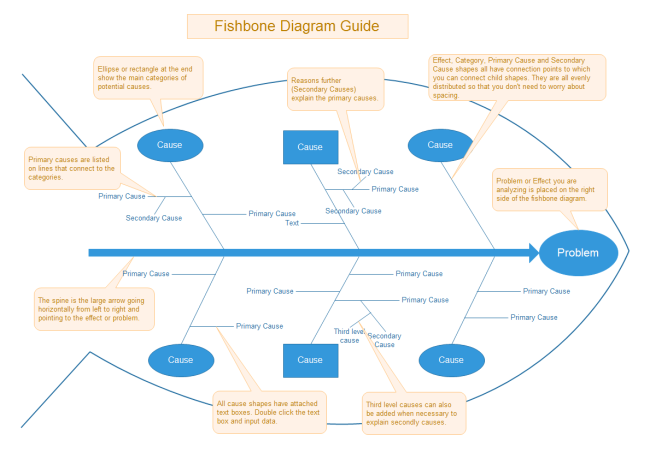
It is a visual representation of problems to detect the causes and effects. The layout of the Ishikawa diagram is similar to a fish's skeleton. It shows the issue at the head and the causes at the spine. Other names for Ishikawa Diagram are fishbone diagram and cause and effect diagram.
Ishikawa diagram is also used in manufacturing and product development for quality control. It helps outline the different steps in the process to pre-empt quality issues and resource allocation.
Part 2: Purpose and benefit
Ishikawa diagram was conceived as a tool to aid in problem-solving. However, it has proved its talent now and is being used for many versatile purposes. It is a functional tool to break down all contributing factors to the problem or event in a hierarchical manner.
Ishikawa diagrams can be used as a tool in the following scenarios.
- Analysis of problem statements. In this case, the problem statement is written in the head section of the Ishikawa diagram, and the causes and effects come as the branches on the spine.
- Root cause analysis. It is usually done through brainstorming sessions, and the outcomes are recorded as Ishikawa diagrams. Further categorization and refinement of causes lead to the identification of the actual root cause.
- To analyze a new design.The newly proposed methods are presented to the experts' group for the preliminary analysis. They may identify different use cases to test the product. Market analysis and competitor review are also a part of this analysis.
- Process improvement.Continuous process improvement is a critical process in both manufacturing and services. An Ishikawa diagram helps identify the areas for continuous process improvement by removing non-value added activities and creating a more stable operation.
- Quality improvement. As we said earlier, the Ishikawa diagram is one of the top seven quality tools. Quality of product or service is continuously analyzed using the Ishikawa diagram as a reference. If a problem arises, it is analyzed using the same tool. It is also used for the prediction of issues to maintain the quality by pre-empting the problem.
Part 3: What to do before creating Ishikawa Diagram
Accuracy and efficiency are critical in making the Ishikawa diagram because the solution depends on the correct identification of causes and effects. Here are some guidelines to follow while creating these diagrams.
- All the participants must agree on a problem statement.
- Write the problem statement at a visible place like a whiteboard for quick reference.
- Encourage all participants to contribute and brainstorm the primary categories of causes for the problem. You may start with a generic outline and gradually make it more specific.
- Categorize the causes correctly and write them as branches. Causes can be written in several places if they relate to several categories.
- Keep asking 'Why?' to dig deeper into the problem statement.
- When the group is running out of new ideas, focus attention on areas where ideas are scarce.
Part 4: How to make Ishikawa Diagram in EdrawMax
Computer software can help you draw professional-looking diagrams quickly and within less time. We recommend using EdrawMax as your drawing tool to create Ishikawa diagrams. It can make drawing and editing the charts efficient and straightforward.
Another important benefit of using EdrawMax is its export feature. You can save and export your Diagram in many formats, for instance, JPEG, PowerPoint, PDF, and many more.
Let us outline the steps involved in making a cause and effect diagram in EdrawMax.
Step 1: Launch the EdrawMax Software
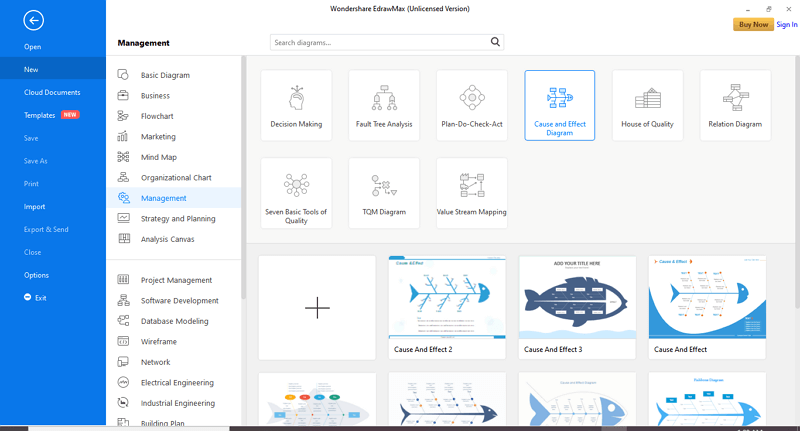
Step 2: Pick an Ishikawa Diagram Template
Goto New > Management and click the Cause and Effect Diagram button from the top. Now, choose a preferred diagram template.
If you want to make your own thing, you can use the "+" button to open a new document and start creating your own Ishikawa diagram from scratch. You will use the symbols in the Symbol Library on the left.
Step 3: Add details to the Diagram
Double-click the text placeholder at the fish mouth. Here you will fill in the problem description. Next, double-click the other text boxes and label the categories and branches with their relevant titles.
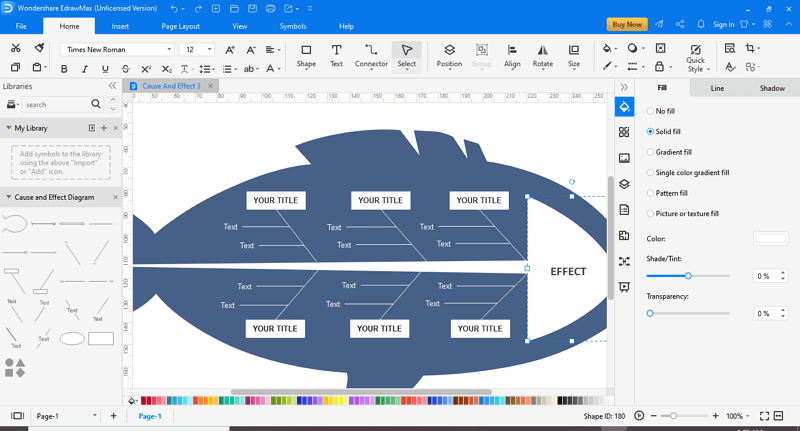
Continue adding more categories and branches. You can double-click an appropriate symbol from the Symbol Library on the left.
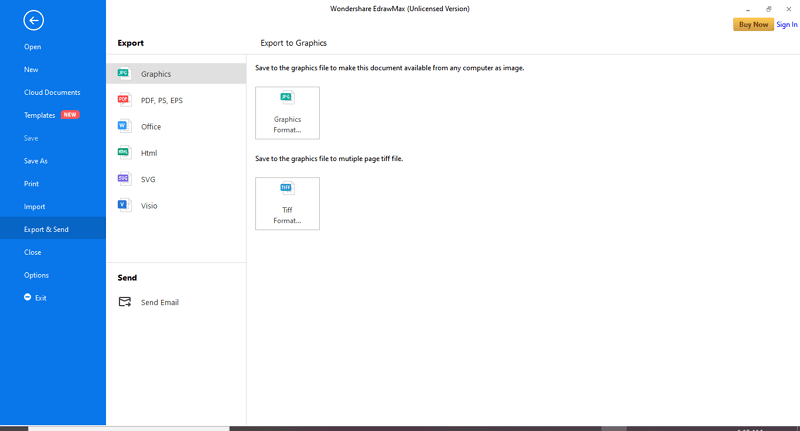
Step 4: Save or Export Your Diagram
Click File from the menu bar at the top, and click Save As or Export to save your Diagram to save or export your Diagram in many available file formats such as a PowerPoint, Word Document, PDF, or Scalable Vector Graphics (SVG).

An all-in-one platform for 210+ diagrams.
・ Simple alternative to Visio
・ 26k+ symbols
・ 10K+ free templates
・ 10+ AI diagram generators


Part 5: Tip for making Ishikawa Diagram
When you have drawn the spine, now several categories will branch out. These categories can be custom-defined. Choosing the wrong categories may lead to significant scale implications. Therefore, if the situation permits, you can strive to use the predefined classes.
Some of the most commonly used categories in the industry are listed for your reference. :
The 8 M’s in Manufacturing
- Machine (technology)
- Method (process)
- Material ( Raw Material, Consumables, and Information.)
- Man Power (physical work)/Mind Power (brain work) Suggestions
- Measurement (Inspection)
- Milieu/Mother Nature (Environment)
- Management/Money Power
- Maintenance
The 8 P’s in Service Industry:
- Product/Service
- Price
- Place
- Promotion/Entertainment
- People
- Process
- Physical Evidence
- Productivity & Quality
The 5 P’s in Service Industry:
- Surroundings
- Suppliers
- Systems
- Skills
- Safety
Part 6: Rich Ishkawa Diagram Templates and Examples
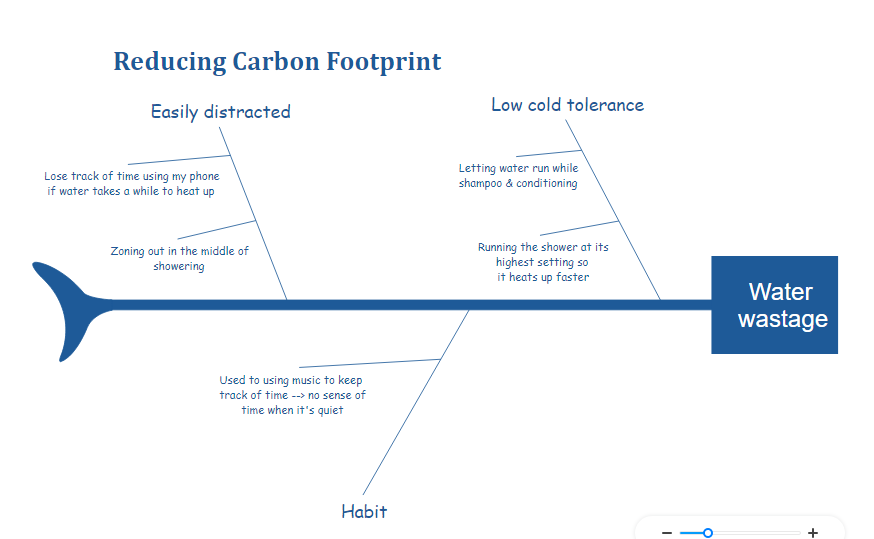
This Diagram visually discusses the cause and effects of water wastage. It shows low tolerance causes as letting the water run while shampooing and conditioning. It also shows the water wastage can be an effect of a habit. If someone loses track of time, she will probably spend more time under the shower. This Ishikawa diagram can be used to teach how the water is wasted during the day-to-day chores.
Ishikawa diagram is a critical quality tool; however its success lies in its clarity, readability, and correctness. We strongly recommend thorough analysis and brainstorming sessions before attempting to design a diagram. A wrong Ishikawa diagram may lead to a disaster.
Many amazing Ishkawa diagram templates and examples are included in the program or posted online. Beginning from templates and examples is really fairly simple.


