Cause and Effect Tool in Six Sigma
Cause and Effect (Fishbone) Diagram
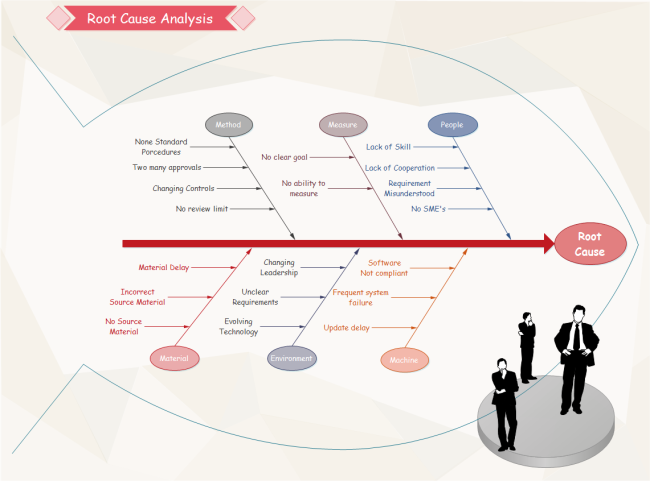
A cause and effect diagram, also known as a "fishbone" diagram, can help in brainstorming to identify possible causes of a problem and in sorting ideas into useful categories, which is a common tool using in six sigma programs for root cause analysis. The fishbone will help to visually display the many potential causes for a specific problem or effect. It's particularly useful when capturing different ideas when there are many opinions in root cause identification.
Discover More Six Sigma Tools and Templates
Fishbone Suggested Categories
- 6 Ms: Machine, Method, Material, Man Power, Measurement, Mother Nature (Environment).
- 7 Ps: Product, Price, Place, Promotion, People, Positioning, Packaging
- 5 Ss: Surroundings, Suppliers, Systems, Skills, Safety
How to Create Cause-Effect Diagram For Six Sigma Initiative
Step 1: First you need to state a problem. Be as clear and specific as you can about the problem. This is written at the mouth of the "fish."
Step 2: Identify major categories of causes of the problem. They are branches extended from the trunk. (Refer to suggested categories of the upper part.)
Step 3: Brainstorm all causes of the problem, collect all opinions and add them to appropriate categories. Causes can be written in more than one places.
Step 4: Write sub causes branching of the branches. Continue to ask "Why?" and generate deeper levels of causes.
More Cause and Effect Diagram Templates
Edraw is a professional fishbone diagram mapping tool coming with standard built-in fishbone diagram symbols and presentation quality templates.All templates in Edraw are customizable. It's easy to change colors, theme and effect to achieve great results. A group of nice pre-defined themes allow you to instantly personalize your drawing with a professional look, fast and effective. Try a ready-made template to assist with your fishbone diagram design.
More Six Sigma Tools in Edraw
Edraw is an all-in-one visualization software containing flexible tools for different needs. Besides fishbone diagram, Edraw also provides solutions for SIPOC diagram, Cause-Effect Diagram, Value Stream Mapping, Brainstorming, QFD, Affinity Diagram, Scatter Plot, RACI matrix, PDCA diagram, and much more to help finish your six sigma. Among the best diagramming tools available, this software is perfect for experienced diagram designers or those who are just getting started.
Download a free trial and see first-hand how quickly and easily you can create effective great-looking cause and effect diagrams.
More Resources
Pareto Chart - A Six Sigma Tool for Measuring Process Performance


