Euler Diagram - Definition, Templates, Tool
What is an Euler Diagram
An Euler diagram is a graphic tool representing the relationships of subjects in this graphic. Euler diagrams often are used in education and business fields.
Compared to Venn diagrams, the Euler diagram only has relevant connections between topics. For example, the living creatures all having four legs are animals, but not all animals would have four legs, such as fish. It only has one tail, but it belongs to the animal family. From this perspective, it is clear to see the relationship between animals and four legs. In math, we call it the inclusion relation.
The four legs are a subset of animals. However, the mineral is irrelative with animals because there are no similarities; another blue circle represents the mineral. And there are not any overlapping parts between the circle of animal and mineral.
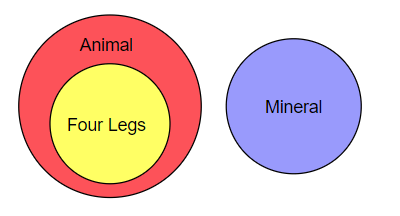
Image source: en.wikipedia.org
Another example of an Euler diagram is the relationships between different Solar System objects.
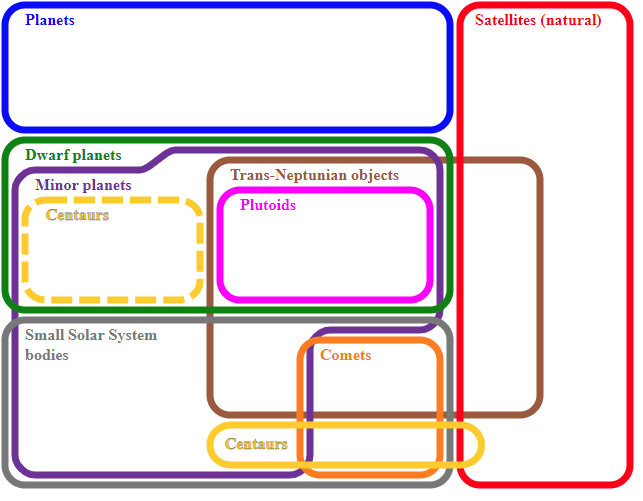
Image source: en.wikipedia.org
First, the plane is separated by the curves of the Euler diagram into two parts; the interior zone represents the elements of sets, while the exterior shows all elements excluding the planet sets. Also, the overlap curves only mean the inclusion relation. If no curves are crossing and intersecting, elements are not members of the sets.
The common elements to both sets only in the overlapped zone inside both curves, and the subset of one set is encircled by the curves within the interior of another set. From this picture, it is clear to see how different the Euler diagram is and how to clarify the complex subjects.
Therefore, Euler diagrams consist of a few clear shapes or circles, demonstrating the positive relationships between these sets.
Venn Diagrams vs. Euler Diagrams
Most people are confused about the Venn diagrams and Euler diagrams. "Eulerian circles, " coined by the Swiss mathematician Leonhard Euler (1707–1783), are incorporated together with Venn diagrams as the instruction tools of set theory.
Venn diagrams, the more creative form of Euler diagrams, consist of all 2n logically possible zones of overlap between its n curves and focus on the all relationships inclusion/exclusion of its constituent sets. The black indicates the exclusion regions, which means the regions excluding the set would be black.
However, Euler diagrams only should be colored by the overlap, which means the regions only including the set would be colored. Therefore, the most significant difference is the overlapping relationship parts. Commonly, the relationships could divide into two parts: relevance and irrelevance. The Venn diagram would show both relevance and irrelevance between subjects, but either relevance or irrelevance would exist in the Euler diagrams.
Taking the mammals and birds as an example, birds cannot be sort into mammals because birds are egg-laying species instead of the viviparous ones, so birds are irrelevant to mammals. In the Venn diagram, the circles of mammals and birds representatively should be overlapped, while their circles in the Euler diagram should not be intersected. Therefore, the Venn and Euler diagrams show the irrelevance of subjects in a totally different way.
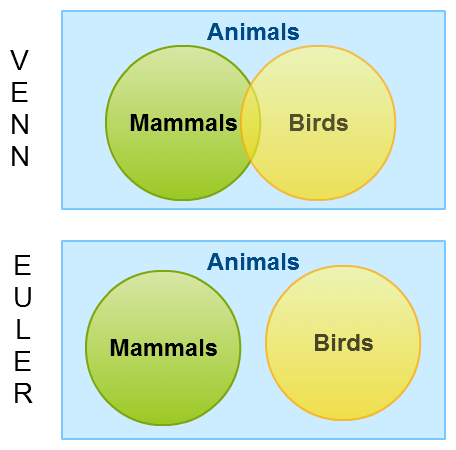
Image source: creately.com
Euler Diagram Templates
1. This template shows the countries' relationships in British Isles.
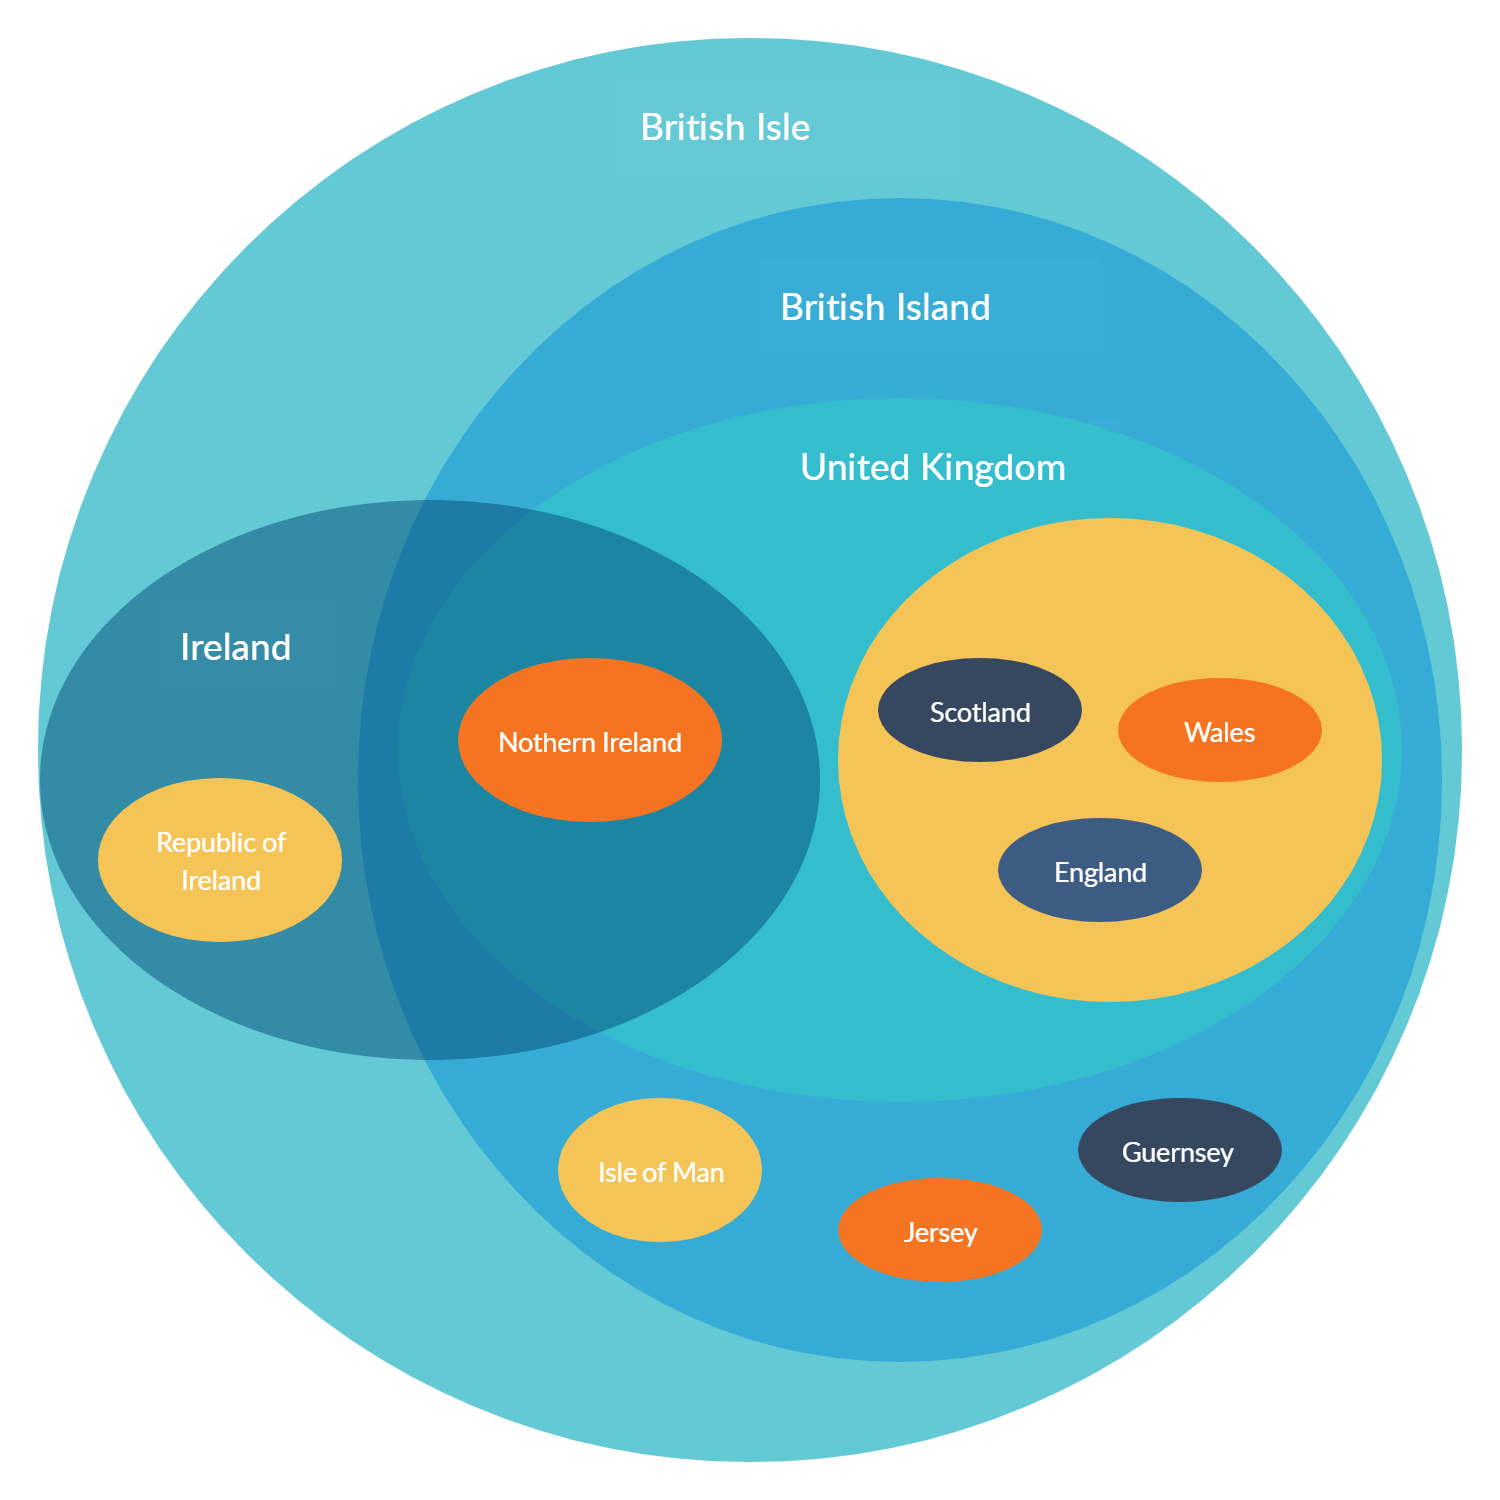
Image source: pinterest.ca
2: The template shows the color relationships in cards.
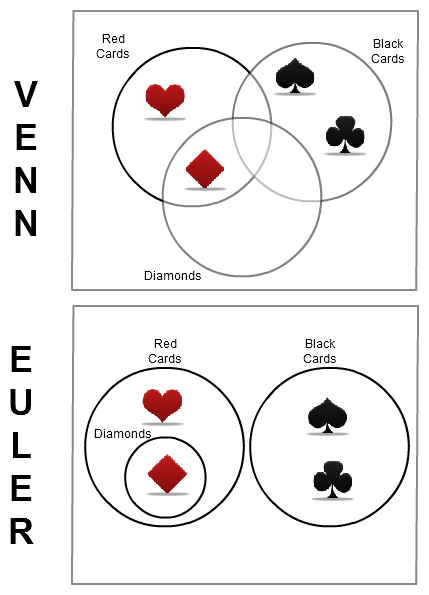
Image source: /creately.com/
3: This template demonstrates the relationships among magic, wizards, and lizards. Magic includes wizards but irrelevant to lizards.
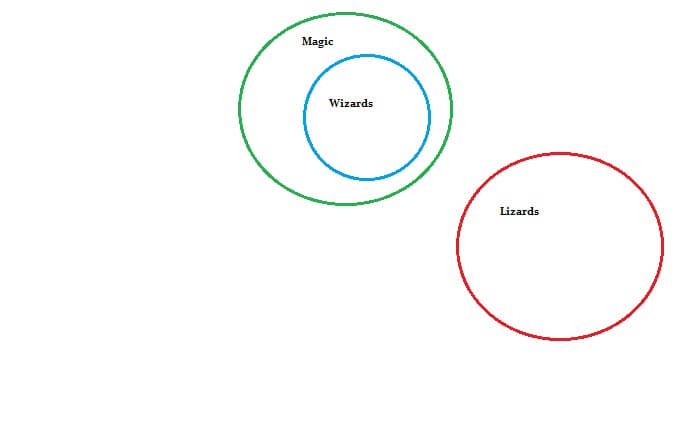
Image source: statisticshowto.com
4: This Euler diagram demonstrates the geographic relationships of the Oceania region, which parts into 4 sub-regions: Melanesia, Micronesia, Polynesia, and Australasia.
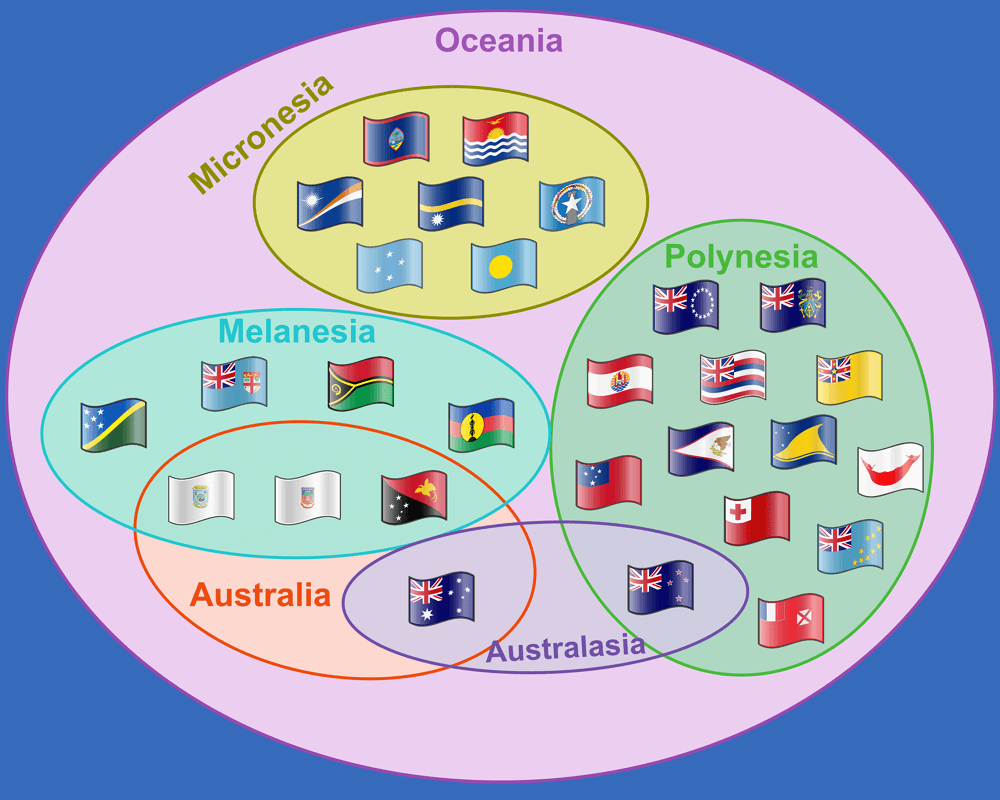
Image source: reddit.com

An all-in-one platform for 210+ diagrams.
・ Simple alternative to Visio
・ 26k+ symbols
・ 10K+ free templates
・ 10+ AI diagram generators


How to Make an Euler Diagram
Any graphic tools and software you all can use, but if you have to make complex Euler diagrams, EdrawMax could be one of your choices.
Step 1: Thinking of your purpose and usage of your Euler diagrams.
- How many sharps or circles should you need?
- What relationships are your topics interacting with?
Step 2: To find the format and sharps you want and insect.
Step 3: Quickly save and download the vision you want.
If you are going to create complex Euler diagrams, it is an all-in-one diagramming tool with personalized custom designs and massive template offers.
Tips for Making an Euler Diagram
There are some restrictions for making Euler diagrams:
1: The first is a Venn diagram with 4 contours, not the standard Euler diagram, but the second two is. The difference is related to aesthetic appearance. The second one with circles could make diagrams more comprehensible and compare the elements in each set. Also, the change is more effective for people to grasp the information the diagram makers present.
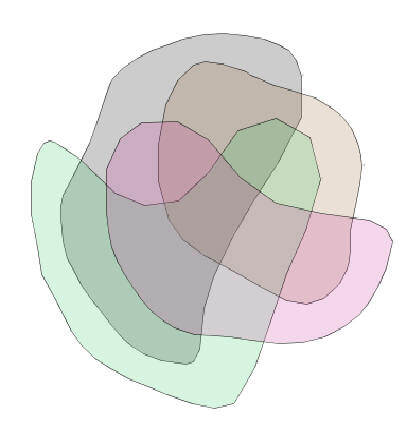
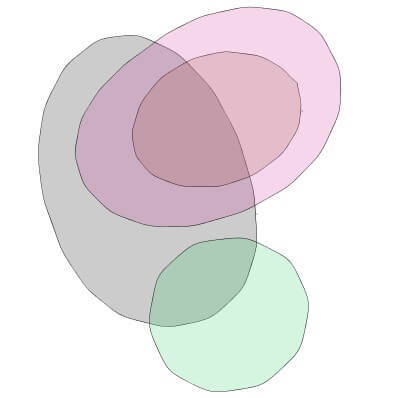
Image source: cs.kent.ac.uk
The first is a Venn diagram with 4 contours, not the standard Euler diagram, but the second two is. The difference is related to the aesthetic appearance.
The second one with circles could make diagrams more comprehensible and compare the elements in each set. Also, the change is more effective for people to grasp the information the diagram makers present.
2: There are only two contours intersecting at the given point because of the impracticality of triple points. As the picture you saw, this is not allowed to draw. If you do so, this would be the Venn diagrams, not the Euler diagrams. Please take more time on examples and templates of Euler diagrams.
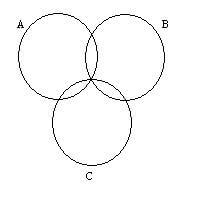
Image source: cs.kent.ac.uk
This diagram also is not the standard Euler diagram because A, B, C zones are represented and intersected by a triple point. This break rules 2 and 4.
3: Because the border of contours cannot be demonstrated by line segments, it cannot be Concurrent contours.
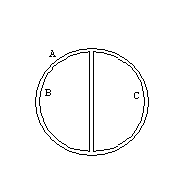
Image source: cs.kent.ac.uk
This diagram shows the AB and AC zones, and two zones belong to one set. However, AB and AC zones have not common elements.
4: In Euler diagrams, the disconnected zones should not appear twice or more.
5: It is not allowed to cross contours in the Euler diagrams if the contours of Euler diagrams are the simple curves.
Conclusion
The key to master the Euler diagrams is to acquire the difference between Venn and Euler diagrams. The making process is not very hard for people, so before drawing Euler diagrams, you could find more templates and examples to go through and think of how to represent your idea on this diagram based on other creative Euler diagrams. Practice makes perfect.

