
Gantt Chart Vs Pert Chart: Which one is better? Both PERT and Gantt charts are used to visualize a project better. While one is important to manage detailed tasks, the other can help users with realistic timelines. Yet, having an idea of which type of diagram works best for you can be a bit challenging.
Here is a quick guide to help you determine which will suit your requirements. Also, this article will introduce you to the chart-maker program EdrawMax. Its large collection of ready-made chart templates is totally worth your attention. Check out these simple steps to create these charts from scratch in no time.
In this article
-
What is a Gantt and PERT Chart?
- General Differences: Gantt Chart Vs. PERT Chart
-
When to Use Gantt Chart or PERT Chart
-
How to Create a Gantt Chart or PERT Chart Easily
- Best Gantt Charts and Pert Chart Templates
- Conclusion
What is a Gantt and PERT Chart?
What is a Gantt Chart?
Named after Henry Gantt, it is a type of bar chart that allows you to visualize tasks. It is for project managers to plan their projects over a duration. These charts best represent the task dependencies or the task's order. So, having all the tasks on one page allows the entire team to have future goals and keep the progress in check. Gantt chart comprises vertical and horizontal series, each for a specific purpose:
- The vertical series is for the tasks you have to complete.
- The horizontal series lets you decide the time span of the project.
Pros and Cons of Gantt Charts
Gantt charts are popular tools for estimating the duration of a project. These bar charts allow you to manage the timelines and task tendencies easily. Likewise, the entire team gets to monitor the progress and modify the data structures.
What is a PERT Chart?
PERT or Program Evaluation and Review Technique is one of the types of network diagrams. The layout is similar to a flowchart that uses different elements like boxes, circles, and arrows to connect each task. It is for users to design, manage, and keep a record of multiple tasks within a project.
This type of chart works best for the planning phase. It is because each task is in detail and separate from the other. Hence, you get to have a comprehensive visual plan of the project. With this feature, you also get to know which tasks must be prioritized.
Pros and Cons of PERT Charts
Similarly, PERT charts have their own perks. They work best for complex and subjective projects that require customization. So, with these diagrams, you can estimate realistic timelines, flexible data structures, and straight primary goals.
General Differences: Gantt Chart Vs. PERT Chart
Undoubtedly, both charts use data structures, timelines, and task dependencies to manage tasks. Yet, there are some apparent differences between PERT and Gantt charts, including how they present the data structures, layouts, and more. This quick comparison table shows how you can effectively manage a project using both.
| Gantt Charts | PERT Charts | |
| Chart Development | By Henry Gantt in the 1900s. | By the US Navy in the 1950s |
| Data Structures | Represent data through a bar chart. It represents the tasks and time period over which the project ends. | It is a network diagram that represents the status of task dependencies. Each order is linked through elements within the project. |
| Task Projection | Users get to divide tasks and subtasks within an expected timeframe. | Users can plan each task in detail and manage resources. The dependencies are easy to track. They also can prioritize important tasks. |
| Time Structure | Planning a time is relatively easy. The X-axis represents the duration. | Users get to customize each task time. There is no axis to represent it. |
| Critical Path | Because each task is not detailed, the critical path is challenging to recognize. | Too much focus on the critical path. Users can figure out any lag in the project. |
| Prediction of Task Completion | It is easy for users to estimate the length of the entire project. Yet, they need to manage the time for each task. | The expected time of each task is easy to track. However, the entire project completion can be complicated. |
When to Use Gantt Chart or PERT Chart?
Although both charts are to manage projects, knowing when to use them can simplify your life. While one gives you a detailed analysis of each task, the other helps you manage the timeline. So, make sure to plan each properly for maximum efficiency.
Choose Gantt Chart over PERT Chart
Gantt charts are great for the execution phase for the following reasons:
- Users get to schedule the entire project within the required time.
- Team members can monitor the progress constantly.
- Task dependencies are well-organized.
- The timeline is strictly followed for the due dates.
Choose PERT Chart over Gantt Chart
PERT charts work best to get a proper analysis of the planning phase of the projects. This is because;
- It gives you a project's scope. Users get to document everything from goals to primary and secondary tasks and data structures.
- Estimating the duration of each task is easy.
- Users get to identify the critical path easily.
- The relationship between each task is understandable.
How to Create a Gantt Chart or PERT Chart Easily?
Even though both these charts are challenging to create, knowing the right tool can save a lot of your time. Considering the right tool, EdrawMax is the quickest and most efficient way to design and follow up on any project.
This drawing tool has built-in chart templates and a vast symbol library that can be best utilized to create a Gantt and a PERT chart. So, whether you are stuck in planning the designing or implementation phase while making a chart for your project, its brilliant ready-made designs have got you covered.
EdrawMax is a powerful, all-in-one, and yet easy-to-use diagramming tool that enables users to visualize the ideas effortlessly.
EdrawMax provides beginners and pros the cutting-edge functionalities to build professional-looking diagrams easier, faster, and cheaper! It allows you to create more than 280 types of diagrams and should be an excellent Visio alternative.
Create a Gantt Chart on EdrawMax in 4 Simple Steps
Making a Gantt chart on EdrawMax is no challenge at all. All thanks to its built-in templates, the process takes no time. Follow these steps and make yourself one from scratch.
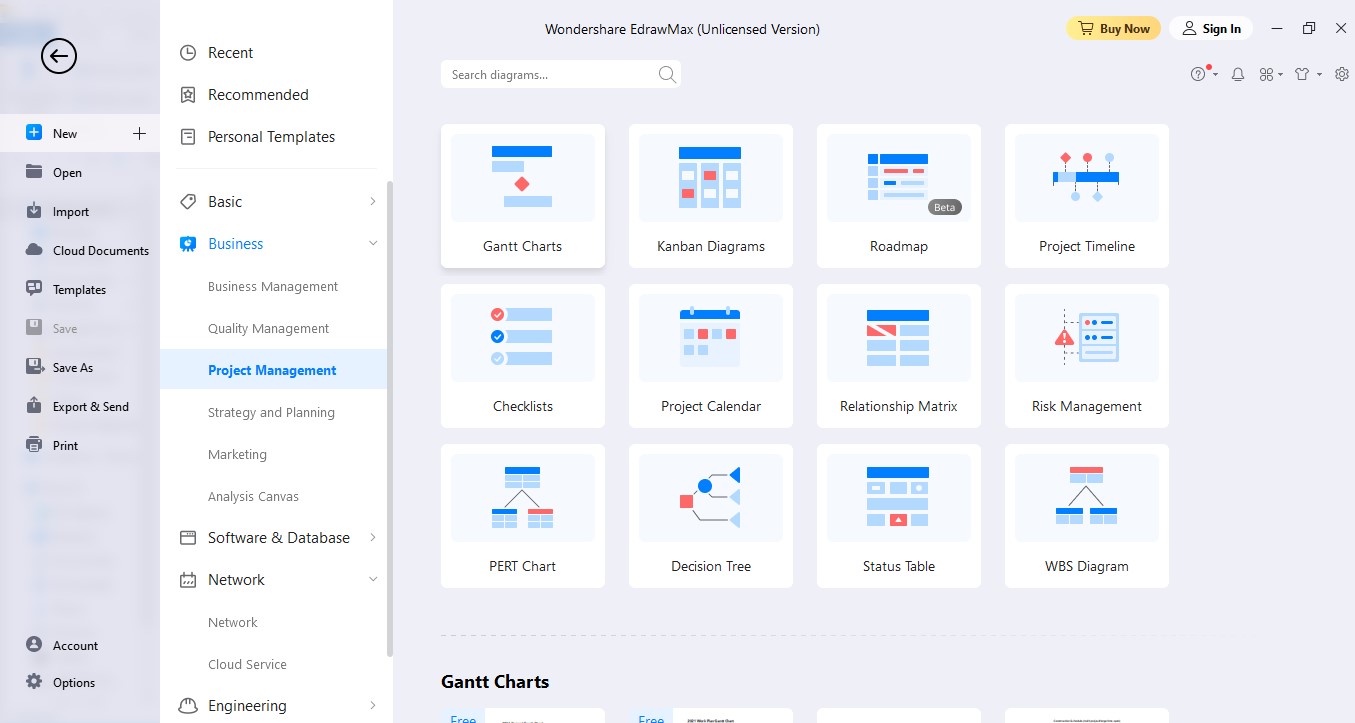
- 1. First of all, open a new diagram page. Press Business > Project Management > Gantt Chart.
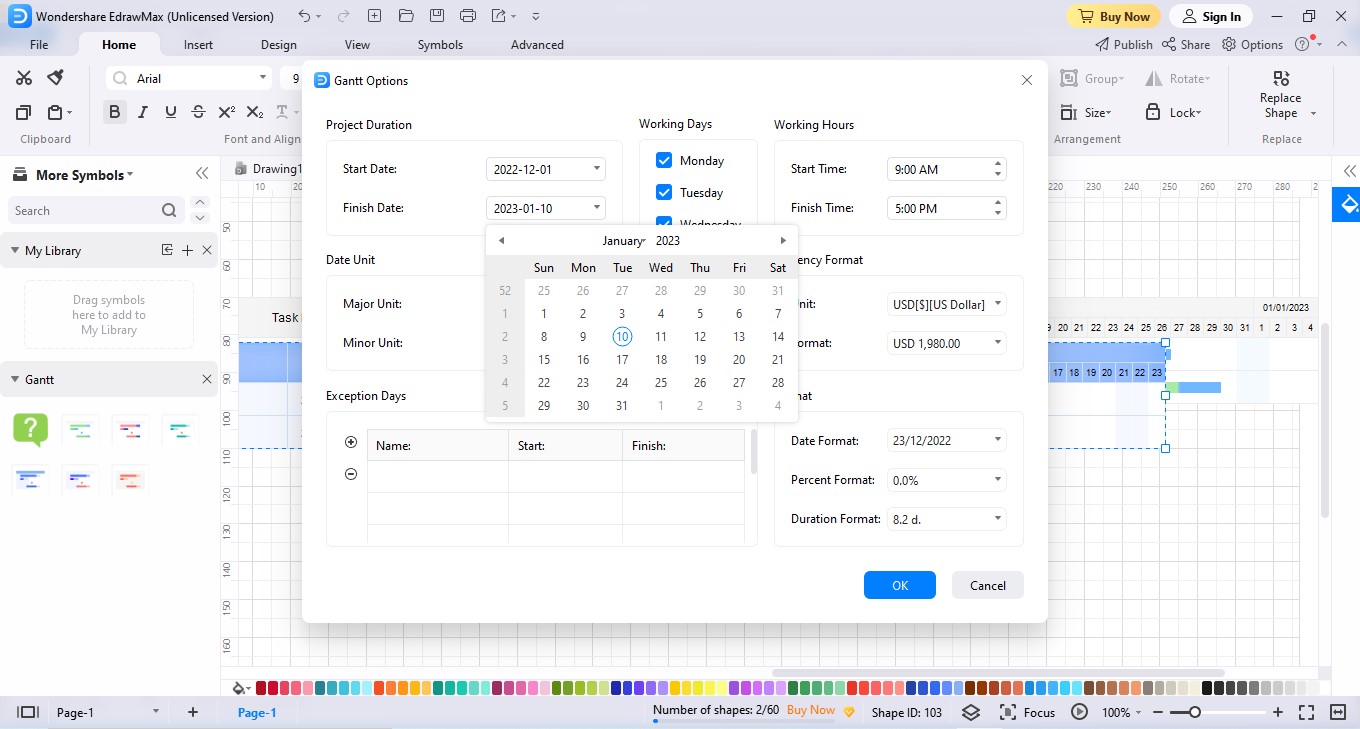
- 2. A blank page will appear. Now, drag any symbol from the right corner. After this, modify the data. Here, you can choose starting data, end date, duration, skills, and resources.
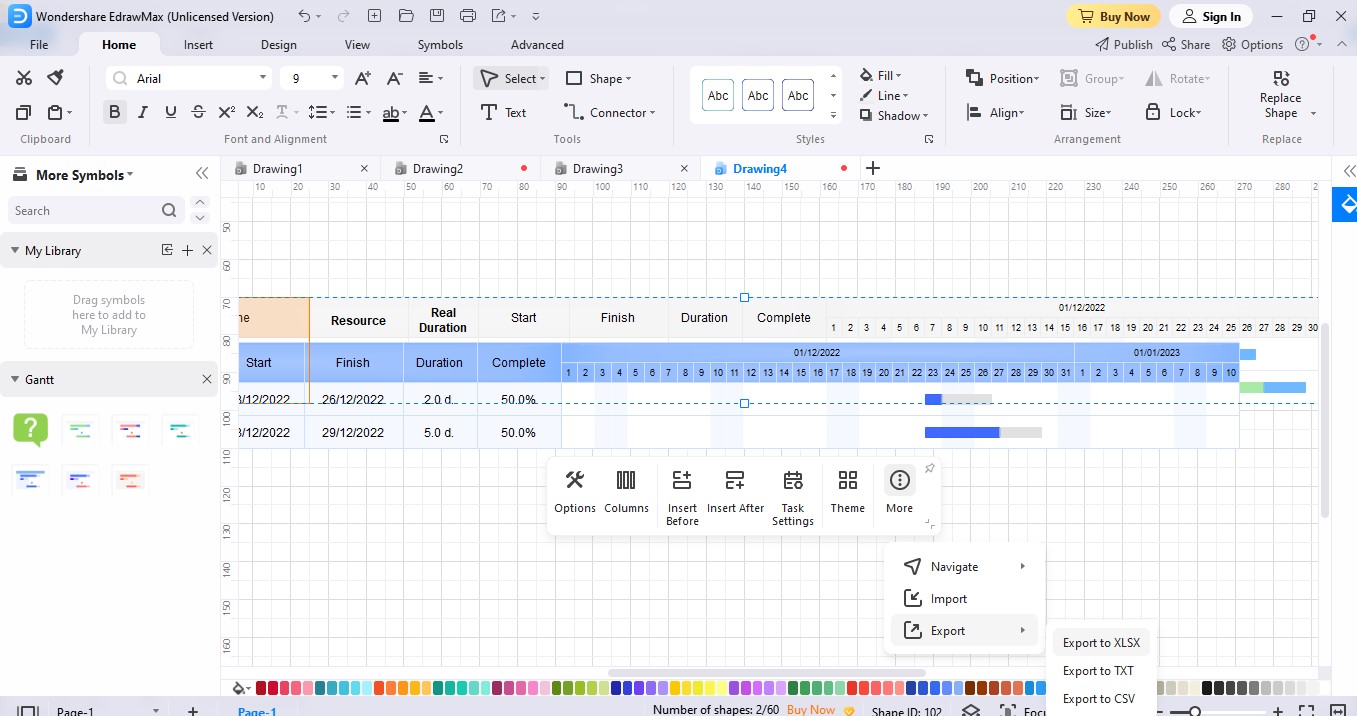
- 3. The chart is almost ready. To get the information to an excel file, click More > Export > XLSX File.
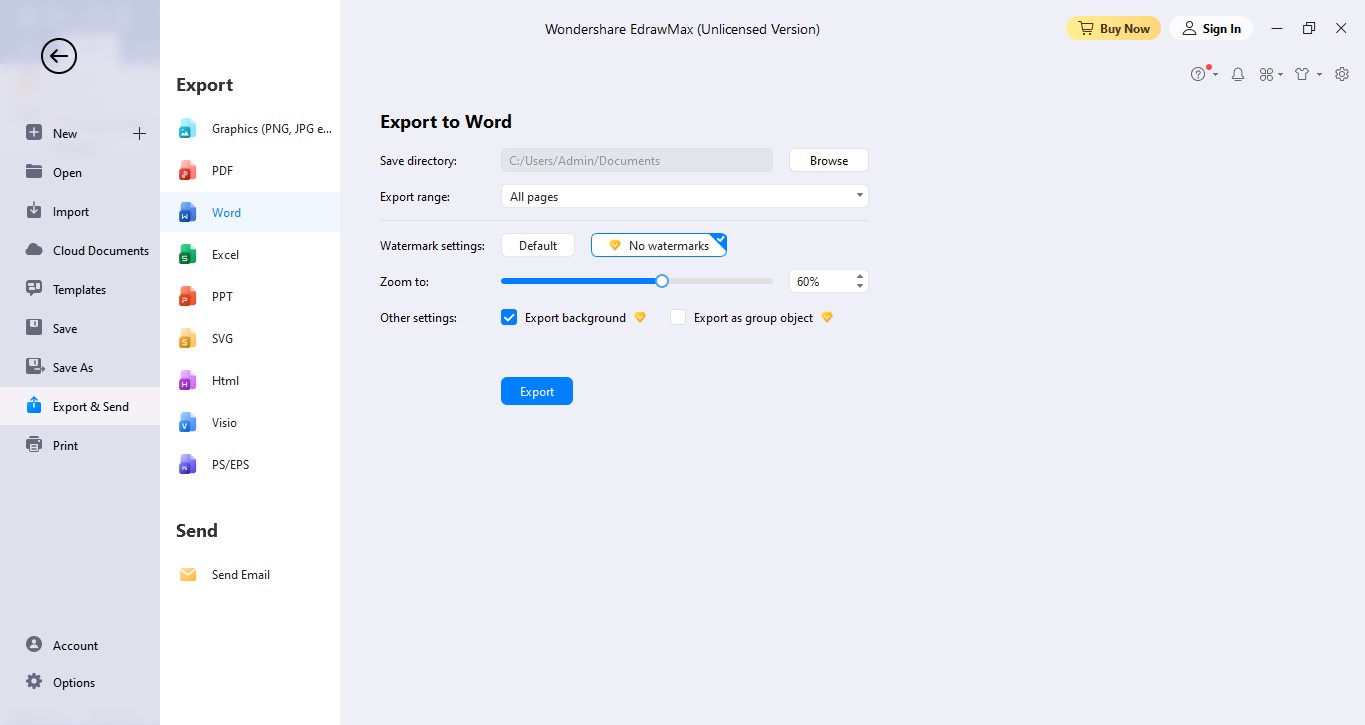
- 4. If you want to export the file on Word, press File > Export & Send > Word.
Create a PERT Chart on EdrawMax in 4 Simple Steps
Designing a PERT chart from scratch is also easy on EdrawMax. Having EdrawMax templates can undoubtedly add to the ease. Check out these steps and create a detailed PERT chart for your project.
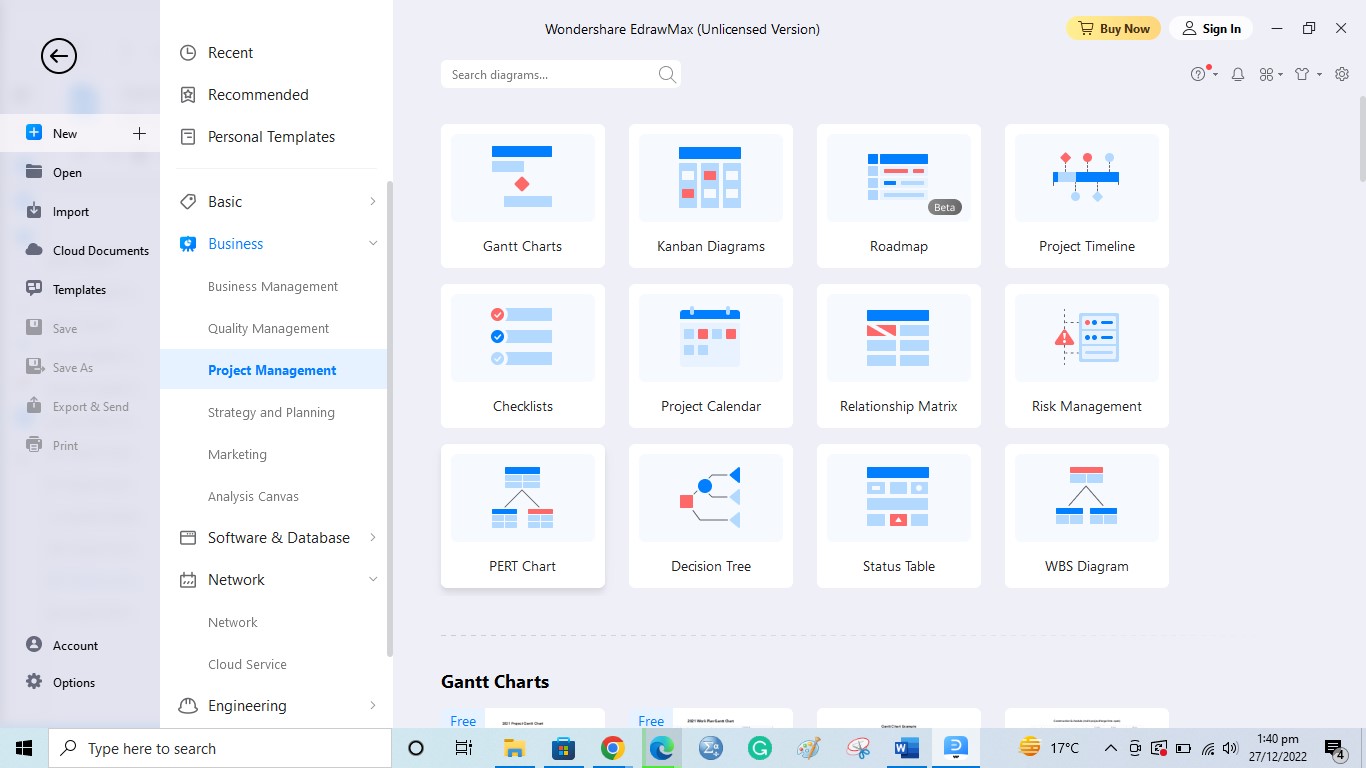
- 1. To start, click the Business > Project Management > PERT Chart.
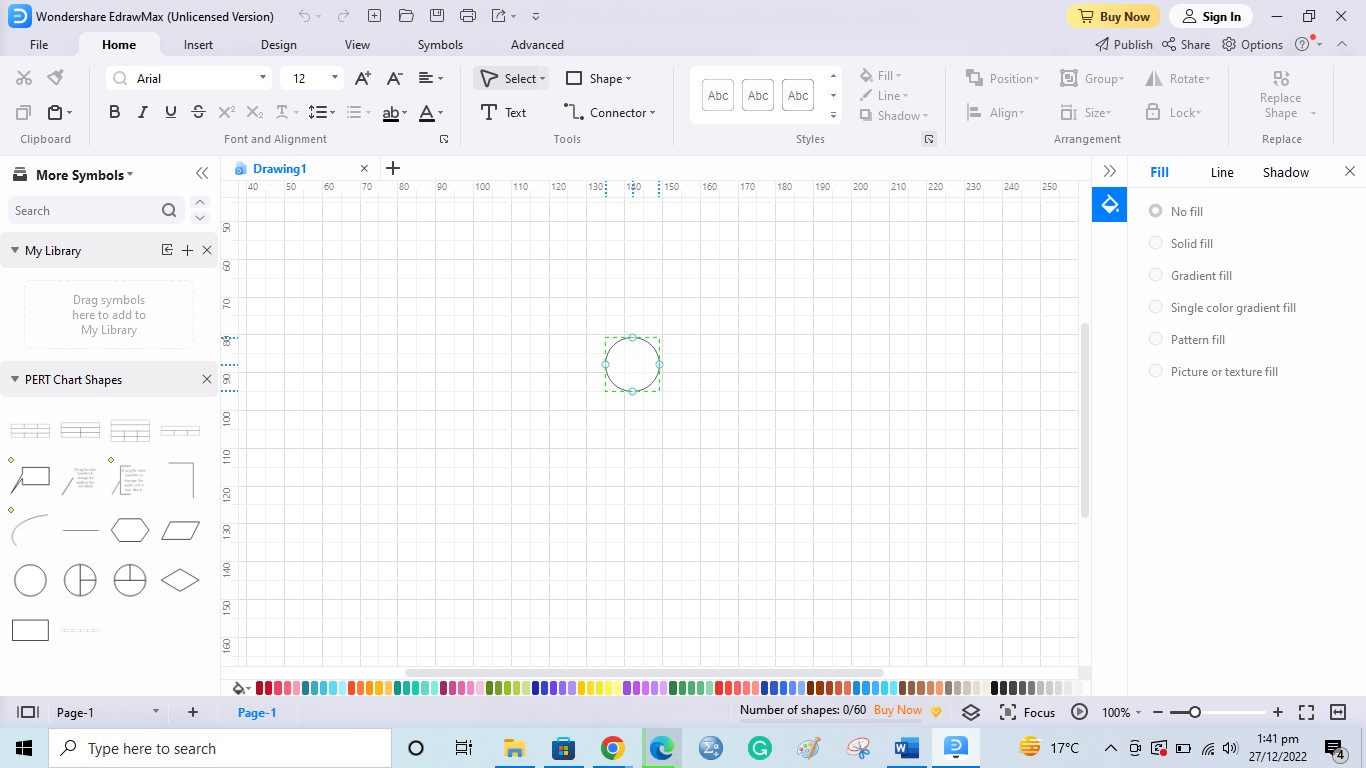
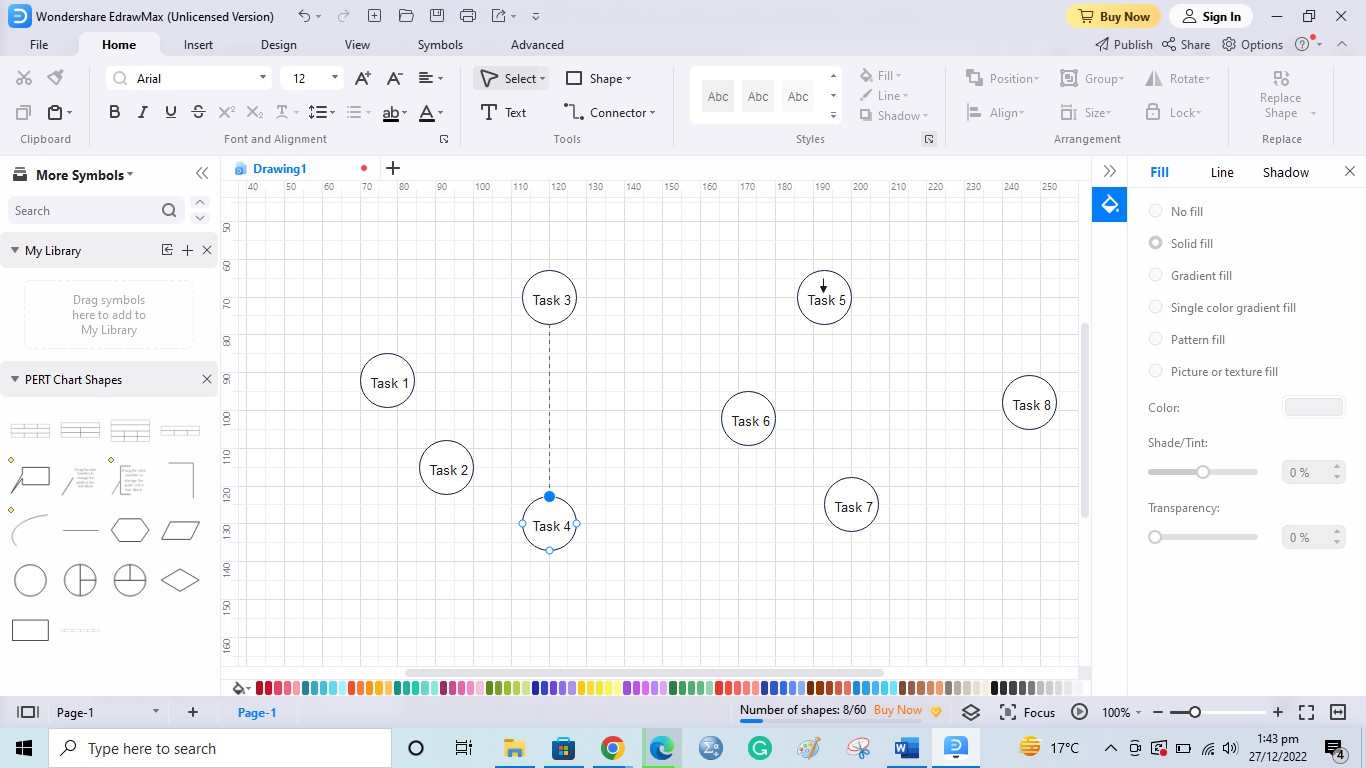
- 2. You will see a blank canvas. From the right corner, choose any symbol and drag it on the page. Give each symbol a name to represent each task.
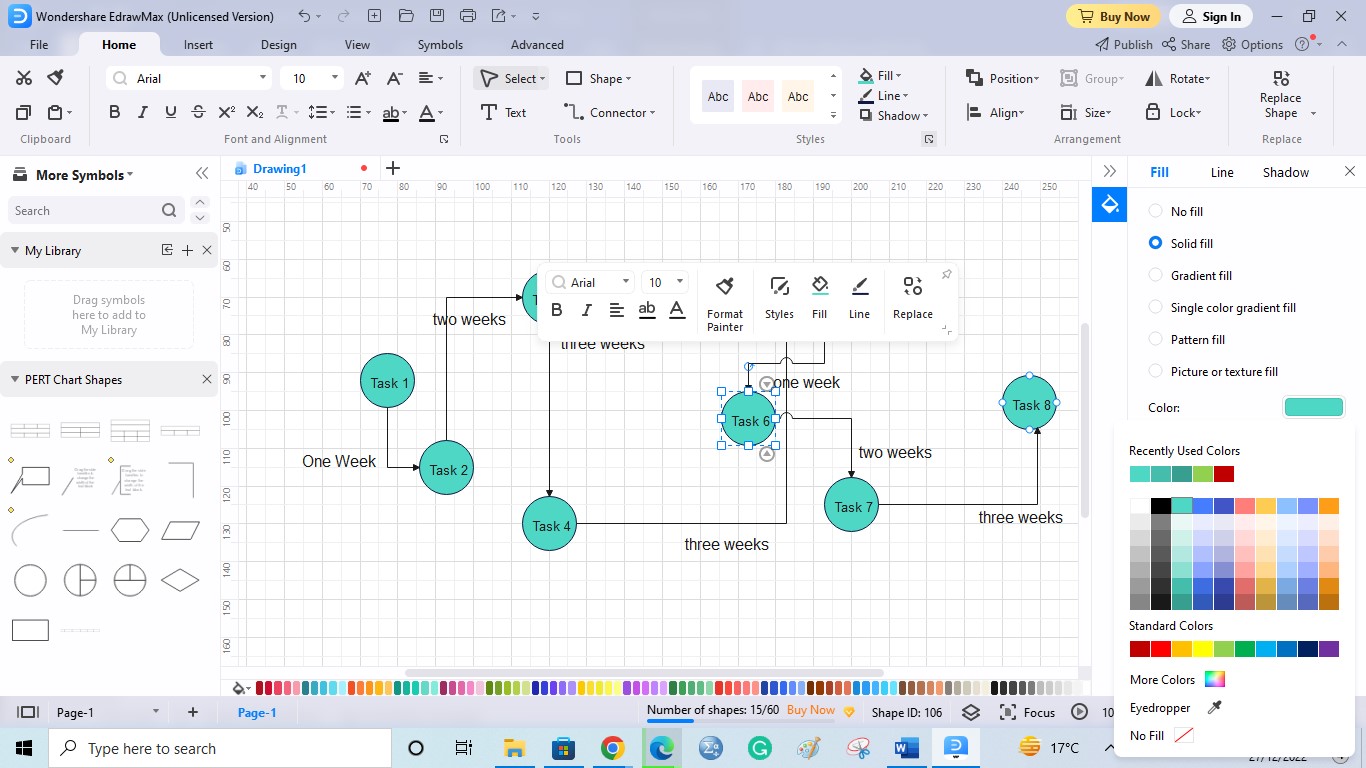
- 3. After this, press the Connector and link the tasks with each other.
- 4. Now, the chart is almost done. There are multiple options to customize, like adding color and so on. Finally, export it to the desired destination.
Best Gantt Charts and Pert Chart Templates
EdrawMax is popular for its professionally-designed templates, whether a Gantt or a PERT chart. You can choose one, whether it is about designing, research, sales, or event. All users need to do is customize them to their requirements. Here are some commonly found templates you can edit.
01of 05
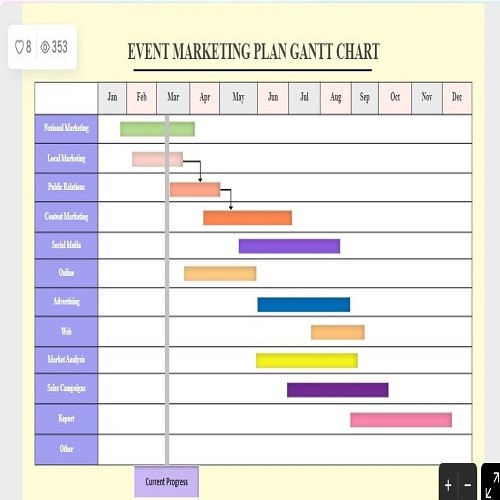
Event Marketing Plan Gantt Chart effectively promotes content and maintains public relations through each task.
02of 05
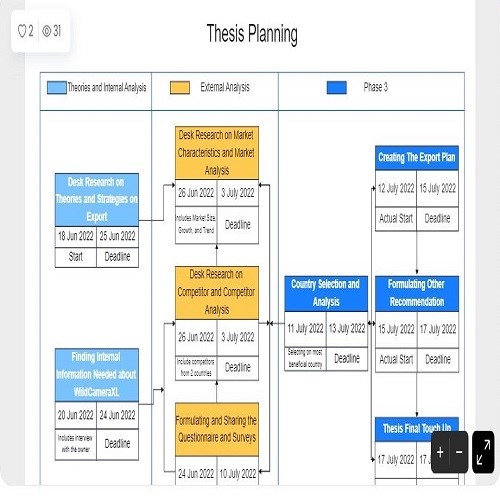
The thesis Planning Gantt Chart is for students who wish to manage their research deadlines. It allows you to create a realistic schedule.
03of 05
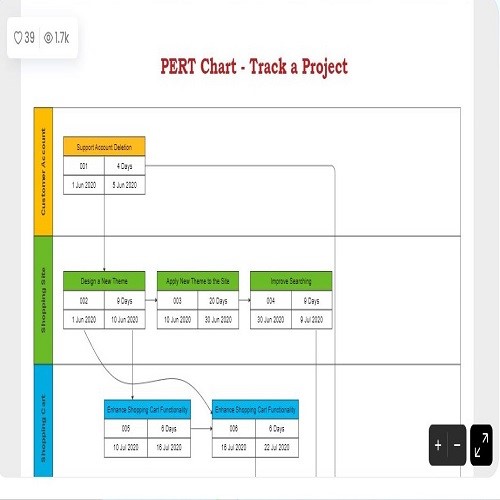
Track a Project is for online shops. Users get to schedule and coordinate each task to their maximum benefit.
04of 05
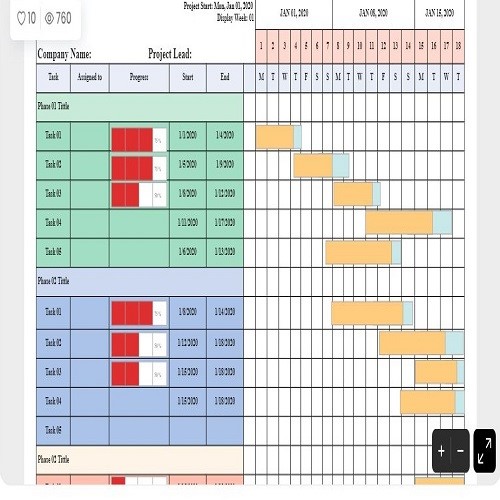
Basic Gantt Chart works best for projects of any length. It helps you manage the timelines and tasks visually.
05of 05
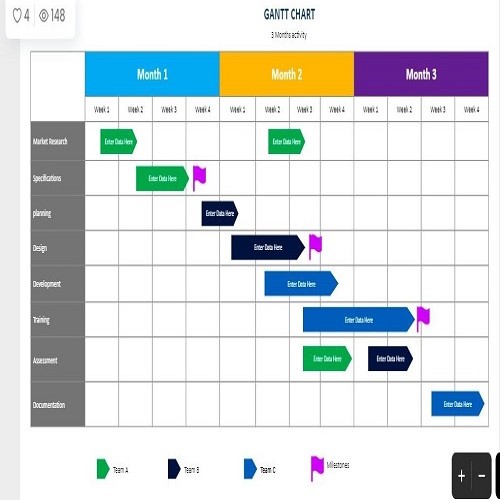
The monthly Activity Gantt Chart allows you to allocate the resources and skills to meet the due deadlines.
Conclusion
PERT Vs Gantt chart? Well, both are important and easy to create. Using a designing software like EdrawMax can save you time and energy. It has multiple ready-made, business, and individual-specific templates to edit from. If you wish to plan and organize a project beforehand, open the EdrawMax now and create them from scratch.
EdrawMax is the versatile diagram software that integrates 100% functionality and libraries of all other drawing products.