Types of Thinking Maps and How They Work (With Examples)

What are Thinking Maps
A thinking map is a learning method, which could visualize learners’ thinking and abstract thoughts with concrete visuals. Specifically, the thinking map can help learners to organize their ideas and information effectively.
Moreover, learners could connect their pieces of information in an easier way. This could improve their comprehension. Usually, a thinking map works in the creative and thinking process. In school education, teachers in primary and secondary schools use this map a lot for the teaching process.
The 8 Types of Thinking Maps
There are eight types of graphic representation based on uses’ different purposes, and each thinking map requires users a cognitive skill and a strong logic mind. All of the thinking maps could be combined creatively.
1: Circle Map – brainstorming topic
A circle map is an effective approach for users to understand a specific topic in both individual and group activities. There are two circles: the inside one and the larger one. The inside circle is the main topic or thoughts, while the larger circle surrounded usually responds with connections and definitions to the main topic.
This map is used to connect the simple idea or brainstorm learners’ minds before the complicated plans. For example, what do learners want to learn IG stories in the inside topic? Some thoughts and questions can be written around this topic in the larger circle. This brainstorming way is the circle map we called.
Overall, it is a great way to open and retain more information at the beginning of a given subject.
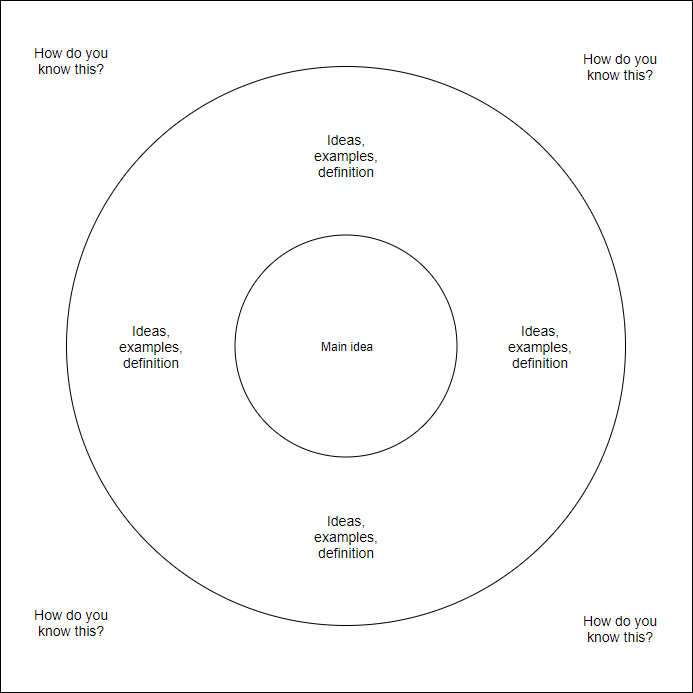
Image source: online.visual-paradigm.com
2: Bubble Map – Describing subjects
Bubble maps are a tool to describe a subject using adjectives. This could make learners think more in-depth about a given topic, so in school, students could identify and summary the related adjectives for the subjects, such as animals. It is also useful for students to describe a situation or character from a fictional book in the classroom.
Another reason to use this map is to set the user’s goal. This map could break down the final goal into pieces. Throughout piecing the final goal, it is effective for users to achieve step by step. For example, the goals for the rest of the year are divided into six smaller goals, and each sub-goal can guide me more specifically and concisely.
Overall, this characteristic of the bubble map describes and supports your center topic with more details.
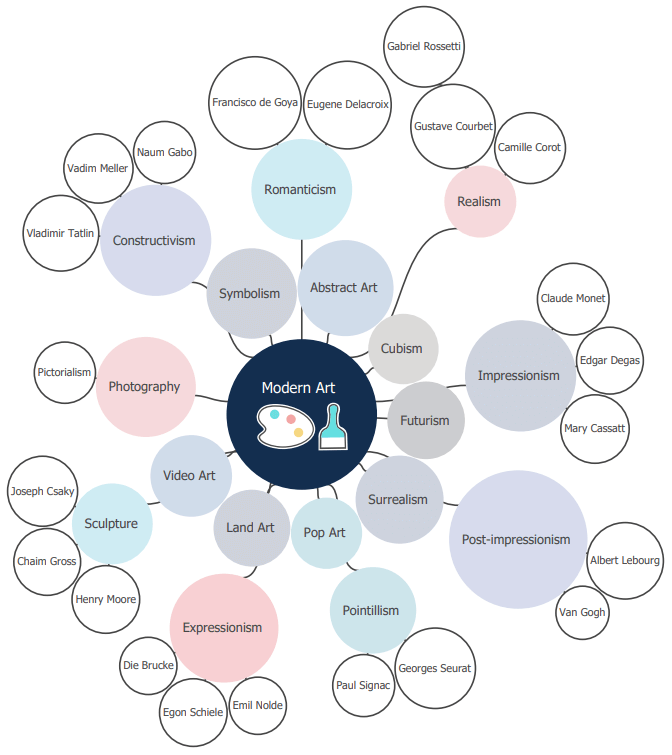
Image source: edrawsoft.com
3: Flow Map – Ordering and sequencing
The flow map aims to visualize a process and progression. Information and steps of the process can be labeled and identified well and specifically.
This map could also guide people step by step to get access to some entrances or destinations if people need to find their way. In school, the flow map could guide parents and children to registration in school open days.
Overall, the flow map could help users to represent a series of instructions.
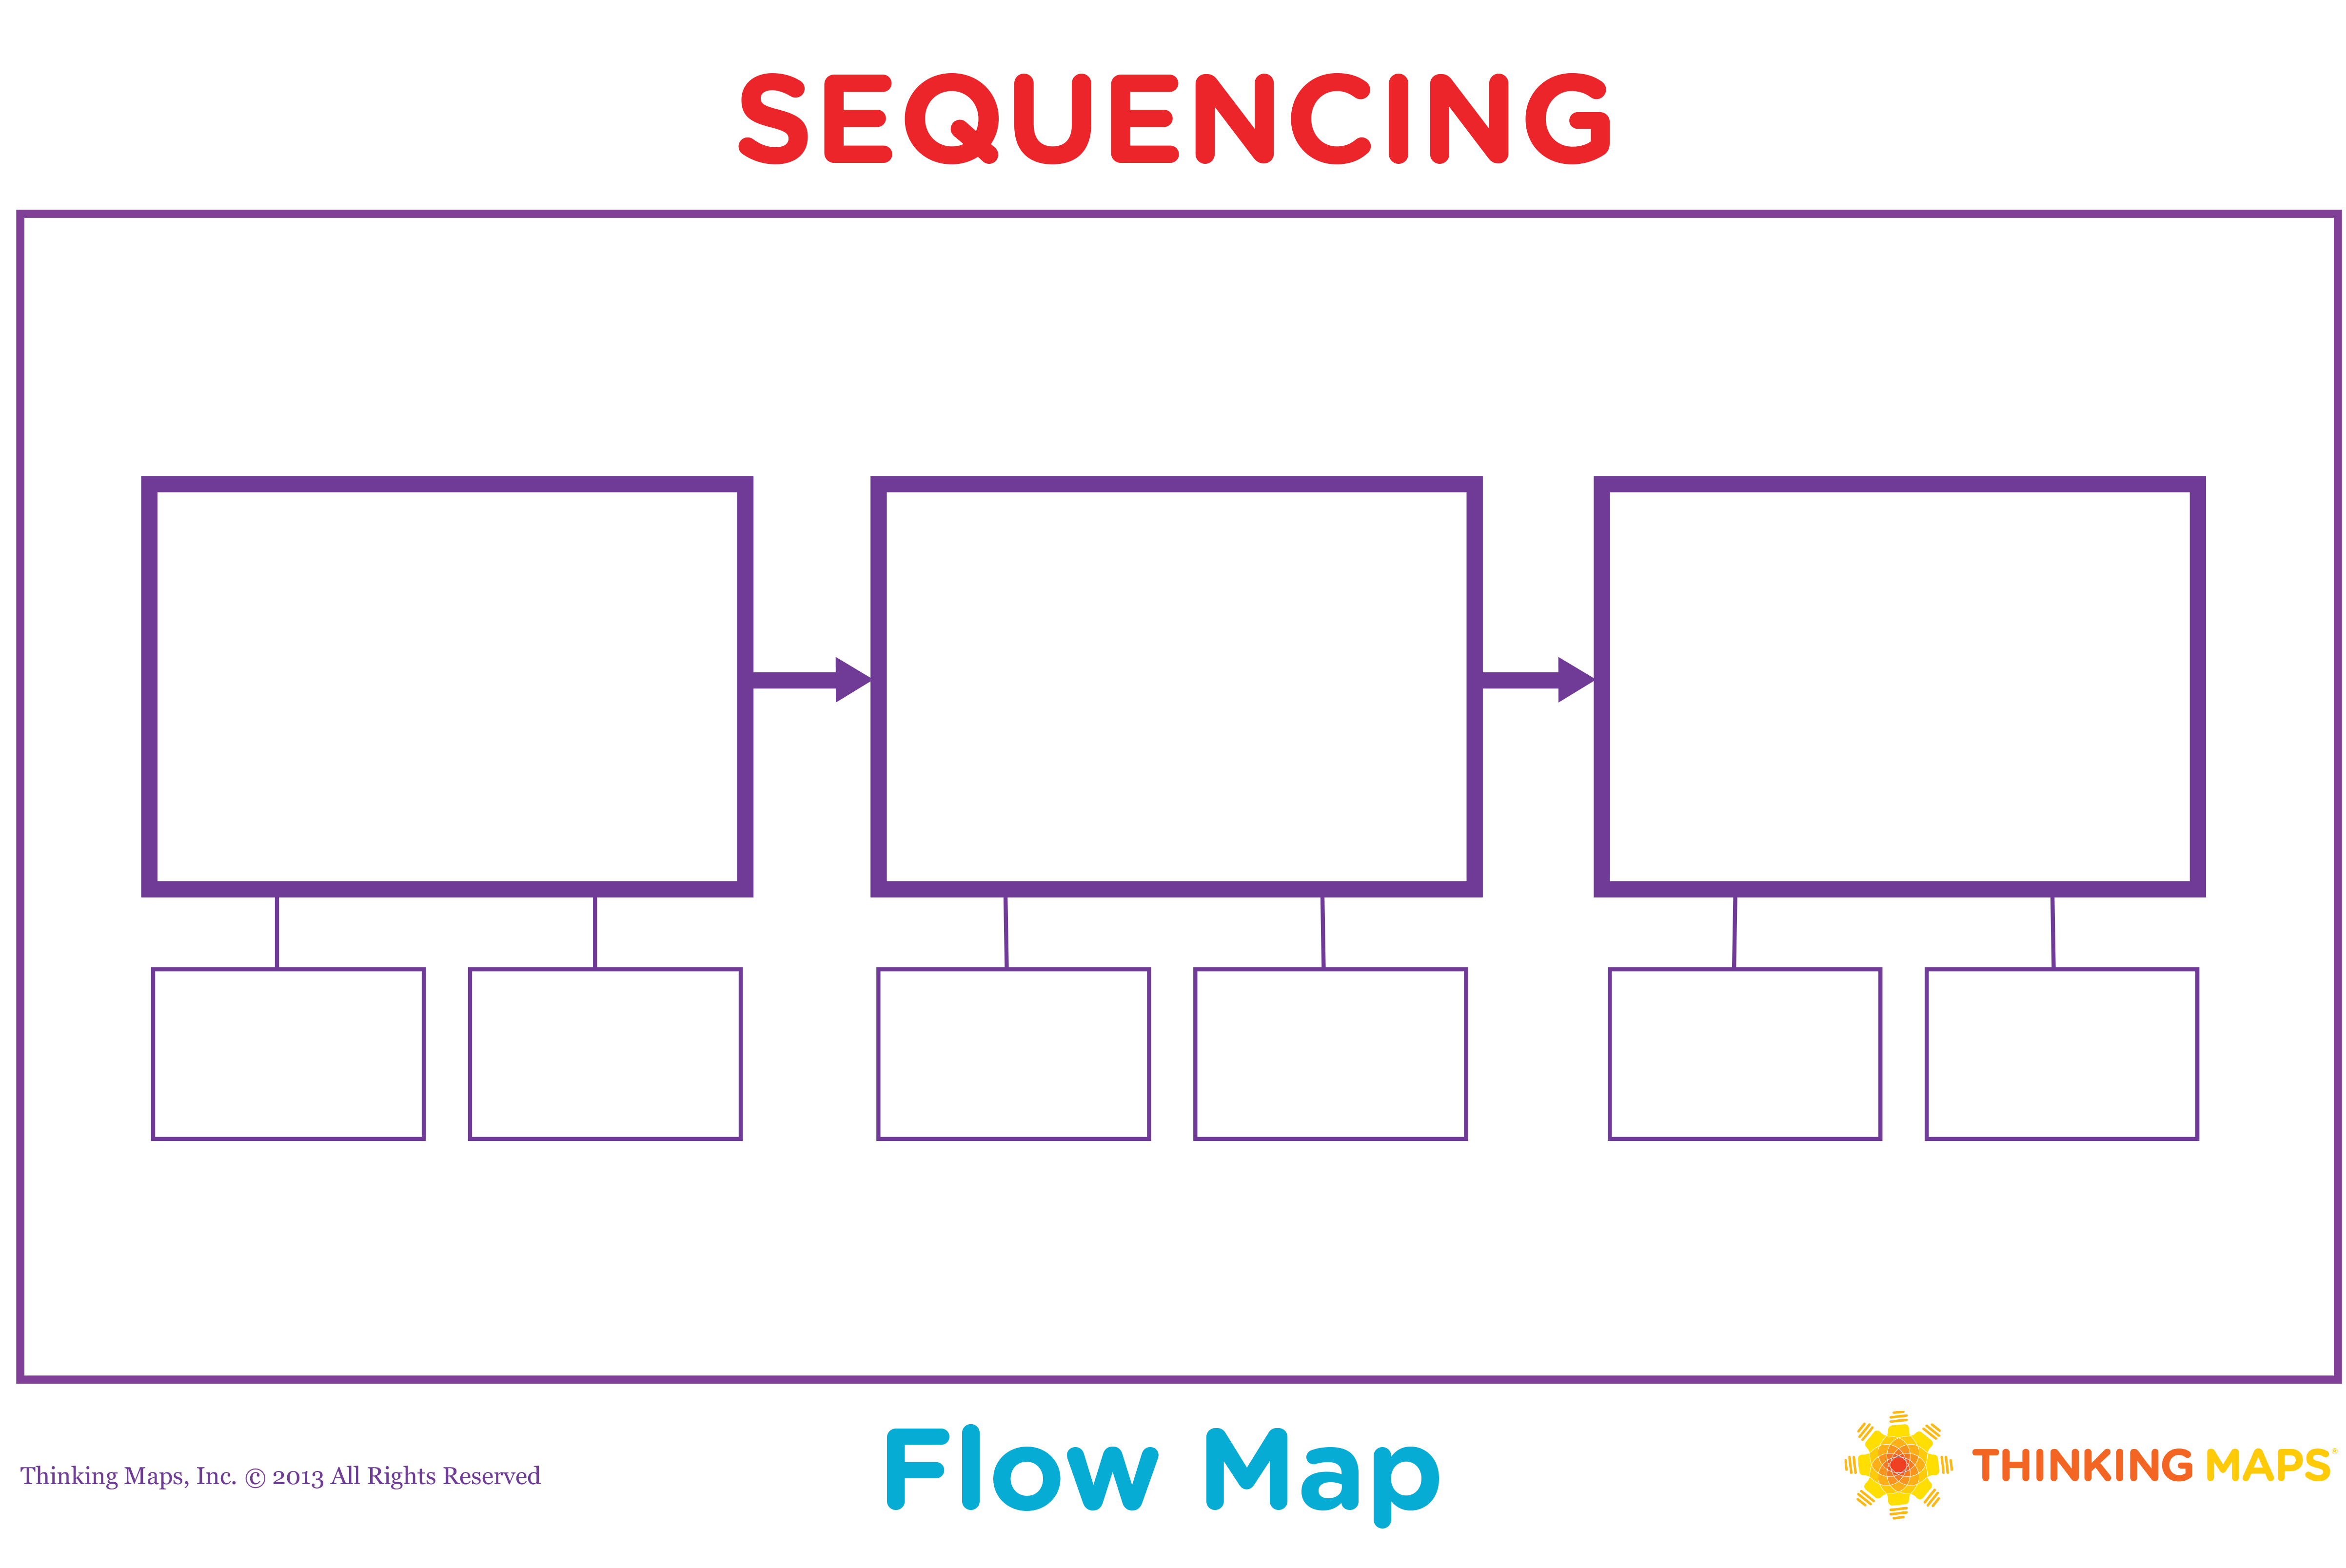
Image source: edrawsoft.com
4: Multi-Flow Map – Analyzing reason and results
The multi-flow map focuses on the analysis of reason and results. The left rectangles represent the causes, while the right one shows the possible effects.
On some occasions, effects also can be one of the contributions, which creates a feedback loop. Therefore, a multi-flow map is a good way to analyze an event, figuring out the main factors and possible impacts.
For instant, air pollution would produce acid rain and damage human respiratory organs like the lungs. Also, the ozone layer can be broken. All of this is because of the pollution exhaust from factories and cars, and the overuse of mine resources.
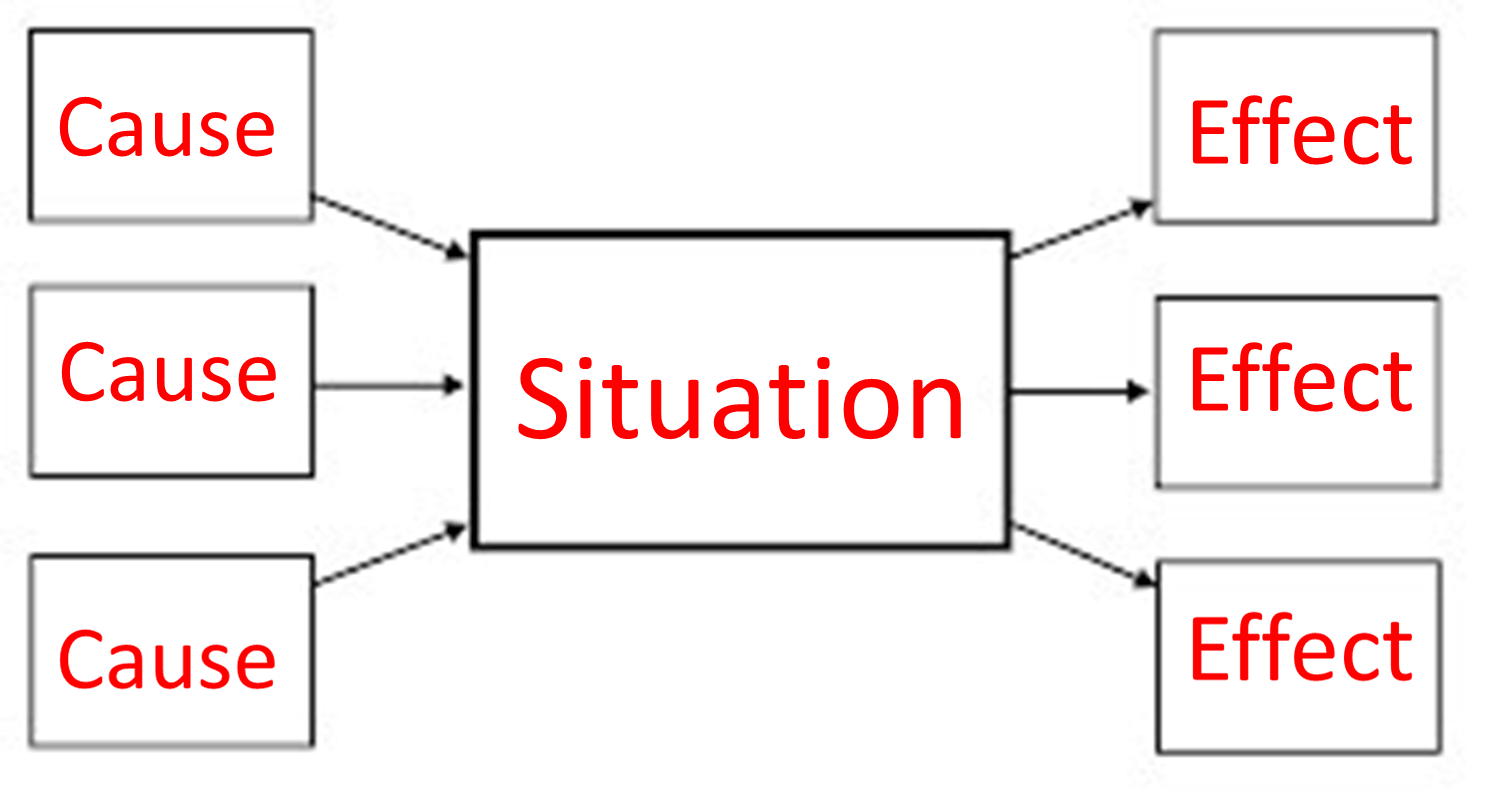
Image source: sites.google.com
5: Brace Map – identifying the components
Brace map aims to the relationship between the parts and the whole subject. Compared to the treemap, the brace map tends to organize and conceptualize the components of the whole topic. However, the abstract thoughts and ideas cannot be included because the brace map only takes account of the real objects or situations.
In school, science teachers could prepare the experience tools based on this brace map because this map could show every component of the experience needed. Another example is the parts of the plant in biology class. The plant separates into three parts, and each part includes more things. Children could understand the parts of a plant in an organized and clear way.
Overall, a brace map is a tool to instruct people, including components of certain subjects.
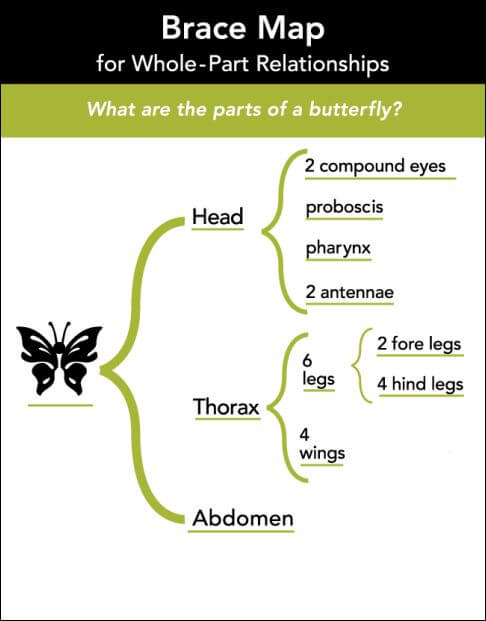
Image source: pinterest
6: Treemap – Classifying and organizing
Like the taxonomy map, the treemap organizes information so that people could classify the objects by the connections with the main categories. Usually, the main topic is on the top, and the relevant information just lists below.
Students could learn a group of animal families and other mammal families by this treemap in primary school. It is very helpful for students to organize and remember basic knowledge.
Another example is the English learning. Learners could see the different types of verbs and find the connections between these verbs. Overall, a treemap could help users to order the information and sum it up.
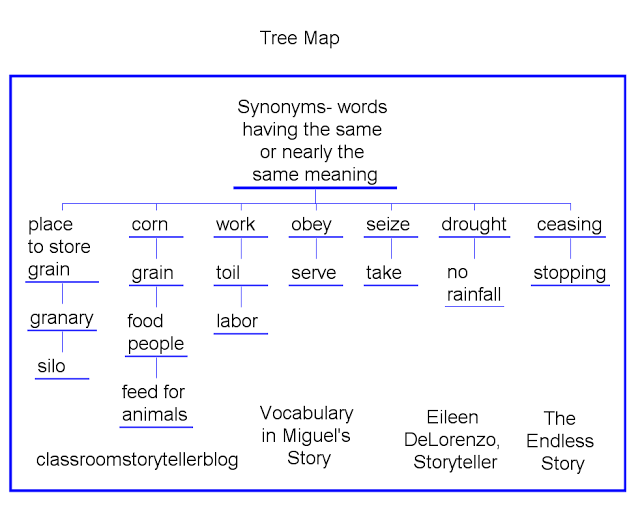
Image source: eileendelorenzo.com
7: Double Bubble Map – Comparing and contrasting
The double bubble map puts two bubble maps together so that users can compare the differences and similarities easily. The combined shadows are the similarities, while the differences are in each left part of the circles.
Compared to a Venn diagram, the double bubble map is more visualized and organized because the bullet points are listed separately. School students often use double bubble maps for literature analysis.
The characters and the situation, as well as the plots in similar types of novels, can be compared. What similar experiences make them successful, and what differences make them have different life ends. Overall, the double bubble map does a great job in comparison and connections.
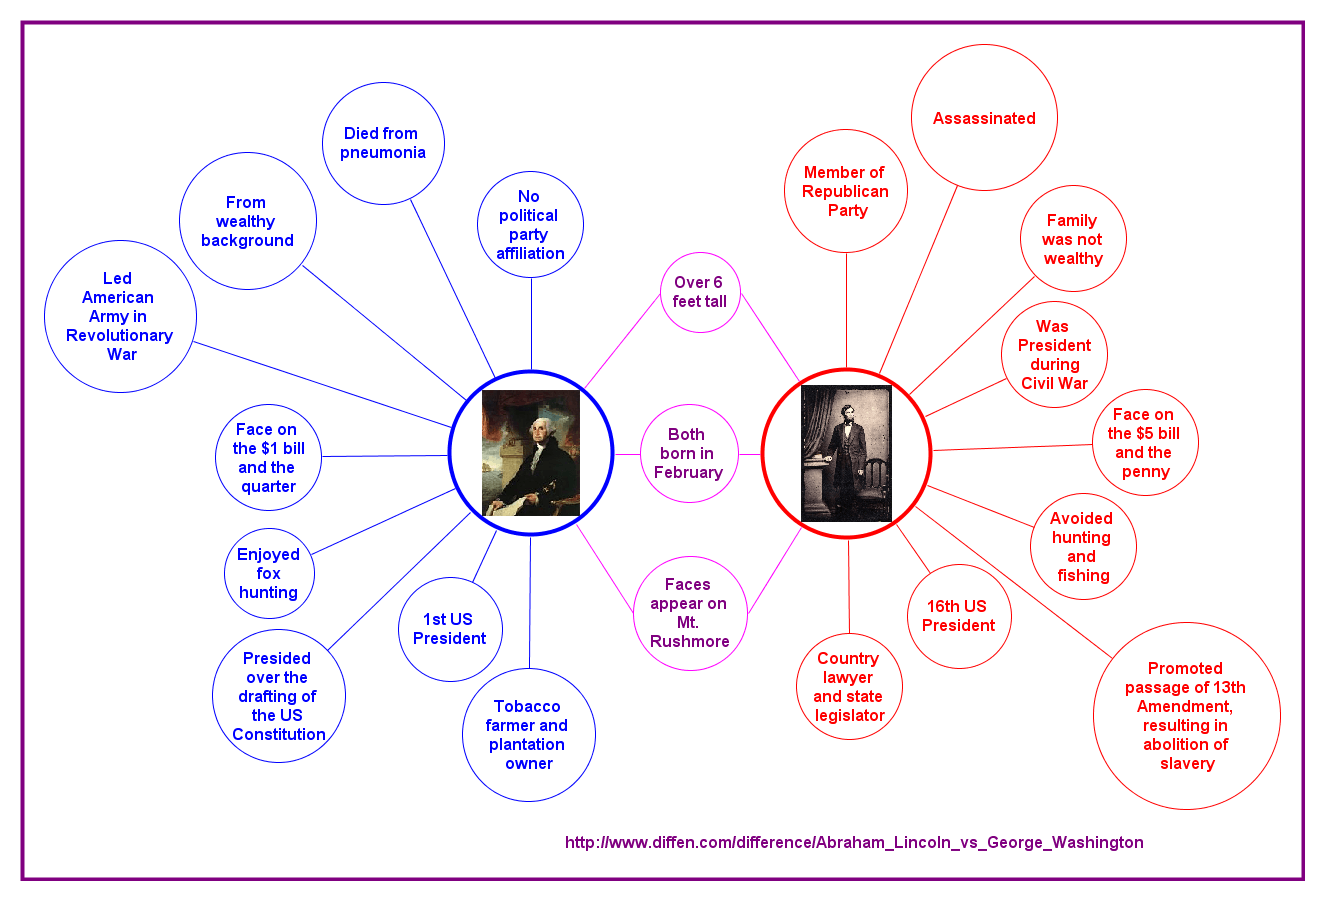
Image source: thinkingmaps.com
8: Bridge Map – Seeing similarities
The bridge map helps users to find the similarities and connections between objects by comparison. It is natural for people to learn new things by connecting to prior knowledge. In this situation, analogy skills are very important.
This map builds the bridge between the new and the old things so that people can quickly find the connections and master it. The example is the connections between daily food and nutrition terms. For children, the knowledge that oranges include vitamin C can be delivered to students quickly in a strong and impressive way.
Overall, the bridge map connects people’s previous knowledge to the new one.
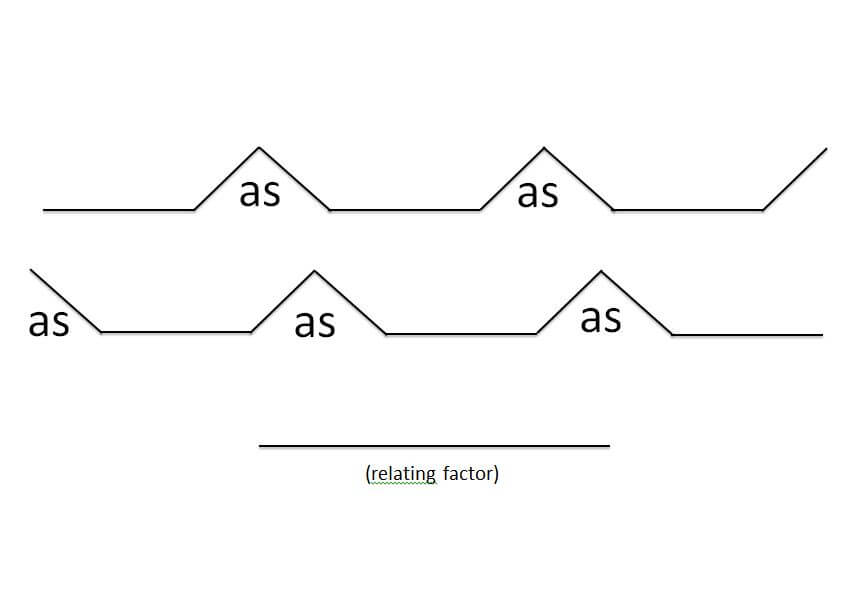
Image source: osborne10thlit.com

An all-in-one platform for 210+ diagrams.
・ Simple alternative to Visio
・ 26k+ symbols
・ 10K+ free templates
・ 10+ AI diagram generators


How to Create a Thinking Map
Step 1: thinking of your purpose and usage of a thinking map.
Step 2: choosing a certain mode of thinking map to match your purposes.
Step 3: typing the context you needed.
Step 4: after typing, keep it and quickly download the format.
For example:
My purpose is to know what information my students want to have, so I choose the circle map as the approach.
The topic in my bubble map is course names such as animal learning, so the inside circle is animal learning, and the bigger circle, my students, can write anything they want to know. After this, I could design my class based on the information they are interested in.
In this case, students would be more engaged in the learning and teaching process because the context is their interest.
Conclusion
Lots of examples can support the benefits of thinking maps to users, and each type of thinking map has its focus and advantages. Speaking, thinking maps help users to simplify their knowledge and organize their minds. In the classroom, teachers should be encouraged to use each type so that the knowledge can be visualized and simplified. Finally, academic performance would definitely be better than before.
Try EdrawMax and make an excellent lesson plan to outlines the content of your lesson step-by-step.

