What is Visio?
Know it All about Visio
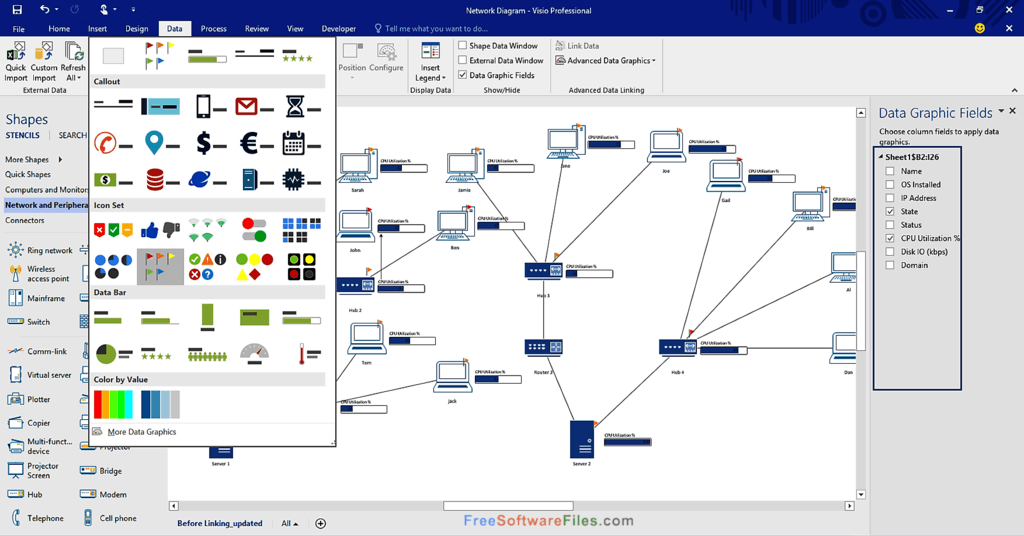
Visio is a diagramming program for Microsoft Windows that provides models and symbols for creating flowcharts, organizational charts, floor plans, network diagrams, mind maps, infographics, and more. It's a Microsoft utility that's marketed as a supplement to Microsoft Office. The most recent version, Visio 2016, is available in three editions: Visio Standard, Visio Professional, and Visio Pro for Office 365.
The first Visio versions were numbered from 1.0 to 5.0 and came in three different editions.

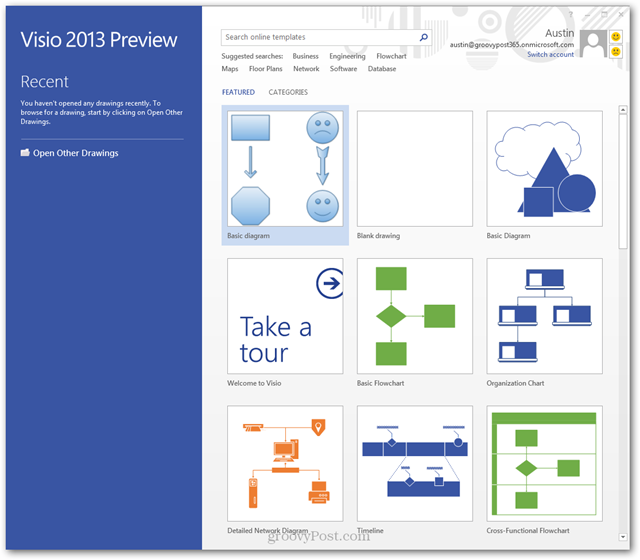
Following Microsoft's acquisition of Visio in 2000, the various versions and editions emerged in the manner:
Visio was first released in the 1990s as a Shapeware Corp. software, first as a pre-release version .92 and then as version 1.0 in 1992. The product was soon recognized, and the company was renamed Visio Corp. in 1995. Microsoft purchased Visio in 2000 and rebranded it as part of the MS Office suite.
However, Visio, like MS Project, has always been available as a separate purchase from the MS Office Suite packages.
Visio can be used to produce professional-looking diagrams in some situations. Visio can create sleek, useful diagrams of all types if they are suitable for your needs, and these can give your presentations, reports, audits, construction plans, floor plans, and documents the polished look you want.
Besides, Visio has a large library of shapes and symbols that can be used in a variety of diagram formats. These are commonly used in a variety of fields for a variety of applications. Here are a couple of examples:
As of 2013, Visio uses the Open Packaging Conventions-based VSDX and VSDM file formats. These are a set of XML files contained inside a Zip file. VSDM files can contain macros, which is the only difference between the two styles.
Microsoft Visio allows you to build a variety of different types of diagrams. Some of Visio's most popular applications are mentioned below.
Flowcharts depict the visual sequence of steps and decisions in a phase, with shapes representing the steps and arrows indicating the progression from one stage to the next. The term also includes process maps, flow diagrams, etc.

Organizational charts, also known as org charts, portray the reporting relationships and hierarchies that exist within a company. They will reveal who reports to whom and the overall hierarchy from top to bottom to aid planning and management.

Floor plans are sketches that describe the footprint or cross-section of a building or other structure at a specific scale. They're used to ensure that rooms and other objects are properly sized and placed. House plans, blueprints, architectural plans, construction plans, and schematics are all terms for floor plans.

Mind maps or Concept maps are diagrams that group and link similar ideas to the overall topic(s) at hand to show the relationship between ideas. Mind maps are useful tools for preparation and brainstorming.

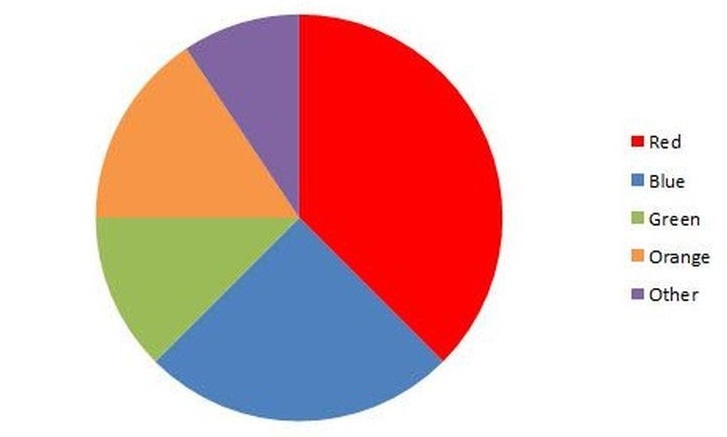
Charts and graphs are a feature of Excel, but they're also in Visio. They're in almost every business presentation used to visually reflect data in a way that makes the details presented more understandable. Bar charts, line charts, and pie charts are all popular examples.
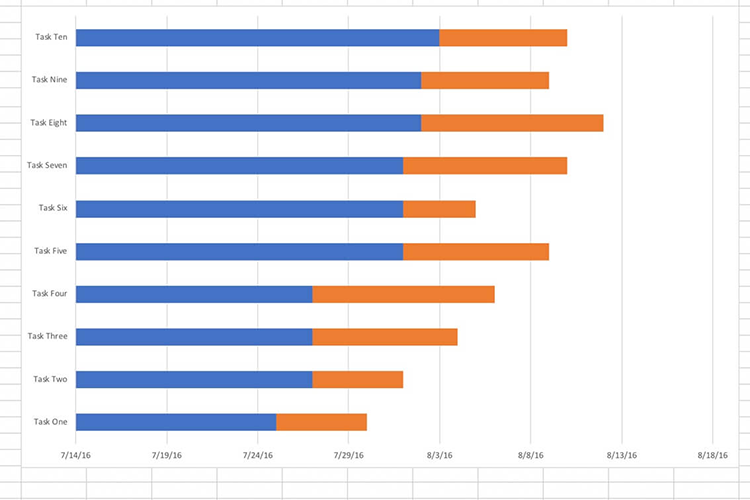
Specific project assignments, their start and end dates, the individuals assigned to the tasks, and other project-related details are all shown in Gantt charts.
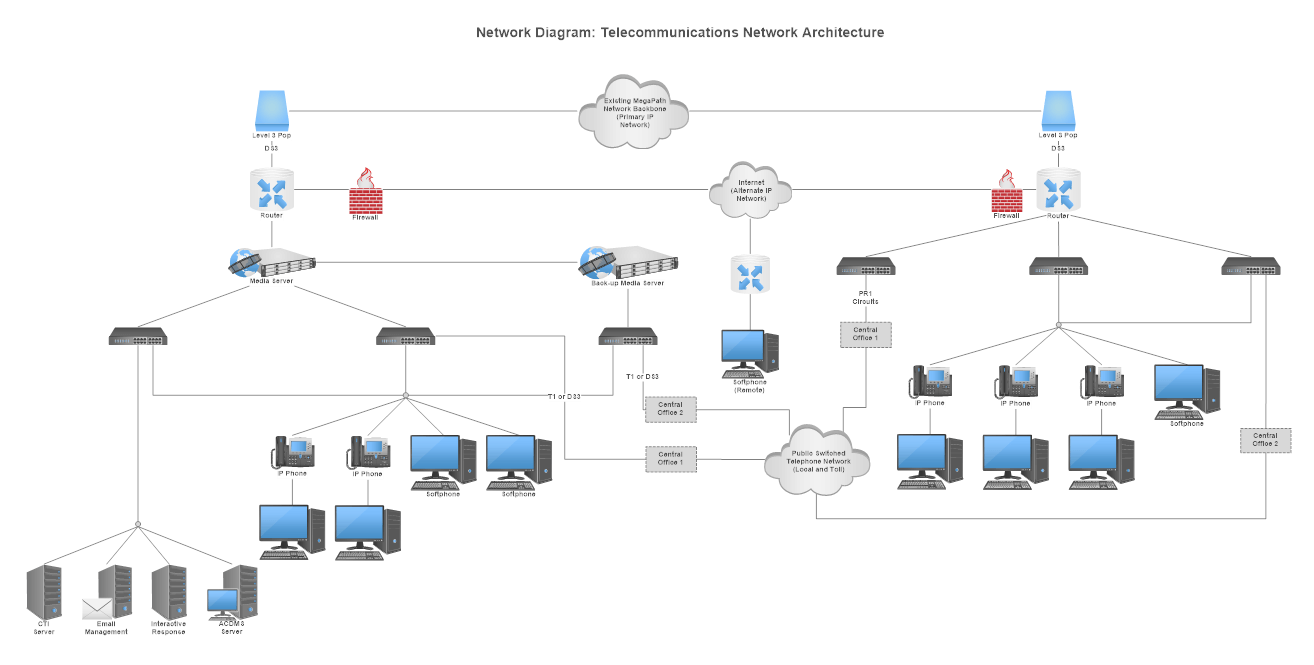
Network diagrams incorporate symbols and lines to depict the configuration, nodes, and links of a computer network at a specific location. They help decipher how computer data flows within a business.
Here are some basic steps that can help you draw in Visio:
Searching for an alternative to Visio? Look no further as here is a recommendation of the best one - EdrawMax. EdrawMax is a one-stop-shop application that converts text and spreadsheets into flowcharts, scientific diagrams, bitmap images, floor plans, org charts, engineering architectural drawings, mind maps, and other diagramming representations.
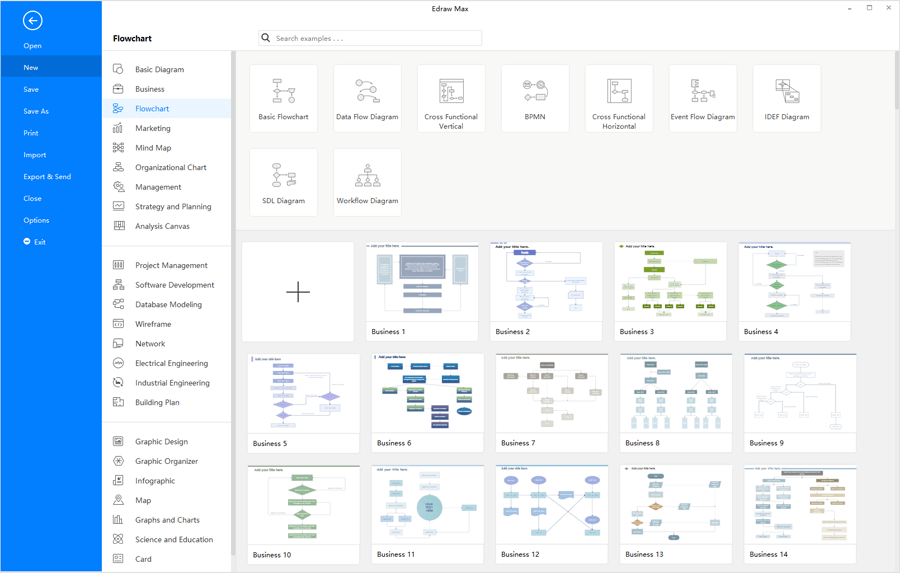
It's a high-end, multi-dimensional, and powerful tool that helps content creators create graphical representations of text. EdrawMax makes creating charts and diagrams easy and intuitive. Make sure to try out the fully functional and built-in templates for creating your content.

・ Simple alternative to Visio
・ 26k+ symbols
・ 10K+ free templates
・ 10+ AI diagram generators


