Edraw Article Center
Read articles on diagram knowledge, learn how to make diagrams, find examples for reference, and check out tips about Edraw.
Top How-Tos That Everyone Need to Know
All How-Tos Articles

How To Create a Gantt Chart in Google Sheets? A Quick Tutorial
Overwhelmed with project management? Start basic project planning with Gantt charts in Google Sheets. Learn how to create Gantt charts in just a few clicks.

How to Create a Mind Map in Microsoft Word
Follow the instructions in this article and learn how to create a mind map on Microsoft Word within 3 steps.

How to Create Gantt Charts in Word
Wondering what features work best on Microsoft Word to create a Gantt chart from scratch. Here are 3 ways to create Gantt charts in Word.

How to Read Piping and Instrumentation Diagram
P&ID drawings are essential to many industrial operations. This page is a basic guide on how to read and understand Piping and Instrumentation Drawings (P&IDs).
How to Make a Gantt Chart in Microsoft Planner
This article gives an overview of the Microsoft planner and how to make a Gantt Chart on the Microsoft planner. The best alternative of the Microsoft planner is also discussed.

How to Create Concept Maps in Word? [Free Templates Included]
Edraw offers you a number of ready-made word concept map templates that you can use them for free.

How to Create Mind Map
Mind mapping is the process of representing your thoughts and ideas in a visual. You might think of the mind map as a visual tool that helps structure information. It has changed and evolved the metho

How to Make a Concept Map
Simple tutorial helps you quickly create a Concept Map and increase you productivity at work. And this guide provides concept map examples to help you create.

How to Use Mind Maps for an Effective Essay Writing
Being a student, writing an effective essay is a difficult task for you. But you can make it easy if you know how to use mind maps. Creating a mind map for essay writing helps you visualize the idea b

How to Create a Mind Map in PowerPoint
A mind map gives ideas a simple and understandable structure. This article will explain how to create a mind map in PowerPoint with free templates for you to edit.
How to Make a Flowchart
Learn how to create flowcharts with EdrawMax. It is easy for beginners to use and provides professional features.

How to Build a Startup Organizational Chart
This article briefly discusses everything you need to know to build your startup org chart. You will need to establish some guidelines about the responsibilities of each person.

How to Create Org Charts in Excel — The Step-by-Step Guide
The most straightforward way to create org charts in excel is using the SmartArt option. Here is the step-by-step process of creating effective organizational charts in Excel!
Visio BPMN Guide: Create a BPMN in Visio Step by Step
BPMN is crucial in a business context to clearly show information. Create BPMN 2.0 diagrams with tools to demonstrate your business flows.

How to Draw Human Anatomy
Learning human anatomy drawing was never so easy. Simply log in with EdrawMax and start using a template to learn human organs and systems. Moreover, you can quickly learn to sketch human anatomy and

How to Sign in to & Activate Edraw Software
Follow this tutorial to learn how to activate or sign in Edraw software.
How to Create an Organizational Chart
Are you looking for an efficient way to create organizational chart? Look no further than EdrawMax. Millions of users are already benefiting from this credible software. Why not you? Download it today

How to Make a Mind Map in SmartDraw
SmartDraw mind map software provides limited functions. Check out the Edraw guide and learn the easiest way to create a free mind map using EdrawMax and EdrawMind.

How to Make a Mind Map in ClickUp?
Check out the ClickUp mind map alternative. Create free mind maps using EdrawMax and EdrawMind's mind map templates and design arts.

How to Make a Mind Map in Lucidchart?
EdrawMax and EdrawMind are two Lucidchart alternatives that provide mind map templates, symbols, cliparts, and template communities to mind mapping enthusiasts.

How to Make a Mind Map in Notion?
Looking for Notion alternatives to create mind maps? Check out EdrawMax and EdrawMind's steps to create professional mind maps for your projects.

How to Make a Mind Map in Canva?
Canva provides limited support to make mind maps. Check out EdrawMax and EdrawMind's guide and learn how easily you can create mind maps from these Canva alternatives.

How to Make a Mind Map in SimpleMind?
SimpleMind offers limited support for desktop users. Check out EdrawMax and EdrawMind's guide and create mind maps using the SimpleMind mind map alternative.

How to Make a Mind Map in Miro?
Check out the Miro alternative when creating a mind map. Check out Edraw's Miro mind map guide and learn mind map software features of EdrawMind and EdrawMax.

How to Make a Mind Map in Coggle?
Looking for a Coggle alternative to create mind maps? Check out Edraw’s Coggle mind map guide and learn more about EdrawMax and EdrawMind’s mind mapping features.
How to Create a Graphic Organizer
Enjoy a user-friendly interface with thousands of free customizable graphic organizer templates to match your design, numerous features, and all formats inclusive to share your work. This step-by-step

How to Create a Visio Diagram in Excel
One of the prominent tools that most users use is MS Excel, where they tend to create diagrams that look a lot like Visio. In this elaborated guide, we will walk you through the steps to create a diag

How to Convert Visio to PowerPoint
If you have a VSDX file that you need to present in your class or meeting, you will need a way to convert Visio to PowerPoint format. In this article, we will understand how to convert VSDX files to P

How to Convert Visio to Word
Converting Visio to Word and other Microsoft formats could be complex and less intuitive. In this article, we will see how to convert Visio to Word and how a registered EdrawMax user can achieve the s

How to Open Visio on Mac
Have you created a diagram file in Microsoft Visio and now want to open it on a macOS or Linux machine? Check this guide to see how it works.

How to Open Visio Files Without Visio
If you have the VSDX format file and do not have access to this Microsoft product, you must be wondering how to open Visio files without Visio. This article will help you understand how to open a Visi
How to Make a Circuit Diagram in Visio
A circuit diagram is a visual representation of the components of an electrical circuit using standard symbols. In this article, we will help you make a circuit diagram in Microsoft Visio, and How Vis
How to Create a P&ID in Visio
The Piping & Instrumentation Diagrams (P&ID) are created to graphically illustrate the piping and related components of any instrumentation process flow. In this article, we will help you create P&ID

How to Create a Value Stream Map in Visio
Most lean practitioners see the Visio value stream map (VSM) as an important fundamental tool to identify the potential risk and waste. This article will help you understand the steps to create a valu

How to Create a Wireframe Diagram in Visio
Wireframe diagrams are the blueprints of a website or a web application that illustrates all the elements required from the client's side. This article will help you understand the steps to create a w

How to Create a Mind Map in Visio
A mind map involves writing down a central theme or idea and thinking of new and related ideas that help explore the central idea better. In this article, we will provide you with the steps of creatin

How to Create a Decision Tree in Visio
We often see business owners face a dilemma in deciding the best possible option for them. In this article, we will compare MS Visio and EdrawMax by outlining some of the most common differences betwe

How to Create a Floor Plan in Visio
Floor Plans are the very first architectural drawing that is submitted to the client to get their approval. In this article, we will compare the steps you need to follow to create the Visio floor plan

How to Create a Gantt Chart in Visio
Gantt charts are typically used to plan and schedule all projects, irrespective of their deliverables and turnaround time. Check this guide to know how to create a Gantt Chart in Microsoft Visio and a

How to Create a Timeline in Visio
Wondering how to create a timeline in Visio? Check out the EdrawMax guide to know how you can create a timeline in MS Visio and how you can take the help of Visio timeline templates provided by EdrawM

How to Draw a UML Diagram in Visio
Wondering the method of drawing a UML diagram in Microsoft Visio? Check out the this elaborate guide to understanding how to draw a UML diagram in Visio and an easier way.

How to Create a Sequence Diagram in Visio
Sequence diagrams play a vital role when one submits documentation pertaining to the details of the new system. Check out the this elaborate guide to understanding how to create a sequence diagram in

How to Create an ER Diagram in Visio
Most system development engineers often wonder how they can access Visio ER diagram or how they can easily create an ER diagram. Check out the this elaborate guide to understanding how to create an ER

How to Create an Organizational Chart in Visio
Most business analysts often wonder how they can access Visio organizational chart wizard or how they can easily create an org chart. Check out the this elaborate guide to understanding how to create

How to Create a Workflow Diagram in Visio
By creating workflow diagrams, budding business analysts can understand who is responsible for which task at what point in the given process. Check out the this elaborate guide to understanding how to

How to Draw a Process Flow Diagram in Visio
Are you wondering what is a process flow diagram or how you can make a process flow diagram in Visio? Learn from this article to know everything about how to make a process flow diagram in Visio and a

How to Create a Flowchart in Visio
Wondering how to create a flowchart in Visio? Check out the EdrawMax guide to understand more about flowcharts and how to create them in an easier way.

How to Create a Data Flow Diagram in Visio
Have you ever wondered how to create a data flow diagram in Visio? Check out the EdrawMax guide to understand more about data flow diagrams and how to create them in an easier way.

How to Draw a Network Diagram in Visio
EdrawMax specializes in diagramming and visualizing. Learn from this article to know everything about how to make a network diagram in Visio and the easier way. Just try it free now!

How to Draw a Network Diagram in Word
EdrawMax specializes in diagramming and visualizing. Learn from this article to know everything about how to make a network diagram in Word and the easier way. Just try it free now!

How to Draw a Network Diagram in PowerPoint
EdrawMax specializes in diagramming and visualizing. Learn from this article to know everything about how to make a network diagram in PowerPoint and the easier way. Just try it free now!

How to Draw a Network Diagram in Excel
EdrawMax specializes in diagramming and visualizing. Learn from this article to know everything about how to make a network diagram in Excel and the easier way. Just try it free now!

How to Draw a Project Network Diagram in Excel
EdrawMax specializes in diagramming and visualizing. Learn from this article to know everything about how to make a project network diagram and easier way. Just try it free now!

How to Draw a Network Diagram in MS Project
EdrawMax specializes in diagramming and visualizing. Learn from this article to know everything about how to make an MS Project network diagram and easier way. Just try it free now!
How to Draw a Rack Diagram in Excel
EdrawMax specializes in diagramming and visualizing. Learn from this article to know everything about how to make a rack diagram in Excel and an easier way. Just try it free now!
How to Draw a Rack Diagram in Visio
EdrawMax specializes in diagramming and visualizing. Learn from this article to know everything about how to make a rack diagram in Visio and an easier way. Just try it free now!

How to Draw an AWS Diagram in Visio
EdrawMax specializes in diagramming and visualizing. Learn from this article to know everything about how to make an AWS diagram in Visio and an easier way. Just try it free now!

How to Draw an Azure Diagram in Visio
EdrawMax specializes in diagramming and visualizing. Learn from this article to know everything about how to make an azure diagram in Visio and an easier way. Just try it free now!

How to Draw an Active Directory Diagram in Visio
EdrawMax specializes in diagramming and visualizing. Learn from this article to know everything about how to make an active directory diagram in Visio and an easier way. Just try it free now!

How to Draw a Cisco Network Diagram in Visio
EdrawMax specializes in diagramming and visualizing. Learn from this article to know everything about how to make a Cisco network diagram in Visio and an easier way. Just try it free now!
How to Draw a Network Diagram
EdrawMax specializes in diagramming and visualizing. Learn from this article to know everything about how to design your network diagram with ease. Just try it free now!

How to Draw a Network Topology Diagram
EdrawMax specializes in diagramming and visualizing. Learn from this article to know everything about how to design your network topology diagram with ease. Just try it free now!
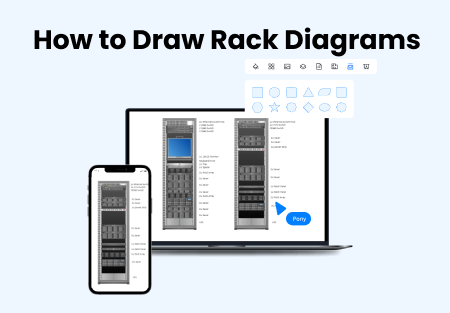
How to Draw a Rack Diagram
EdrawMax specializes in diagramming and visualizing. Learn from this article to know everything about how to draw your rack diagram with ease. Just try it free now!

How to Draw an AWS Architecture Diagram
EdrawMax specializes in diagramming and visualizing. Learn from this article to know everything about how to draw your AWS diagram with ease. Just try it free now!

How to Draw an Azure Architecture Diagram
EdrawMax specializes in diagramming and visualizing. Learn from this article to know everything about how to draw your Azure architecture Diagram diagram with ease. Just try it free now!

How to Draw a GCP Architecture Diagram
Google Cloud Architecture Diagrams are technical and require professional help. EdrawMax is an all-in-one diagramming tool with creative solutions to your diagramming needs.

How to Draw a Neural Network Diagram
EdrawMax specializes in diagramming and visualizing. Learn from this article to know everything about how to draw your neural network diagram with ease. Just try it free now!

How to Make a Floor Plan in Excel
Wondering how to make a floor plan in Excel format? Check out the EdrawMax guide and create wonderful floor plans for your project.
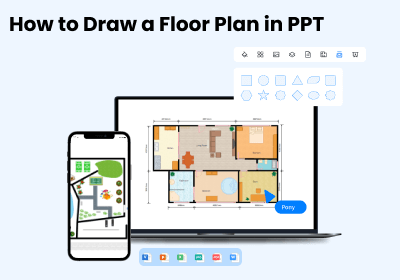
How to Make a Floor Plan in PowerPoint
Create professional floor plans in PowerPoint and other formats using the free templates provided by EdrawMax.
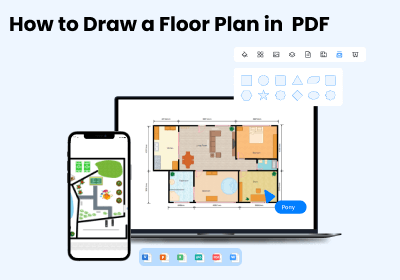
How to Make a Floor Plan in PDF
Create and download a floor plan in PDF and other formats from this EdrawMax floor plan guide.
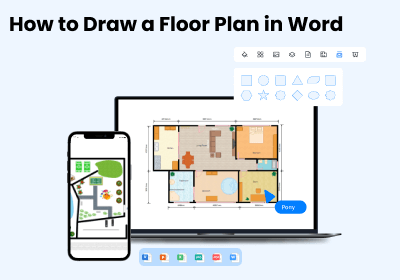
How to Make a Floor Plan in Word
Check out the EdrawMax guide to make a floor plan in Word and other Microsoft formats using free floor plan templates and symbols.
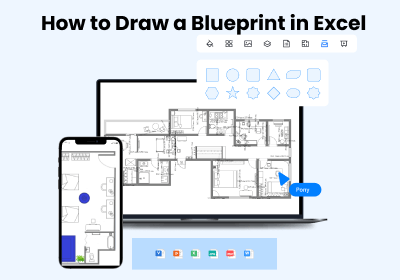
How to Make a Blueprint in Excel
Wondering how to make blueprints for your building project? Check out this EdrawMax guide that helps you understand how to make a blueprint in Excel and other formats.

How to Make a Blueprint in Word
Have you ever wondered how to make a service blueprint in Word and other formats? Check out the EdrawMax service blueprint guide to understand more about floor plans.

How to Draw a Building Plan in Word
If you need to draw a building plan with Word, check out this EdrawMax guide to understand how to create building plans using free templates and symbols effectively.

How to Create a Wardrobe in PowerPoint
A wardrobe planning presentation (PPT) lets you easily share your wardrobe design with your team. Check out EdrawMax's guide to creating a wardrobe plan in PPT and other formats.

How to Create a Wardrobe in Excel
Looking for a wardrobe design for your apartment? Check out the EdrawMax guide to draw a wardrobe in Excel and other formats.

How to Create a Wardrobe in Word
Wardrobe in Word lets you better understand your closet requirements. EdrawMax lets you create and share wardrobe plans in Word and other formats.

How to Draw an Elevation in Word
The elevation plan in Word and other formats illustrates the orthographic representation of the exterior of any building. Learn how to draw an elevation plan using the free templates and symbols provi

How to Draw a Security Plan in PowerPoint
Security Access Plan is very important when designing the floor plan. Create and share some complex security plans in PPT format using the amazing features of EdrawMax.

How to Draw a Security Plan in Excel
Check out EdrawMax's extensive guide to learn how you create security plans in Excel and other formats using free templates and symbols.

How to Draw a Security Plan in Word
Looking to learn how to draw a security plan in Word? Check out the EdrawMax guide about security and access plans and design security plans for your building projects.

How to Draw a Security Plan
Head to this security and access plan guide, where we elaborate on different ways to draw a security and access plan using free templates and symbols resources with EdrawMax. Just try it free now!

How to Design a Bedroom Floor Plan
Head to this bedroom floor plan guide, where we elaborate on different ways to draw a bedroom floor plan using free templates and symbols resources with EdrawMax. Just try it free now!

How to Draw a Bathroom Floor Plan
Head to this bathroom floor plan guide, where we elaborate on different ways to draw a bathroom floor plan using free templates and symbols resources with EdrawMax. Just try it free now!
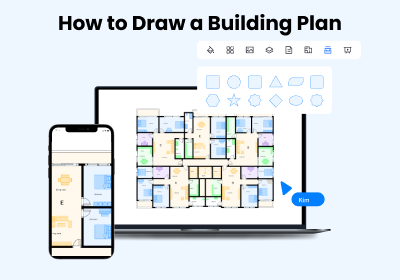
How to Draw a Building Plan
Head to this building plan guide, where we elaborate on different ways to draw a building plan using free templates and symbols resources with EdrawMax. Just try it free now!

How to Draw a House Plan in PowerPoint
Learn how to draw a house plan in PowerPoint and try an easier way to draw house plans in EdrawMax with free templates and symbols resources. Just try it now!

How to Draw a House Plan in Excel
Learn how to draw a house plan in MS Excel and try an easier way to draw house plans in EdrawMax with free templates and symbols resources. Just try it now!

How to Draw a House Plan in Word
Learn how to draw a house plan in MS Word and try an easier way to draw house plans in EdrawMax with free templates and symbols resources. Just try it now!

How to Draw a HVAC Plan in Visio
Learn how to draw a HVAC plan in Visio and try an easier way to make office layouts in EdrawMax with free templates and symbols resources. Just try it now!

How to Draw a HVAC Plan in Word
Learn how to draw a HVAC plan in MS Word and easier way to make HVAC plans in EdrawMax with free templates and symbols resources. Just try it now!

How to Draw an Office Layout in Word
Learn how to draw an office layout in MS Word and easier way to make office layouts in EdrawMax with free templates and symbols resources. Just try it now!

How to Make a Seating Chart in PowerPoint
Learn how to make a seating chart in MS PowerPoint and easier way to make seating charts in EdrawMax with free templates and symbols resources. Just try it now!

How to Make a Seating Chart in Excel
Learn the generic steps to make a seating plan in Excel and also see how free seating plan templates from EdrawMax lets you create the same seating chart in just a few minutes.

How to Make a Seating Chart on Word
Learn how to a seating chart on MS Word and easier way to make seating charts in EdrawMax with free templates and symbols resources. Just try it now!

How to Draw an Evacuation Plan in PDF
Learn how to draw the evacuation plan in PDF and easier way to draw evacuation plan in EdrawMax with free templates and symbols resources. Just try it now!

How to Draw an Evacuation Plan in PowerPoint
Learn how to draw the evacuation plan in MS PowerPoint and easier way to draw evacuation plan in EdrawMax with free templates and symbols resources. Just try it now!

How to Draw an Evacuation Plan in Excel
Learn how to draw the evacuation plan in MS Excel and easier way to draw evacuation plan in EdrawMax with free templates and symbols resources. Just try it now!

How to Draw an Evacuation Plan in Word
Learn how to draw the evacuation plan in MS Word and easier way to draw evacuation plan in EdrawMax with free templates and symbols resources. Just try it now!

How to Draw a Garden Design in Excel
Learn how to draw the garden design in MS Excel and why EdrawMax lets you draw garden designs easily with free templates and symbols resources. Just try it now!

How to Draw a Garden Design in Word
Learn how to draw the garden design in MS Word and why EdrawMax lets you draw garden designs easily with free templates and symbols resources. Just try it now!
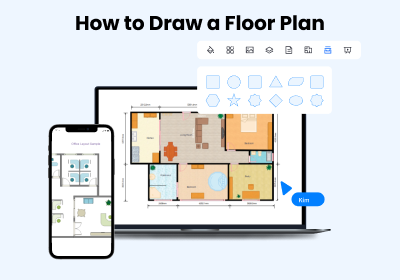
How to Draw a Floor Plan
Head to this floor plan guide, where we elaborate on different ways to draw a floor plan using free templates and symbols resources with EdrawMax. Just try it free now!
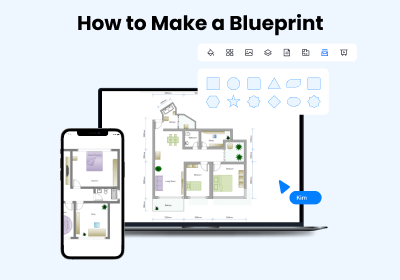
How to Make a Blueprint
Wondering how to make blueprints for your project? Start using EdrawMax and avail the free blueprint drawing templates and symbol resources. Just try it free now!

How to Draw an Elevation Plan
The elevation drawing depicts the orthographic view of your building. With EdrawMax, you can draw an elevation with templates and symbols resources easily.
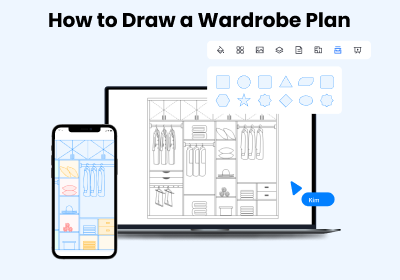
How to Draw a Wardrobe Plan
Wardrobe design is a crucial part of architecture programs. EdrawMax lets you plan wardrobe design with free templates and symbol libraries. Just try it free now!
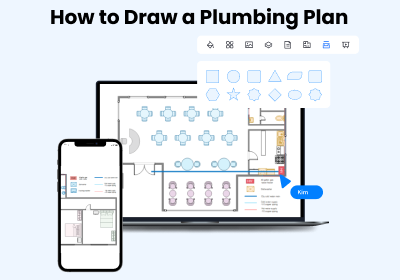
How to Draw a Plumbing Plan
Creating a plumbing layout plan with EdrawMax becomes simple with free symbols and an enormous template community. Just try it free now!
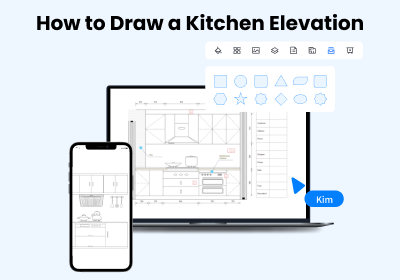
How to Draw a Kitchen Elevation
With EdrawMax, you can design a kitchen elevation drawing and give the orthographic illustration of the exterior of your kitchen layout.

How to Draw a Reflected Ceiling Plan
Wondering how to draw a reflected ceiling plan with free RCP software? Check out the EdrawMax guide and learn the easy way to draw a reflected ceiling plan within minutes.

How to Draw a House Plan
Wondering how to make a house plan with free house plan maker? Check out the EdrawMax guide and learn the easy way to make a house plan within minutes.

How to Draw a HVAC Plan
HVAC plans are important for understanding heating, ventilation, and air-conditioning systems. Create HVAC plans using free templates and symbol resources with EdrawMax.
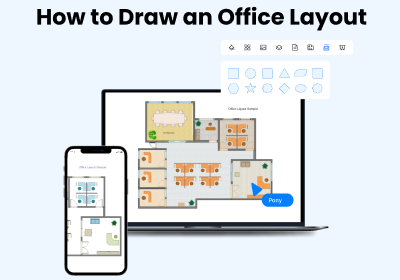
How to Draw an Office Layout
Designing an office layout is important for any office space. With EdrawMax, you can create an office layout with free templates and symbols.

How to Make a Seating Chart
Wondering how to make a seating chart with free seating chart maker? Check out the EdrawMax guide and learn the easy way to make multipurpose seating charts within minutes.

How to Draw an Evacuation Plan
Wondering how to design an evacuation plan with free evacuation plan software? Check out the EdrawMax guide and learn the easy way to draw an evacuation plan.

How to Draw a Landscape Plan
Wondering how to design a landscape plan with free landscape plan software? Check out the EdrawMax guide and learn the easy way to create a landscape plan.

How to Design a Garden Plan
Are you wondering how to design a garden plan easily? Check out the EdrawMax guide and create your garden layout with free templates and symbols.

How to Pick the Best Size for an Infographic?
This article will tell you about the best size of the infographics for social media platforms, printouts, blog posts and mobile devices.

How to Make a Gantt Chart in Tableau?
In this article, we will see all about the Tableau software and how to make a Gantt Chart using it. We will also see the best alternative of tableau and how to make a Gantt chart on it.

How to Make a P&ID in Visio?
P&ID is a handy way of illustrating the working models of different machines and systems. Use EdrawMax to design the most beautiful diagrams in few simple steps.

How to Make a Mind Map in Canva
Learn about how to create a mind map in Canva, EdrawMind, and EdrawMax. In the end, we will see which software is best for the mind map purpose.

How to Make a Mind Map in Coggle
Learn how to make a mind map in Coggle and tell the differences between Edraw and Coggle.

Free Hotel Floor Plan Templates & How to Design
A hotel floor plan is pivotal to ensuring that a hotel is thoughtfully designed. But how do you create a hotel floor plan? Read on for EdrawMax’s in-depth guide on how hotel floor plan best practices,

How to Use Six Sigma
This page will tell you how to make Six Sigma diagrams and how to use Six Sigma strategies.

How to Create a Cluster Diagram
You may have heard of the cluster diagram but have no idea how to make your own cluster diagram.

How to Make a Bubble Diagram
You may have heard of the bubble diagram but have no idea how to make your own bubble diagram.

How to Create a Logical Network Diagram
You may have heard of the logical network diagram but have no idea how to create a logical network diagram on your own.

How to Make A Booch OOD Diagram
This is a useful guide to help you create a Booch Ood diagrm in EdrawMax with ease. The Booch Ood diagram is as the base of UML. Check this guide and get started now!

How to Create A Cisco Network Diagram
You may have heard of the Cisco network diagram but have no idea how to create your own Cisco network diagram.

How to Draw a Nassi-Shneiderman Diagram
This is a useful guide to help you create a Nassi-Shneiderman diagrm in EdrawMax with ease. The Nassi-Shneiderman diagram is used to illustrate high-level programming languages.

How to Make A SSADM Diagram
This is a useful guide to help you create a SSADM diagrm in EdrawMax with ease. The SSADM diagram is used in the IT and telecoms fields. Check this guide and get started now!

How to Do A SWOT Analysis
You may have heard of the SWOT analysis but have no idea how to do your own SWOT analysis.

How to Make A Yourdon and Coad Diagram
This is a useful guide to help you create a yourdon and coad diagrm in EdrawMax with ease. The yourdon and coad diagram is used to illustrate the flow of data within a system.

How to Read a Reflected Ceiling Plan
You may have heard of the reflected ceiling plan but have no idea how to read it.

How to Conduct PEST Analysis
You may have heard of the PEST analysis but have no idea how to conduct it.

How to Conduct Five Forces Analysis
You may have heard of the five forces analysis but have no idea how to conduct it.

How to Create an Affinity Diagram
You may have heard of the affinity diagram but have no idea how to make your own affinity diagram.

How to Apply the Plan-Do-Check-Act (PDCA) Model
You may have heard of the PDCA model but have no idea how to apply it.

How to Use A Matrix Diagram
You may have heard of matrix diagram but have no idea how to use it.

How to Use the BCG Matrix
You may have heard of Boston Consulting Group (BCG) but have no idea what the BCG Matrix is.

How to Use the Ansoff Matrix
You may have heard of the Ansoff Matrix but have no idea how to use it.

How to Draw and Use Force Field Analysis
A force field analysis illustrates the factors that cause changes to occur in an organization.

How to Create a Roadmap
You may have heard of roadmaps used in management but have no idea how to create a roadmap easily.

How to Diagram Your Business Process
Having a business process diagram is a much more effective tool of communicating with your team about business processes than simply writing them down.

How to Create a Meeting Agenda
A meeting agenda is given to participants of the meeting ahead of time, and will include key talking points, acts as a time-management tool, and defines the expectations of the meeting.

How to Use Value Chain Analysis
Businesses can use the information obtained from value chain analysis to determine ways to gain a competitive advantage and increase their profits by operating more efficiently.

How to Create a Cause and Effect Diagram
An cause and effect diagram is a diagram used to identify the cause of an effect or a problem.

How to Create a TQM (Total Quality Management) Diagram
Total quality management (TQM) diagrams are a customer-centric diagram used to map out the key areas of quality improvement needed to ensure customer satisfaction.

How to Use Kanban
You may have heard of kanban diagrams but have no idea how this diagram can help people see the flow of tasks.

How to Create an Industrial Control Diagram
You may have heard of industrial control diagrams but have know idea how this diagram can help people automate and operate industrial processes.

How to Create a Logic Gate Diagram
You may have heard of logic gate diagrams but don't know street lighting is a common application of logic gates.

How to Draw an Electrical Wiring Diagram
An electrical wiring diagram shows both the components of a circuit as simplified shapes and signal connections between devices.

How to Create a UML Timing Diagram
You may have heard of the UML timing diagram but have no idea how this diagram can help you display the changes over time.

How to Create a UML Interaction Overview Diagram
You may have heard of the UML interaction overview diagram but have no idea how to create your own diagram easily.

How to Create a UML Profile Diagram
You may have heard of the UML profile diagram but have no idea how this diagram can help you illustrate the inner workings of a system.

How to Create a UML Communication Diagram
You may have heard of the UML communication diagram but have no idea how this diagram can help you illustrate the procedure of the online shopping.

How to Create a UML Composite Structure Diagram
You may have heard of the UML composite structure diagram but have no idea how this diagram can help you illustrate the inner workings of a system.

How to Create a UML Object Diagram
You may have heard of the UML object diagram but have no idea how this diagram can help you illustrate the inner workings of a system.

How to Create a UML Sequence Diagram
You may have heard of the UML sequence diagram but have no idea how to make your own UML sequence diagram easily.

How to Create a UML Diagram
You may have heard of the UML diagram but have no idea how UML diagram can help you express the inner workings of a system.

How to Create a Birthday Card
You may know a birthday card can be used to express your wishes but have no idea how to create a birthday card easily.

How to Draw Geometry Diagrams
You may know geometry diagrams are very useful but have no idea how to draw geometry diagrams easily.

How to Create a Chemistry Diagram
You may know chemistry diagrams are very useful, but don't know how to make your own chemistry diagrams easily.

How to Create a Biology Diagram
You may know biology diagrams are very useful but don't know how to create your own biology diagram easily.

How to Create a Dashboard
A dashboards is always used to display a variety of charts and data relating to key performance indicators (KPIs) in business.

How to Make an Infographic?
Infographics are used to visually represent information or data in a graphic manner. Create free and beautiful infographics in minutes. No design skills are needed.

How to Design a Book Cover
A book cover is a protective covering used to blind together the pages of a book.

How to Make a Poster
Posters are a popular method of marketing and advertising due to its relatively low cost of production, as well as their ability to be mass produced.

How to Make a Storyboard
Storyboarding a project or process is a simple way to visualise a sequence of events.

How to Make an Object Role Model (ORM) Diagram
The ORM diagram is a diagram which can be used for data modelling in software engineering.

How To Make a Chen ER Diagram
Chen ER diagram is an entity relationship diagram introduced by Chen. These diagrams are a good entry step to understanding the database structure, especially for basic databases or examples.

How to Develop an Organizational Structure
The organizational structure is a visual diagram that describes a hierarchy within an organization or a company.

How to Make a Hierarchy Chart
A hierarchy chart displays ideas, individuals and information in boxes based on importance.

How to Make a Circle Spoke Diagram
Circle spoke diagrams are incredibly useful in the planning stages of a project, as they allow you to map out all of the possible components that make up the central item.

How to Make a Process Map
Process maps are most commonly used in the planning stages of a project, in order to map out the various steps in a workflow.

How to Create an EPC Diagram
Event-driven process chain diagrams (EPC) are a type of flowchart used for resource planning and business improvement. While they are modelled similarly to flowcharts, there are symbols and notation u

How to Create an SDL Diagram
Specification and Description Language (SDL) is a computer-science language used to describe the behaviour and reactions of a system’s components. SDL gives users an overview of a complex system.

How to Make a Genogram in PowerPoint
Some people may confuse about how to make a genogram in PowerPoint. Now let's make a genogram on PowerPoint together.

How to Make a Genogram in Word
Many people may be confused by making a genogram in on Microsoft Word. How do I create a genogram using Word? The answer is simple. Let's do it together.

How to Study for the GRE: The Beginner's Guide
We have plunked down with some practiced GRE test-takers who gave us knowledge into planning for the large, awful GRE.Peruse on to explore techniques that can assist you with accomplishing this score,

How to Study for the GMAT: The Beginner's Guide
The GMAT is a different decision, versatile (CAT-Computer Adaptive Test) test that adjusts to your presentation as you're stepping through the exam The test is PC based and is regulated in chosen area

How to Draw Lab Diagrams Easily
The laboratory diagram (Lab Diagram) is a graphic tool representing an experiment's specific description to give a clear image for people who want to figure out experiments or studies to help people u

The Actionable Guide: How to Build a Theoretical Framework
The theoretical framework is the structure that can hold or support a theory of a research study. Read this article to know how to build a theoretical framework.

How to Perform a Situation Analysis Effectively
Situation Analysis is a collection of methods that critically evaluate the internal and external conditions affecting an organization.

How to Create a Database Diagram
In this guide, we will talk about what a database diagram is and why it matters for the success of a business.

How to Create A Customer Journey Map
Follow this easy-to-read guide and learn about how to create a comprehensive customer journey map. Using this powerful tool to understand your customers' experiences in all activities.

How to Conduct a Competitive Analysis (Free Templates)
How to do a proper competitive analysis and step by step guide to make a competitive analysis diagram with free template. Why does it? If done accurately, it can make your business thrive in the marke

How to Make a Marketing Plan for Your New Product
Today, we will show you how to make a product marketing plan to shoot your new product straight to the stars.

House Wiring Diagram: A Ultimate Tutorial
A house wiring diagram is a visual representation of the electrical system or circuit in a house. This article is an ultimate tutorial for home wiring diagram.

How to Create a Stunning Map Infographic?
Are you looking for map infographics? We have hundreds of free map infographic examples with various themes and tutorials for you. Try it today!

How to Create PowerPoint Presentation for a Workflow Diagram
Create PowerPoint Presentation for a workflow diagram can be as easy as a pie with Edraw workflow diagram creator.

Create Stunning Workflow Diagram on Mac
Create stunning workflow diagrams on Mac super easily in Edraw Max. This tutorial shows you how to create workflow diagrams without hassles.

Simple Guide on Creating a Workflow Diagram for Word
This article offers a simple but effective guide on creating a workflow diagram for word.

How to Create a Workflow Diagram for Excel Quickly
Edraw workflow diagram creator provides users a super easy way to create a workflow diagram for excel and this article will introduce it to you step by step.

Simple Steps to Create Value Stream Map for Word
Our value stream map software is the ideal and easy-to-use program to create value stream map for Word which simplifies the process into several mouse clicks!

Guide on Creating Value Stream Map for Excel
This article provides a step-by-step guide on how to create value stream map for excel quickly and easily.

Create UML Diagram Easily on Mac
Create UML diagram on Mac with Easy desktop software easily. You can work on Mac OS X to draw professional UML diagrams in a fast way even without any experience.

How to Create A UML Package Diagram
UML Package Diagrams are constructs that help you organize model elements into groups. They can group together elements that are related. This article will show you how to create one easily and fastly

Easy Guide for Creating UML Collaboration Diagrams
How to create a UML Collaboration diagram? Read this guide to know the relations and interactions among software objects in the Unified Modeling Language.

UML Class Diagram - Create UML Class Diagrams
UML class diagram represents the static view of an application, which can be used both for general conceptual modeling and detailed modeling. Here is a guide on how to create UML class diagrams.

How to Track Project Progress Using Gantt Chart?
Tracking project progress is an essential working part in project management. This page introduces how to track project progress using Gantt chart.

Gantt Charts for Manufacturing Process
How to draw a Gantt chart for manufacturing process and manage the process visually? Read this article to learn manufacturing process with interactive Gantt charts.

Create P&ID for Word on Mac
Create P&ID for MS Word with automatic diagramming software to save time and money up to 50%. Get started as fast as possible with premade shapes or ready-made word P&ID templates. It can work on Mac

Create P&ID for PPT
Create a audience-friendly P&ID in PPT at ease. Edraw allows users to make P&ID for PPTX on both Mac OS X and Windows system. Check out how to do it in the following guide.

Create P&ID for PDF
An easy, cheap, cloud-based and cross-platform P&ID software is available. Why not try it for free? Create high quality and visually pleasing P&ID for PDF easily. You can even a number of ready-made P

Create P&ID for Excel
Here is an easy and powerful P&ID design software for users from all levels to generate professional P&IDs and export to Excel seamlessly. It runs on all major platforms: Windows, Linux, and Mac OS X.

Create Organizational Chart for PPT
Create a presentation-quality organizational chart in PPT at ease. Edraw allows users to make organizational chart for PPTX on both Mac OS X and Windows system. This tutorial will teach you how to mak

Create Organizational Chart for PDF
Create high-quality and visually pleasing organizational charts for PDF easily. Multiple platforms are supported including Windows, Mac os x and Linux.

How to Create Organizational Chart for Supermarket Quickly
Creating an organization chart for supermarket helps divide the functions of each department of supermarket clearly and enables them work more efficiently.

How to Create Organizational Chart for Automotive Industry
Choosing Edraw org chart creator to create organizational chart for automotive industry saves you much time and energy.

Create Organizational Chart on Mac
Here is an instant and easy way to create, update and share your organizational chart. Our org chart software comes equipped with tools that generate hierarchies, distribute and connect shapes automat

Create Municipal Organizational Chart in Minutes
Creating municipal organizational charts would be a breeze with Edraw Organizational Chart Maker.

Create Network Diagram for PDF
Create high quality and visually pleasing network diagrams for PDF easily. Edraw helps you make stunning network diagrams and export to PDF with one click. Multiple platforms are supported including W

Quickly Draw Network Diagram on Mac
Quickly draw professional network topology diagrams, rack diagrams, Cisco diagrams and many more on Mac. Built-in smart shapes and auto connection help you go a lot faster and much more smoothly.

How to Use Mind Maps for Better Meeting Management
An effective meeting needs an organized managment plan. By the most productive tool, meeting organizers will use mind maps for better meeting management so as to keep the meeting smoothly.

How to Run a Brainstorming Session: A Step-by-Step Guide
Brainstorming has a widely use in business field. Here introduces a guidance and tips for how to run a brainstorming session.

How to Plan a Trip with Mind Maps
Mind mapping a trip plan enables you to know the bueget, places to go and time schedule any time. Want to learn how to plan a trip with mind maps easily in no time? Enjoy a well-organized trip with th

How to Mind Map Your To Do List: Several Tips for You
Learn how to draft an engaging and thoughtful to-do list in this extensive post. It has also included a step by step tutorial to use a free to-do list planner tool.

How to Make a Book Summary with a Mind Map? - An Easy Guide
Mind map is an efficient tool to make a book summary. This article will show you the basic concepts and benefits of mind maps, and how to make a book summary with a mind map.

Use Mind Maps for Better Presentations
Mind mapping is widely used in business speeches as a slideshow tool. Edraw MindMaster brings you 3 tips to use mind maps for better presentations.

Create Mind Map for PPT
What's the best solution to display a mind map in PowerPoint? This tutorial teaches you how to create a mind map and export to PPT file with a single click. The program supports Mac, Windows and Linux

Create Mind Map for PDF
Create high quality and visually pleasing mind maps for PDF easily. Automatic mind map maker helps generate mind maps quickly and export to PDF with one click. Multiple platforms are supported includi

Mind Map for Writing: how to use mind mapping to plan your writing project
Mind map, as a creativity and productivity tool, has been around for decades, it offers authors simple techniquea for organizing ideas and creating action plans for planning, writing, and marketing bo

How to Export A Mind Map to MS Visio VSDX File
Edraw Mind Map Creator's visio export capability allows you to export a mind map to MS Visio format .vsdx with minimum effort.

Create Mind Map for Excel
What's the solution to display a mind map in Excel? Is there an easy way to create mind map in Excel? This tutorial will tell you how to make a mind map and export to Excel.

How to Create Mind Map on Mac?
Create unique and nice Mind Maps on mac effortlessly with automatic Mind Map software. Auto generation, auto connection and easy formatting make it ridiculously easy to gain a mind map.

Infographics Visio Alternative for Mac
Can't afford Visio? Edraw is a cheap and powerful Visio alternative for making infographics, presentation, diagrams and more on Mac system. Anyone can handle it easily. Try it for free.

Transportation Infographics
An easy-to-use tool helps you create transportation infographics at ease. Abtain a large number of vector transportation clip arts and re-use them to make personalized transportation infographics.

Create Tourism Infographics with Preset Elements
Create tourism infographics with various tourism clip arts and symbols. You can also edit these symbols and clip arts to your liking or insert a local image into your infographics.

Timeline Infographics - Get Your Word Out to the Audience Effectively
Timeline infographics are a great way to visualize a process over a period of time.

Create Technology Infographics with Premade Elements
Infographics are regarded as an effective tool to communicate data. Create infographic with technology theme is super easy with drag-and-drop infographic software. There are plenty of pre-made technol

Best Tips for SEO-friendly Infographics
Do infographics have high SEO value? Can google recognize your infographics? Are infographics useful to help your website rank higher? The answer is yes if you do it the right way. Here are some essen

Create Medical Infographics with Pre-made Elements
How to create great medical infographics? Is there a desktop program that I can make medical infographics out of built-in elements? The answer is to use Edraw - a powerful infographic maker coming wit

How to Do Infographic Research
If you want your infographic to be successful, you have to find an interesting topic that can attract people's attention. But this is only the first step. Before you design your infographic, you have

How to Lay Out an Infographic in 10 Minutes
Learn how to lay out an infographic step by step. This article helps beginners to lay out an infographic effortlessly with detailed guidelines and tips.

How to Insert Pictures into Infographics
Adding pictures to the infographics can greatly enhance your infographics. An easy way on how to insert pictures into the infographics would be introduced in following article.

How to Export Infographics to MS Word
An easy way to export infographics to MS Word.

How to Export Infographics to HTML
A simple guide on how to export infographics to HTML.

Create Fashion Infographics with Built-in Elements
Are you looking for a infographics maker to create fashion infographics? Edrwa Infographic will definitely help you! It is such a smart program which can make you hands free.

How to Export Infographics to PDF
Edraw Infographic Software's export capabilities enable you to export infographics to PDF format for sharing with colleagues.

Create Environment Infographics with Built-in Elements
Drag and drop built-in clip arts and graphics to create environment infographics. Build good-looking infographics for environment in minutes and share on posts and websites.

Create Education Infographics with Pre-made Elements
Create good-looking education infographics with vector education infographic elements. Easy to publish to PDF, PNG, JPEG and share on website.

How to Edit An Existing Infographic Template to Your Needs
A simple guide on how to edit an existing infographic template to your needs and a quick overview of a powerful and humanized infographic maker.

Easiest Method to Design Sport Infographics
An easy way to design sport infographics via Edraw Sport Infographics Design Software.

Easiest Way to Design Science Infographics
With built-in free infographics templates and elements, you can design stunning science infographics you want freely and quickly.

Design Music Infographics Easily within 15 Minutes
Design music infographics with Edraw infographic maker which requires little effort to produce attractive and professional infographics.

Guidelines to Design a Killer Infographic Header
How to design a beautiful infographic header? The general rule for infographic header design is to make the header attractive enough while keep the color or theme as consistent as possible.

How to Design Flowchart Infographics
Flowchart infographics are a creative way to lead readers to the information they are seeking. Thanks to Edraw Infographics Software. its built-in symbols and drawing tools makes designing flowchart i

How to Design Architecture Infographics
Create a new and fresh architecture infographic while keeo it remain objective and in quality content providing mode.

How to Design Animal Infographics within Minutes
A simple guide on how to design animal infographics within several minutes will be introduced in the article.

Create Infographic Easily on Mac
Easily create stunning infographics on Mac with an advanced infographic maker. It has various symbols and templates for you to customize. Try it Free!

Create Timeline Infographics with Templates or from Scratch
How to design timeline infographic like an expert yet spending the least time? This article will show you how to create infographics quickly with templates.

How to Create Information-rich and Persuasive Infographics
Infographics seem to be the most widely-used method to increase the chances of your message to be read, but how you can stand out from the crowd. Information-rich and persuasive infographics should be

Create Business Infographics with Built-in Elements
Creating business infographic is no longer difficult through build-in business clip arts and easy-to-use tools. You are allowed to use pre-made chart and graph templates, insert local images, and appl

Create Architecture Infographics with Preset Elements
When it comes to creating architecture infographics, professional infographics software benefits you more than ever before. You can use various preset templates, clip arts, infographics charts and you

Using Sequence Chart in Teaching
Sequence chart can be an effective aid in teaching. Read this article to learn how to use sequence chart in teaching.

How to Create a Genogram Quickly
This page introduces how a novice can create professional genograms in no time with professional genogram maker - EdrawMax.

Garden Design Software Visio Alternative
Compared with Visio and other Visio-like programs, Edraw is the best affordable Garden Design Software Alternative to Visio for designing garden plans on Windows, Mac and Linux.

Create Gantt Chart for Word
Create a Gantt Chart in Word in a minute isn't difficult at all. Get started as fast as possible with premade shapes or ready-made word Gantt chart templates.

Create Gantt Chart for PPT
Create a visual, precise and attractive gantt chart for PPT at ease. A Mac & Windows Gantt chart maker allows users to make gantt chart from templates and export to PPT file with a single click.

Create Gantt Chart for PDF
Create precise and visually pleasing Gantt chart for PDF easily. With easy Gantt chart maker, you can transfer any Gantt chart to high quality PDF. Multiple platforms are supported including Windows,

Create Gantt Chart for Excel
You've just found an easy way to create gantt chart for Excel, and here is the tutorial. Our program help you make a gantt chart instantly and export to Excel file. It runs on all major platforms: Win

How to Make a Gantt Chart on Mac
In this article, we will see about how to make a Gantt chart on pages and numbers which are the well-known applications of the macOS. We will also see the best alternatives to these applications.

How to Design A Mouthwatering Food Menu Quickly
Great food menu designs help customers make satisfying choices and stimulate appetite. Wondering how to design such a delicious food menu. This article offers you an easy way to create attractive food

How to Create a Flyer Quickly
This page introduces how a novice can create attractive flyers quickly.

Create Flowchart for Word
Create Flowcharts for MS Word at lightening speed with EdrawMax. Get started as fast as possible with pre-made shapes or ready-made flowchart templates.

Flowchart Alternative to Microsoft Visio for Mac
Is there a flowchart maker that can be used on Mac? Try this popular Visio alternative for making flowchart and other drawings on Mac.

Create Flowchart for PPT
Create a presentation-quality flowchart in PPT at ease. Edraw allows users to make flowchart for PPTX on both Mac OS X and Windows system. Start quickly with premade symbols and built-in templates.

Performance Management Flowchart
Performance Management Flowchart is an effective tool to evaluate, manage and improve employees’ performance. This guide will show you how to create a performance management process flowchart.

Create Flowchart for PDF on Mac
A fantastic program that allows you to create high quality flowcharts for PDF easily on Mac, Windows and Linux. A number of ready-made flowchart templates help you start quickly.

How to Create an Audit Flowchart
Audits are an evaluation of a company's financial reports and reporting processes. They are normally carried out by external financial experts. Much like flowcharts, audit diagrams are used to illus

How to Create a HR Process Flowchart
Edraw Flowchart Maker and its HR Process solution provide users with a powerful and easy-to-use HR process management tool. This HR process solution extends vector shapes that can be used to to repres

Simple Guide on Creating Flowchart for Switch Statement
Creating flowchart for switch statement is a good way for software engineers to improve clarity and offer the potential for faster execution.

Create Flowchart for Decision Making within 5 Simple Steps
Creating a flowchart for decision making drastically helps people, especially those who are too indecisive to make a rational choice quickly. And EdrawMax provides templates to help you.

How to Create Flow Chart for Loan Management
Creating flow chart for loan management enables customer managers to manage and make rational use of their loans and find out the reason quickly if there is something goes wrong during the process.

Create Flowchart for Excel
You've just found an easy way to create flowchart for Excel, and here is the tutorial. EdrawMax helps you make a flowchart instantly and export to Excel file with one click.

Customer Service Flowchart
A great customer service flowchart helps to improve customer relations and enhance your business development.

Create Flowchart on Mac
Create unique and good-looking flowcharts on mac easily with automatic flowchart software. Auto generation, connection and easy formatting save lots of time and energy.

How to Create A Flowchart for Resignation Process
A flowchart will make it easier for employees to follow the resignation process once they decide to resign. Then how to create a flowchart for resignation process?

How to Create a Quotation Flowchart
A quotation flowchart enables sales people know the process of the order and take actions appropriately to close the order with customers.

Quick Steps to Create a Product Development Flowchart
Product development flowchart visually outlines the essential processes of developing a new product, which enables product managers to follow up the project more effectively.

How to Create Deployment Flowchart Easily
Creating a deployment flowchart to highlight the relationships between stakeholders in inefficiency, duplication or unnecessary processing in addition to the process flow.

How to Draw a Construction Flowchart
Construction is the process of constructing a building or infrastructure. It is very serious and rigorous, so before starting constructing, engineers will draw a construction flowchart to help themsel

How to Convert Flowchart to PDF
Edraw Flowchart maker is a cross-platform flowchart software and compatible with Microsoft Office, which enables users to convert flowchart to PDF very conveniently.

Create Floor Plan for PPT
Create a PPTX format that is much better than PowerPoint's work. EdrawMax is an easy and efficient solution. It works on both Mac OS X and Windows system. Read the following tutorial to find out how.

Create Floor Plan for Excel
Want to gain an easier way to create floor plan in Excel? Our program helps you make a floor plan and save as Excel file instantly. It runs on Windows, Linux and macOS.

Create Floor Plans on Mac
Learn how to create floor plan on Mac OS X easily and quickly. Use automatic floor plan software equipped with smart shapes to create floor plans in an amazingly simple way.

Create Home Rewiring Plan: Rewire an Old House Easily and Properly
An electrical rewire is one of the most disruptive jobs that can be applied to a house. This tutorial will show you how to create home rewiring plan for rewiring an old house properly.

Create Fishbone Diagram for Word
Fishbone diagram plays an important role in various industries. The Edraw Max provides solutions to make professional-looking fish bone diagrams for Word in minutes.

Fishbone Diagram Visio Alternative for Mac
Is there a fishbone diagram program used on Mac similar with Visio? We provide a popular Visio alternative for making fishbone diagram and other drawings on Mac system. It offers more useful capacitie

Create Fishbone Diagram for PPT
Making fishbone diagrams in Microsoft PowerPoint is not very convenient. Need a fishbone diagram for your PPT presentation? Edraw Max offers you not only professional pre-made templates but also numer

Create Fishbone Diagram on Mac Easily and Rapidly
Create fishbone diagram on Mac with desktop diagramming software easily at lightning speed. Use built-in symbols or fully customizable templates can doubtlessly beat time and effort-consuming hand dra

Create Fault Tree Diagram for Word
EdrawMax provide you with plenty of corresponding templates to create your custom fault tree for word in several clicks.

Fault Tree Diagram Visio Alternative for Mac
An affordable and capable fault tree diagram program that works on Mac and can replace Visio. It has gained international popularity for the strong ability to make fault tree diagrams and other kinds

Create Fault Tree Diagram on Mac
Here are full details on how to create a fault tree analysis diagram on Mac. Built-in shapes with connection points and text boxes, free templates and easy formatting tools make everything as clear as

How to Transfer Edraw Max to another Computer?
Refer to this page to learn how to transfer Edraw Max to another computer when you change computer.

Create ER Diagram for Word
Edraw Max is a desktop software to create ER Diagram for word conveniently. From numerous beautiful templates and symbols, choose elements you like to draw your custom ER Diagram using our ER diagram

ER Diagram Visio Alternative for Mac
Looking for an ER diagram program used on Mac similar to Visio? Edraw is a popular Visio alternative for making er diagram and other drawings on Mac system. It is more powerful than Visio but can save

Circuit Diagram Maker for Word
It's easy to create circuit diagrams for MS Word with professional circuit diagram software. It works on both Mac and Windows systems.

Create Circuit Diagram for PPT
It takes you less effort to create a circuit diagram for MS PPT with professional circuit diagram software. It works on both Mac, Windows and Linux systems.

Create Circuit Diagram for PDF
An easy-to-use software for creating circuit diagram and saving as PDF file. Multiple platforms are supported including Windows, Mac os x and Linux.

Create Circuit Diagram for Excel
With pre-designed electrical symbols, Edraw allows you to create any circuit diagram and export to Excel document on Mac, Windows, and Linux systems.

Create Charts and Graphs on Mac
Here are full details on how to create charts and graphs on Mac. Drag-and-drop shapes, point-and-click editor and text boxes, free templates and easy formatting tools make everything as simple as pie.

Create BPMN for Word
Creating BPMN diagrams for Word is no longer inconvenient. Edraw makes it fluent for you to make BPMN instantly with several mouse clicks. Start immediately from abundant built-in elements and templat

Create BPMN for PPT
BPMN diagrams appear frequently in process explaining presentations. Edraw makes it easy to create the seem-complex BPMN diagram with a professional-looking for your PPT in a second conveniently.

How to Create an Awesome Facebook Banner or Cover Photo
The cover photo or banner area on any Facebook page is prime visual real estate. Some tips on how to design a Facebook banner/cover image that wows your friends, clients and colleagues will be intro

AWS Diagrams for Word
This fast and easy AWS Diagram Software is the best solution to create AWS diagrams for MS Word using its built-in word AWS diagram templates.

AWS Diagram for PPT
Edraw AWS Diagram Software makes it easier to create AWS diagram for PPT on both Mac OS X and Windows system. This article will introduce you how to design and export an AWS diagram to PPT format.

AWS Diagrams for PDF
This AWS Diagram Software gives you ability to create high quality and visually impressive AWS diagrams for PDF on Mac, Windows, Linux quickly. Once the design is completed, you can convert these AWS

Create AWS Diagrams for Excel
An easy but efficient way to create AWS diagrams for Excel on Windows, Linux, and Mac OS X. using our AWS Diagram Software.

Create a Wireframe Diagram for Windows 7 User Interfaces
Create a great wireframe diagram for windows 7 user interface can save you a lot of valuable time by hashing out the details of a site's architecture, functionality, and content.

Simple Steps to Create Weekend Plan Mind Map
Creating a weekend plan mind map for your coming weekend can enable you to fully enjoy a wonderful weekend.

Create Stunning Flowcharts for Website Design
Use visual flowchart to map out your website before building it. Use easy flowchart software to create stunning flowcharts quickly.

How to Use Weather Clipart
Perfect vector-based clipart drawing software with a wealth of weather clipart! Use weather clipart to design vivid diagrams, presentation and so on. Edit clipart easily to fit your own need.

Use Timeline in History Class
Timeline is a great approach to study major historical events in history class. You can create a timeline using smart templates fast and easily.

Mathematics Symbols for Easier Math
When you are typing in Math formula, doing your Math homework, you may feel bored and tired. Edraw has designed a group of mathematics symbols for easier Math.

Use Flowcharts to Advance Education
Applying flowchart software is a paperless and effortless method saving you both time and money. See how you can benefit from flowcharts in the following statement and examples.

How to Create UML Diagrams for Library Management Systems
UML use case diagrams are one of professional uml diagrams for library management systems.

Draw SIPOC Diagram from Swimlane Flowchart
SIPCO diagram can be well presented through a swimlane flowchart. This page simply explains how to make SIPOC diagrams from swimlane flowchart shapes.

How to Read Electrical Schematics
Reading schematics is all about recognizing how electrical symbols and lines are connected. This simple guide will tell you how to read electrical schematics.

How to Read Circuit Diagrams
A circuit diagram shows how electricity flows. From this tutorial, you will recognize circuit diagrams symbols and understand electrical schematic terms easily.

Use Radar Charts for Data Analysis
Radar charts are very useful when comparing performance/measurement results, analyzing statistics, etc. from different sources.

How to Create an Organizational Chart in PowerPoint
SmartArt is a good tool for creating simple diagrams in Powerpoint, but its functionality is quite limited. A better tool is EdrawMax that lets you create Organizational Charts and then export them as

How to Create an Organizational Chart in Word
To create organizational chart in MS Word, EdrawMax designed specifically for the purpose of creating org charts are particularly well-suited to the task.

How to operator OLE object, how to link a OLE object
Edraw is an OLE-compatible application (supports Object Linking and Embedding). This feature lets you use EDraw drawings in other OLE-compatible software, as well as work with other applications' obje

How to Make a Network Diagram in Visio?
This page extends steps to create a computer network diagram while showing you the templates and libraries of symbols that you might need. And then how to export the completed diagram to MS Visio.

How to Create Mind Map for Project Management
The most effecient way to organize your daily work schedule is to put it into a mind map. Mind map your day of your daily work can greatly increase your productivity and make it easier for you to achi

How to Use Mind Maps to Learn a Foreign Language
Mind map is an effective way to learn a foreign language. This article shows how to use mind maps to learn vocabulary, grammar and reading while studying a foreign language.

Use a Mind Map to Prepare a Speech
Mind map is a great tool in preparing and memorizing speech because it can help organize information well and enrich the speech content.

Prepare a Meeting Mind Map
Edraw is an excellent mind map freeware, which will keep you active in the meeting productive. Moreover you will have a complete record of the proceedings and the outcomes of the meetings.

How to Match Clothes for the Best Look
Here is a foolproof guide to matching colors and clothes. Everybody should learn at least some basic principles or dressing since one's outfit is the expression of his inner world.

Basic Steps of Creating Stakeholder Map
A complete stakeholder analysis is a rather complicated task, which needs even more complex method to evaluate the stakeholders' requirements and attitudes.

How to Create a Cross Functional Flowchart
Cross functional flowcharts can utilize both vertical and horizontal swimlanes at the same time, allowing for an increased breakdown of a process.

Make Your Own Calendar Easier
Make Your Own Calendar that is own-exclusive to you, content-customized by you, and distinguished because of you.

Simple Steps to Make a Workflow Diagram
A workflow diagram, as a graphic depiction of the systematic flow of information, is an invaluable analytical tool. It provides a visual step-by-step guide that defines a process, standardizes it and

How to Create a Value Stream Map (VSM)
Create a value stream map to help identify and eliminate the wastes in your processes and make more profit. With extensive premade value stream map shapes, it is quite easy to make quality value strea

How to Make a Sightly To-Do List
Here is a detailed guide about how to make a to-do list that is not useful but also pleasing and attractive to see. This is a simple and easy way which has automated many steps.

Use Free and Printable Templates to Make Shopping Lists
Get free, editable and printable shopping list templates here. Learn how to make it easily on your own in less than 10 minutes.

Make Process Steps Diagram with Smart Maker
Learn how to make process steps diagrams with smart maker - Edraw. A detailed guide with pictures is illustrated here.

Design Postcards - Real Simple DIY
Design a postcard easily on your own in powerful software. Visualize your own creative ideas and do it yourself to gain distinctive postcards.

Make an Effective Mind Map
Edraw Mind Map is an effective freeware which used to represent notes, memory, learning, think creatively, associate ideas, tasks, or other items linked to and arranged around a central key word or id

Make a Kids Worksheet Instantly
Make educational and fun worksheets for your kid. Help preschool kids learn basic knowledge quickly and smartly. Free and printable templates are available here.

Make Beautiful Flash Cards Easily
Here is a detailed guide about how to make your own Flash Card that is not only useful but also pleasing and attractive to see.

Make a Five Forces Chart
Five forces chart is a simple but powerful tool for understanding where power lies in a business situation.

How to Create a Fishbone Diagram
The fishbone diagram, also known as an Ishikawa diagram or a cause and effect diagram, gets its name because it represents a fish skeleton. Fishbone diagrams are great tools when trying to analyze ine

Make A Personalized Christmas Card in 3 Steps
Make a Christmas E-card with your favorite photo and personalized messages for this coming holiday season. In just 3 steps you can finish a good-looking electronic Christmas card. Try it now.

Make Printable Christmas Card With Kids
It will be such a great experience if you and you kids make a Christmas card together. Look at this tutorial - it offers an easy way to make Christmas card with pre-made design elements.

Conduct an Individual SWOT Analysis with Ease
Individuals can use SWOT Analysis for self-improvement - individual SWOT Analysis. Here are some guides about conducting individual SWOT Analysis.

Improve Presentation with Charts and Graphs
Improve presentation to a new level with visual charts and graphs, making it attractive and pleasing. Gain high quality charts and graphs easily in vector-based software.

BPMN Gateways - How to Use Them?
Gateways are used to control the flow of the process and define ramifications in a BPMN diagram. Learn what they mean and how to use them.

How to Draw a Swimlane Diagram
Are you confused on how to draw a swimlane diagram? Here are some guidelines which can be used to ease the understanding the swimlane diagram.

Guides for Electrical Drawing Reading
Learn how to read electrical drawings and get easy-to-use electrical drawing software to create professional-looking electrical drawings.

How to Open and Edit VSD File on Mac
Edraw Max is a great Visio viewer to open and view Visio vsd and vsdx files both on Windows and Mac.

How to Make a Product Canvas - Visualize Your Product Plan
The product canvas is an effective tool in product planning with intuitive features. This page introduces some tips on how to make a product canvas so as to visualize the product plan for a product ma

How to Eat Healthily
Useful guide and informative infographics about how to eat healthily. Free templates and examples perfect for creation of diagrams on healthy diet.

How to Draw a Timeline - Simple Tutorial
Simple Tutorial help you learn how to draw a timeline for your project Schedule and increase you possibilities of understanding and work more effective with the Timeline Software.

How to Make a Gantt Chart
Simple tutorial helps you quickly create a Gantt chart for your project with ease and increase your work productivity with the Gantt Chart Software. Try it now!

How to Draw a Database Model Diagram
Simple tutorial help you learn how to draw a database model diagram for your database design and increase you possibilities of understanding and work more effective with our Database Model Diagram Sof

How to Create A Funnel Chart
Simple but effective guide on how to create a markeing sales funnel in EdrawMax.

How to Create Menu Quickly
Still wondering how to create menu quickly? Read this article and you will find your answer.

Step-by-Step Guide - How to Create an IDEF0 Diagram
This article will show you step by step the easiest way to create an IDEF0 diagram. Various IDEF0 Diagram symbols and templates are provided for getting started.

How to Create a Gauge Chart Quickly
Are you confused on how to draw a gauge chart? Here are some guidelines which can be used to ease the process of creating an effective gauge chart.

How to Create a BPMN Diagram
You can use the new BPMN symbols in EdrawMax to create BPMN diagrams and give business participants the ability to understand their business processes using a graphical notation and to communicate the

Steps to Grow Roses Flowchart
All women love roses for they stand for love. Everyone needs love. However, a lot of people do not really know the steps to grow healthy roses. This grow-roses flowchart will help you solve the headac

Guide for Creating Flowchart | Flowchart Rules
Read the basic rules and guidelines before creating a flowchart. It will help you understand flowchart by knowing its elements and structure.

How to Use Flowcharts to Boost Teaching
See how teachers can use flowcharts in classrooms. Flowcharts can boost teaching greatly for its features of visualization and simplicity.

Quick Steps to Create Employee Performance Evaluation Flowchart
Employee performance evaluation flowchart is a great tool not only for employers to evaluate the contributions employees made to companies and but also for employees to improve their performance accor

Activate Edraw Software without Internet
If your computer has not the internet connection, you can still activate edraw software manually with the following steps.

How to Edit Certificate Template
A beautiful certificate template is not enough! Learn how to edit a template and turn it into your own special certificate!

Drawing simple lines and shapes
In the library menu, you can use these drawing tools to draw line, arc, spiral, rectangle, rounded rectangle, oval, polygon and star shapes

How to Draw 3D Network Diagram
Want to share your network diagram with amazing appearance? Learn a quick way to create an 3D perspective network drawing in Edraw.

How to Draw Toulmin Model Diagram Quickly
Draw a Toulmin Model diagram quickly with ready-to-use shapes. Rely on advanced diagramming tool to gain unique and attractive Toulmin Model Diagrams quickly.

How to Create a Pyramid Chart
EdrawMax empowers you to draw a Pyramid Diagram quickly and easily with prepared libraries which eliminate requirements of drawing experience and skills. Here are detail instructions about this easy

How to Draw Lab Equipment Diagrams
A simple guide about drawing lab equipment diagrams with software. Gain high quality lab equipment shapes and free templates here.

How to Draw Electrical Schematics
Learn how to design electrical schematics with various electrical schematic symbols. Get started quickly with built-in electrical schematic templates.

Draw a Creative Diagram Instantly
To deliver wow, to do it your way and to present something really stands out from the crowd, think about making a creative diagram like no other. Here is a perfect solution offering limitless possibil

How to Make an Arrow Diagram
The fastest and easiest way to draw arrow diagrams is available here. You can definitely make a unique and impressive arrow diagram in less than 5 minutes.

Make an Area Chart Step by Step
Follow this tutorial and learn how to make an area chart within 4 steps.

Design Valentine's Day Cards - Real Simple DIY
Design a Valentine's Day card for your beloved one. Visualize your own creative ideas and do it yourself to gain distinctive Valentine's Day cards.

Design Puzzle Games in the Easiest Way
Design puzzle games with ready-made editable puzzle pieces. Drag and drop function makes the design process quite simple and easy.

Interactive Wireframes to Design Mobile Applications
With good wireframing tools, you can make interactive wireframe to design mobile applications. Good wireframing tools provide you with the best design solution to prototype feature-rich mobile apps ap

Creating Organizational Charts From Data
In Edraw, you can use the Organizational Chart Wizard to import the employee information stored in Excel, CSV, TXT files and generate an organization chart quickly.

Creating Gantt Chart From Data
In Edraw, you can use the Gantt Chart Wizard to import the data stored in Excel, CSV, TXT files and generate a Gantt chart quickly.

How to Create a Scatter Plot
This simple tutorial help you learn how to draw a scatter chart within 4 steps.

How to Create a Pie Chart
This simple tutorial helps you learn how to create a pie chart within 4 steps.

How to Create a Line Chart
This tutorial helps you learn how to draw a line chart within 4 steps.

How to Create a Doughnut Chart
A simple tutorial helps you learn how to draw a doughnut chart within 4 steps

Create Diagram In 4 Easy Steps
Create diagram in minutes using our easy-to-use diagram software. Our professionally designed diagram templates allow you to personalize your design and give it the look and feel that you want.

How to Create a Column Chart
This simple tutorial will help you learn how to make a column chart within 4 steps.

How to Create A Brainstorming Diagram
Brainstorming is an effective method for generating ideas and creatively solving problems.

How to Create a Bar Chart
A simple tutorial helps you learn how to draw a bar chart within 4 steps. Increase your understanding and work more effectively with our Bar Chart Software.

How to Create a Workflow Diagram
Workflow diagrams are used to depict a certain business workflow. A workflow is a series of repeatable activities or patterns that are done to accomplish a business goal.Through EdrawMax, users can

How to Create a Wireframe
Read this article to learn how to create a wireframe quickly.

How to Create Wedding Plan Mind Map
Too many people are worried that they can not make a perfect wedding plan. Mind map maker can solve this problem easily by helping you make wedding plan mind map in minutes.

How to Create WBS Diagram for Project Management
WBS (Work Breakdown Structure) is the foundation of great project management. Learn how to map a project with the help of WBS tool.

How to Make a Venn Diagram
Creating a Venn diagram is easy with pre-made shapes and templates in EdrawMax. Below is a step by step guide on how to create a Venn diagram easily.

A Simple Guide for Creating a Use Case Diagram
With only a few steps, you will finish a good-looking use case diagram with Edraw. Explore the simplicity and convenience of making user case diagrams from this article.

How to Create a UML State Machine Diagram
Edraw is the ideal and professional software for creating UML state chart and this article will provide you a guide about how to create UML state chart.

How to Create UML Deployment Diagram Easily
UML deployment diagram is used by system engineers more and more frequently, but do you know how to create UML deployment diagram? If not, read this article!

How to Create UML Component Diagram Effortlessly
Simple but effective guideline on how to create UML component diagram quickly.

How to Create UML Activity Diagram Quickly
Edraw UML Diagram Software is professional for creating UML activity diagram to describe dynamic aspects of the system.

How to Create A Tree Chart
Make tree chart faster than you can expect with automatic diagram maker. Getting started from ready-made templates which can be edited easily will help you gain sleek-looking tree charts extremely qui

How to Make a System Context Diagram
System Context Diagrams (SCDs) offer a high-level view of a system. It represents an entire system, as well as its boundaries and environment. SCDs illustrate the information flow between a system and

Create SWOT Matrix Instantly
This tutorial provides a simple instruction of creating SWOT Matrix diagram instantly with easy software. Only a few minutes are required with readily availble SWOT shapes and templates.

SVG Software, Create SVG, Drawing Couldn't Be Easier
Edraw SVG Software offers a set of vector drawing tools that can rival a professional illustration program, easy to create SVG.

Design a Subway Map Effortlessly in Minutes
Drawing a subway map is actually a whole lot easier than you think with suitable tool. If you design with predefined shapes, you are many steps ahead of others. With automatic functionalities, you wil

Make a Street Map in Minutes
A street map helps guide you to a place that you've never been before. With street map template and pre-drawn shapes, one can make a nice street map instantly and easily.

How to Create Status Table
This tutorial is provided to help you understand how to create a status table. The easiest way to make a status table is to do it based on the Edraw template and examples.

How to Create a Standard Operating Procedure?
Standard operating procedure or SOP plays an important role in the business that improves working efficiency. This article tells you how to create an SOP easily.

Create Stacked Column Chart in Excel Format
Create a unique and appealing stacked column chart in Excel format with an easier tool. Gain editable column charts in Word, Excel and PowerPoint format via 1 single program.

Create Impressive Stacked Bar Chart Faster than Ever
A step-by-step tutorial shows you how to draw a stacked bar chart. Use quick stacked bar chart templates in our Bar Chart Software to increase efficiency.

How to Create a Spider Chart
A spider chart is a graphical method of displaying multivariate data in the form of a two-dimensional chart of variables represented on axes starting from the same point.

How to Create a Social Media Flowchart
A graphic social media flowchart helps users to get started any new social media quickly. Following are some guidelines to create a professional social media flowchart.

A Complete Guide for Creating SIPOC Diagram
A complete SIPOC design guide help create SIPOC diagrams with pre-made templates. Why to use SIPOC, How to Use SIPOC.

How to Create a Science Diagram Effortlessly
Learn how to create easy and clear science diagram and illustrations with EdrawMax.

How to Create a Sales Process Flowchart
Map out and create a sales flowchart to help people understand complicated sales process. Follow these steps to create a flowchart and manage your sales process.

How to Create Effective and Beautiful Sales Dashboard
Guides and tips on how to make compelling sales dashboard with built-in templates and smart charts by Edraw.

How To Create Reliability Block Diagram
Drag and drop library shapes to create reliability block diagram. Edraw helps you make presentation quality reliability block diagram.

How to Create a Relationship Matrix
This tutorial provides a simple instruction of creating Relationship Matrix Diagram with Edraw Project Management software, which helps ease the process of drawing.

How to Create a Quote Form
Make a beautiful quote form with EdrawMax that you can print and share in minutes - even if you've never created one before.

How to Create a Quality Function Deployment Chart
This tutorial explains how to create a Quality Function Deployment (QFD) diagram with Edraw Project Management software, with which you can have a better understanding of the building process and work

Make Project Management Diagrams
Project management is no easy job with many phases and process. But it can be easier aided by effective software tool and visuals. Learn how to make this kind of visuals here.

How to Create Programming Flowchart
Creating a flowchart for programming will help programmers understand algorithms before writing the code. Read this guide to make a programming flowchart.

How to Create a Process Flowchart
To create a great process flowchart, we suggest that you can start from the following four steps firstly.

How to Create a Process Flow Diagram?
A Process Flow Diagram is a complex diagram requring substencial effort to make, while a nice drawing tool is necessary to help ease the process.

5 Simple Steps to Create Police Organizational Charts
Creating police organizational charts helps employees understand what their roles are within the organization and who to address when decisions must be made.

How to Create a P&ID Drawing
Create P&ID with an easy and highly efficient tool. Here teaches you how to make a professional P&ID step by step - including how to get the P&ID symbols and how to start drawing.

Pictorial Mind Map Creation - Smarter and Easier
Create a pictorial mind map in a smarter and easier way. Check it out in this detailed guide with screenshots.

How to Create a PERT Chart
In this tutorial, you will learn how to create a PERT Chart, including the basic steps and useful tips, which intend to help you work more effectively with EdrawMax.

How to Create an Order Process Flowchart
Have you ever met with the problem that you do not know what to do and who should be responsible for to process an order? Then you need an order process flowchart to help you have a better understandi

How to Create an Operating Model - Deliver Values
The operating model is a key process for an organization to deliver values to their customers. This page offers you a guide on how to design a logical operating model canvas.

How to Make Onion Diagrams
Create an onion diagram by dragging and dropping pre-made templates. Various templates to choose and easy to customize.

How to Create a Newsletter
From the following guide, you will learn the basic steps on how to make professional looking newsletters with Edraw.

Create New Year Card
Create custom New Year cards in easy software with built-in shapes. Do it on your own and make it personalized.

How to Create a Multi-Level Circular Chart
Create a multi-level circular chart by modifying the pre-defined circular chart template in Edraw.

How To Create Markov Chain
Markov chain is easy to draw using pre-made symbols. The following guide will aid you in creating your own Markov chain.

How to Draw a Logistics Flowchart
Learn more about logistics and how to draw logistics flowchart with professional flowchart software.

How to Create a Leaflet
From this passage you will learn the basic steps for creating a leaflet.

Quickly Create Ladder Diagram in Easy Software
Create ladder diagrams quickly in easy diagramming software with premade shapes. Download free templates, type and present as quickly as possible.

How to Create CD & DVD Label
The following article will show you a clear clue on how to create a CD & DVD label with Edraw, you will learn the basic steps and some techniques.

Create Lab Equipment Worksheet Easily
Create lab equipment worksheets easily with pre-made lab symbols and vector icons. Extensive visual materials aid your teaching and learning on science subject.

How to Draw a Job Duties Flowchart
Have you ever experienced a messy working day because of having no idea what to do something or forgetting to do something? A job duties flowchart can do you a favor.

How to Create iPhone UI Wireframe
From this guide you will learn the basic steps and useful tips for creating an iPhone UI wireframe.

How to Create an Invoice Quickly
Follow this tutorial and know how to create an invoice rapidly with examples and easy-to-use invoice maker.

How to Create an Invitation Card
Create custom invitation cards in easy-to-use software - EdrawMax - with built-in symbols. Do it on your own and make it personalized.

How to Create an Inventory List
Make a beautiful inventory list with EdrawMax that you can print and share in minutes - even if you've never created one before.

Create Interrelationship Diagram Instantly
This tutorial provides a simple instruction of creating interrelationship diagram instantly with easy software. Only a few minutes are required to create interrelationship diagram via readily availabl

How to Create a House of Quality Diagram
This tutorial explains how to create a house of quality matrix with Edraw Project Management software, with which you can have a better understanding of the building process and work more effectively.

How to Create House Electrical Plan?
How to create house electrical plans quickly seems to be difficult for most people. Here EdrawMax provides an easy-to-follow tutorial.

How to Create a Histogram Effortlessly
Follow this tutorial and learn how to make a histogram effortlessly.

How to Create a Greeting Card
Create custom greeting cards in easy-to-use card maker - EdrawMax - with built-in design elements and handy formatting tools. Do it on your own and make it personalized.

How to Create Force Field Analysis Diagram
Learn how to draw a Force Field Analysis Diagram to make a change in your life, master this management technique within 4 steps.

How to Use Fault Tree Analysis
Choose a great tool to create fault tree diagrams in the fastest way. Using predefined symbols to draw is definitely an easy method.

How to Create Custom Clothing & Accessories
This article will show you how to create fashion design with an easy computer program. It focuses on new beginner and amateurs who don't know much about drawing.

How to Create Family Tree
Family trees are a great way to find out more about your family history. It can reveal information about and familial relationships with distant relatives that you never knew existed. Family trees can

How to Create an Exploding Pie Chart
Create an exploding chart effortlessly in automatic diagramming software. Get started instantly from pre-formatted and sleek-looking templates or examples.

How to Create an Expense Report Form
Create a professional expense report form that you can export, share and print. With Edraw, you will end up with a high-quality expense form in less than 3 minutes.

How To Create Event Tree Diagram
Event tree diagram can be created very fast using pre-made symbols. Here is a step-by-step guide to teach you how to draw an event tree diagram with Edraw.

How to Create Evaluation Form in Seconds
Quick but professional guide on how to create evaluation form in seconds.

How to Make an ER Diagram
How to draw an effective ER diagram? Is there an easy way for beginners to create entity relationship diagrams? This method will help you produce high-quality ER diagrams in minutes.

How to Create an Enterprise Architecture Diagram
This article will show you a quick simple guide on how to create an Enterprise Architecture diagram. Feel free to create any standard Enterprise Architecture diagrams even without any professional dra

How to Create an Engineering Diagram Easily
With engineering diagram maker you can draw basic electrical, circuits and logic, industrial control systems, process flow, piping and instrumentation and systems diagram.

Automatic Location Visualization Using Edraw
Visualize the geographical location of corporations, your own houses or any other places so that they can be easily accessible. Learn how to do it automatically with predefined shapes and templates.

Simple Guides to Create Dendrogram
Dendrogram is the visual representation of arrangement of the clusters. Learn how to create dendrogram in a few steps.

How to Create a Decision Tree
This tutorial provides guidelines in creating a decision tree, which help you get well acquainted with Edraw project management software.

How to Wireframe a Conceptual Website
This article will show you how to wireframe a conceptual website within just a few drags and clicks.

How to Make a Comparison Chart Easily
Here we offer a simple tutorial with detailed instructions about how to create a comparison chart.

How to Create Clipart Effortlessly
This article explains how you can easily create your own clipart using images and free clipart resources. You'll learn how to choose which image type to use (e.g., vector, raster, or layered), and bes

How to Make a Circular Diagram
Circular diagrams can be split into segments, each one representing a data value or a set of information. If representing a data value, the segments can be sized according to how large or small the da

How to Draw a Circuit Diagram
This article will provide you with a detailed introduction to the circuit diagram and show you how to make a circuit diagram with Edraw circuit diagram software.

How to Create a Checklist
Want to learn how to make presentation quality checklists? This introductory tutorial covers how to create a checklist using Edraw.

How to Create Good Looking Certificate
It's incredibly easy to create a certificate from ready-made templates. Below is a simple guide on how to create an existing certificate from a template or from scratch.

How to Create Causal Loop Diagram - Simple Guides
This guide shows you how to create a causal loop diagram from scratch and useful technics.

How to Create Career Planning Mind Map
Career planning mind map is an ongoing process that can help you manage your learning and development in your career life. This passage will clearly show you how to create career planning mind map ste

How to Create Outstanding Business Plan
This article will show you the basic steps and some practical skills for making business plan with Edraw.

How to Create a Business Form Effortlessly
Follow this tutorial and learn how to create a business form within 4 steps by using EdrawMax.

Create Business Diagram
With business diagram maker you can draw arrow, basic flowchart, fishbone, circle-spoke, fault tree analysis, epc, pyramid and tqm diagram, etc.

How to Create a Business Card
Here is a simple solution to help you create creative and custom business cards that will immediately attract clients' attention.

How to Create a Bubble Chart
Follow this tutorial and learn how to make a bubble chart/plot within 4 steps.

How to Create Brochure Quickly
A simple guide teaches users how to make excellent brochure easily with Edraw brochure software.

How to Make a Block Diagram
Use a tool better than Microsoft Visio to create a block diagram extremely fast. Learn how to create professional block diagrams that look like those created by experts, even when you are a beginner.

How to Create a Basic Electrical Diagram
Basic Electrical Diagrams are commonly used in engineering and architecture projects. Edraw offers a fast and easy way to create professional basic electrical diagrams for visually describing electric

How to Make a Good-Looking Banner Simply
You will learn the basic steps and some techniques for making fancy banners. With Edraw powerful banner design tool, you can develop high quality banners with the least effort.

Flowchart for Banking System
Draw banking system flowchart with professional flowchart software. Lots of examples and templates help you start right away. Have a better understanding about banking system and banking system flowch

How to Use Concept Map for Better Thinking
Concept map is a useful strategy for the improvement of better thinking. Learn how to use concept map to improve your thinking while presenting ideas and concepts.

Cloud Storage and Team Collaboration
A detailed guide on how to use cloud storage and team collaboration in Edraw.

Edraw Cloud Help
Edraw cloud storage allows users to store files online so that users can access them via the internet and collaborate with project team members in real time.

Check for Updates
Check for updates anytime and sync for exclusive contents.

Use Brainstorming in Six Sigma Program
Use brainstorming tools in six sigma to generate or capture a list of ideas for identifying reasons or solving problems. Gain free and good-looking brainstorming templates for your six sigma program.

A Beginner's Guide to Andriod Wireframing
This page will guide you through the process of creating an Android wireframe. It provides you with a clear clue on how to make accurate and good-looking Android wireframes.

Add Dotted Line to Organization Chart
You can use EdrawMax to add dotted lines to the organization chart quickly. With advanced formatting tools, you can make an outstanding org chart faster than ever.

How to Draw Data Flow Diagrams
How to Draw Data Flow Diagrams - Provide some useful data flow diagrams resource such as how to data flow diagram, data flowchart examples and data flowchart software.


