How to Make a Gantt Chart
The Gantt chart is the ultimate guide and more than a to-do list for the project managers. The Gantt Chart is a handy tool used to pursue the project and everything related to it. It helps the project managers see the project's progress and how much work has been done against a planned time frame.
Have you ever imagined why the project fails or why it sometimes falls on the wrong path? It is because of the lack of planning and of a dashboard to see the progress. But with the Gantt Chart, you can see if your project is going on the track that you have planned in the first place.
Contents
Part 1: What is Gantt Chart?
Gantt charts are a visual method of organising tasks over a period of time. The list of tasks are placed on the vertical axis, while the time is listed on the horizontal axis. Tasks are represented by bars on the axis; the longer the bar, the more time the task will take. Gantt charts will include information such as the start and end date of a project, the persons responsible for the task, and whether there is any overlap between tasks.
Gantt charts are extremely useful for planning projects ahead of time. They allow team members to see which tasks are the most time-consuming, and which ones should be prioritised. It also encourages greater teamwork and communication amongst team members in achieving the project.
What to Consider when making a Gantt Chart?
This section will tell you what things are necessary to remember while making a Gantt chart because in working on a project, it's all about planning and good planning always leads to good platforms. It's important to consider all the things that are listed down below.
- The first thing you have to see is the primary tasks of your project that give more than fifty percent in the project. Know every bit of them and mark them.
- Know the time required to complete those vital tasks, decide the time after consulting the whole team.
- Set all the milestones.
- Know each and every person, their roles, and responsibility related to the project.
- Consider all the barriers that would stand in the way of completing the project.
Part 3: How to Create a Gantt Chart?
Before you start to make a Gantt chart, you can see this theoretical process and get everything needed in a Gantt chart.
- Know the project: It is essential before making a Gantt chart to know the project thoroughly. The first thing is to divide the whole project into sub-basic tasks, and then the whole team has to sit and study each task in the project carefully. Every bit of the task, the probable time it would consume, the resources required, etc.
- Decide the Time duration: Now, when you have done all the division and studying process, it's time to set the time on which these tasks have to be completed. The exact time before this, the probable time was set. For this purpose, it is vital to involve the whole team, take their feedback, and know their abilities. Decide the time the resource requires to complete a particular task.
- Everyone should know everything: It is important to consider the whole team while planning the project. Each and every person in the project should know what things are required to complete a project.
- Mapping all the things to the Gantt Chart: After you have gathered all the tasks and the resources on a platform, now is the time to map all the stuff on the Gantt Chart. The chart should be made with all the considerations you have made.
Just go through each step of the task. Because this is what complete planning is all about. After this process, you have to see how the tasks relate, the relationship between them, how they communicate, etc. According to this, you will decide the sequence of the tasks.
They should know everything about the project. The person with whom they would communicate should know the milestones, the resources, and the tools used to complete a specific task. Everything in the project planning should be transparent to the whole team working on it.
List down all the tasks on the first column, then there would be resources in the next column, and then you will set the bars in front of every or a group of tasks that will depict how much work has been done.
Also, map the decided time duration above the chart plus set the milestones with the bars. Use computer software that will make your Gantt chart look complete and perfect.

An all-in-one platform for 210+ diagrams.
・ Simple alternative to Visio
・ 26k+ symbols
・ 10K+ free templates
・ 10+ AI diagram generators


How to Create a Gantt Chart Effortlessly?
Step 1: Start EdrawMax or visit EdrawMax Online directly.
Step 2: Navigate to [Project Management]>[Gantt Charts]
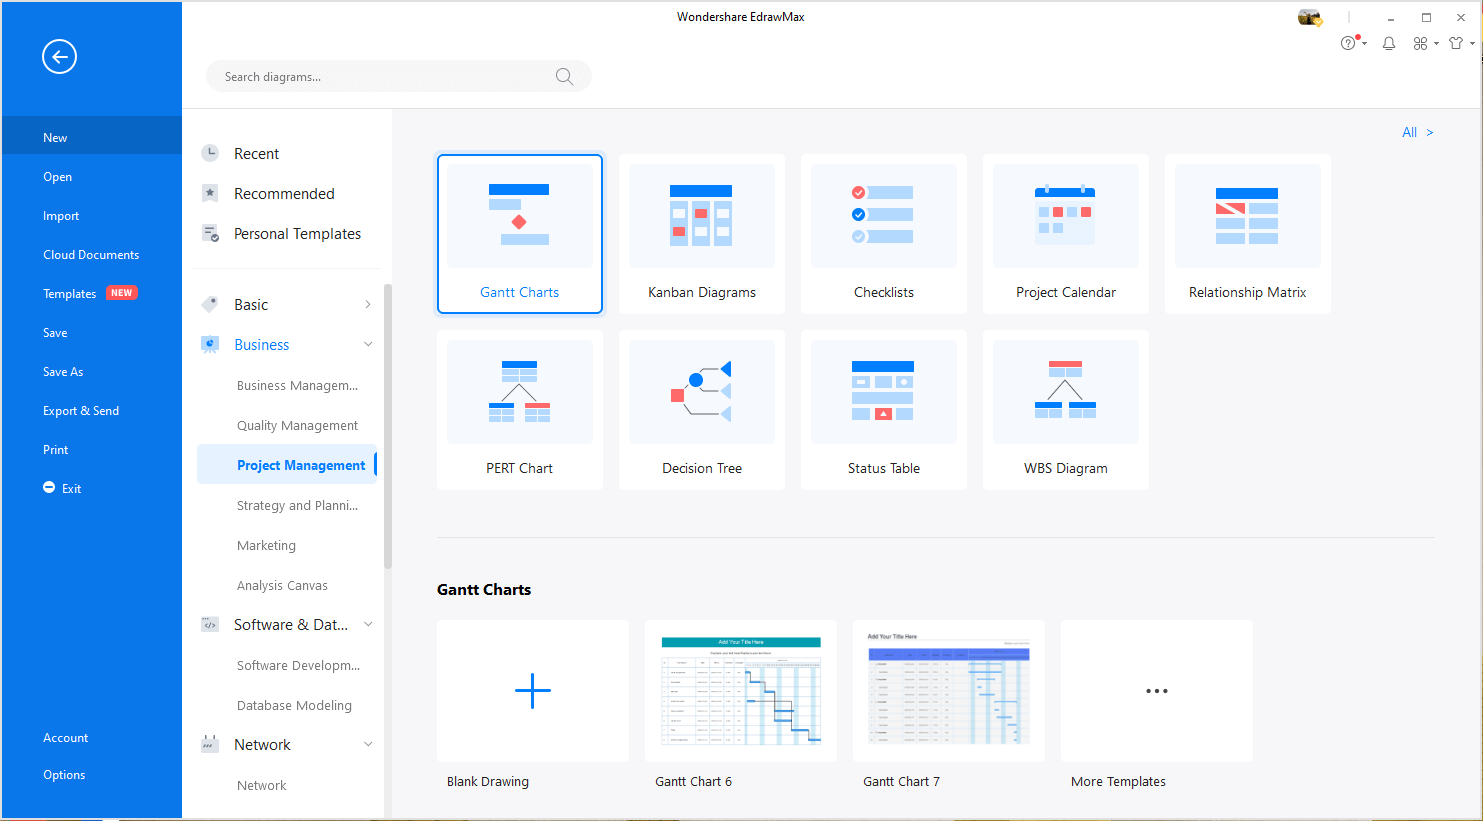
Step 3: Select one gantt chart template to edit on it or click the [+] sign to start from scratch.
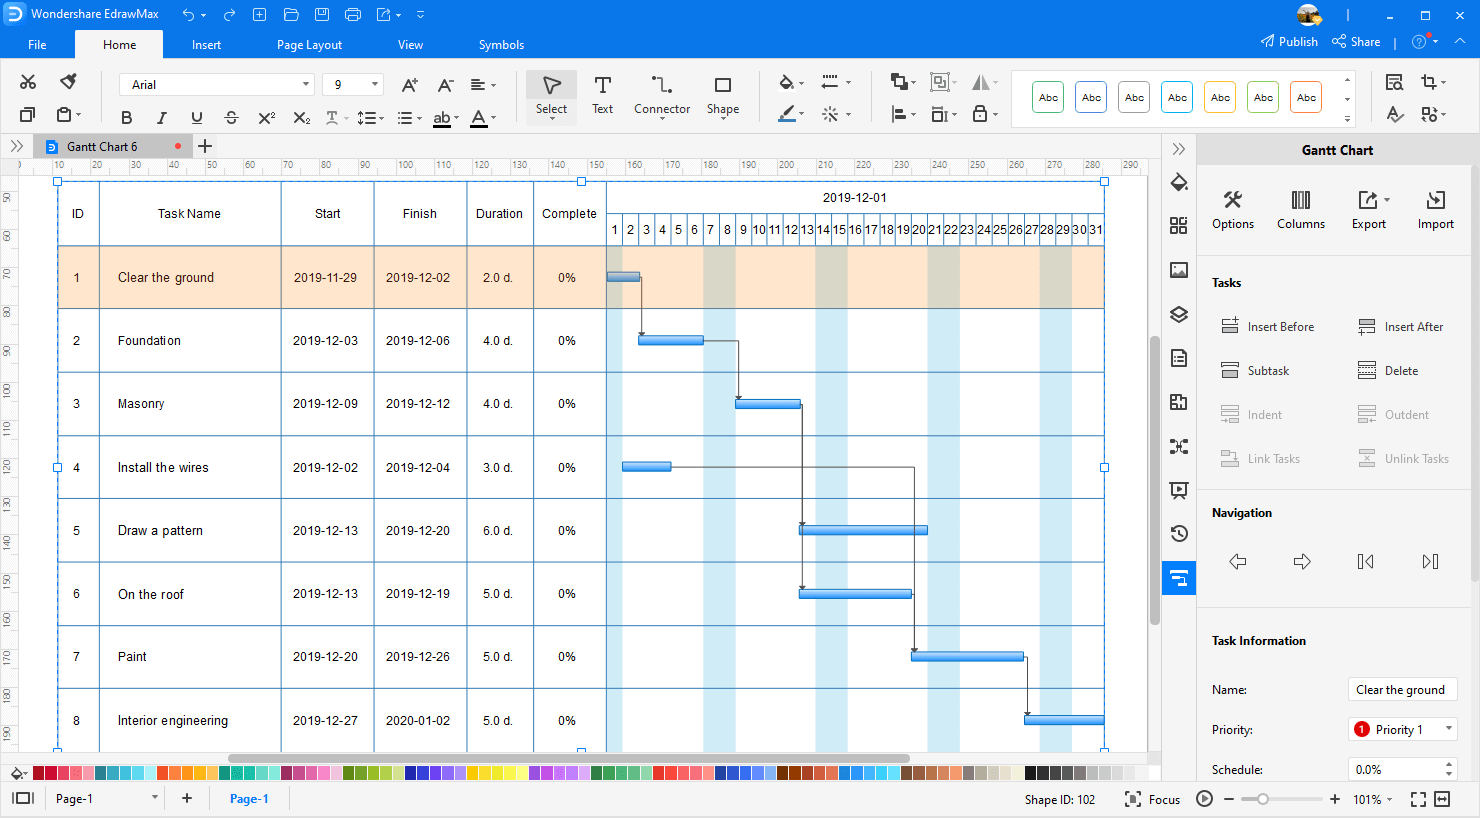
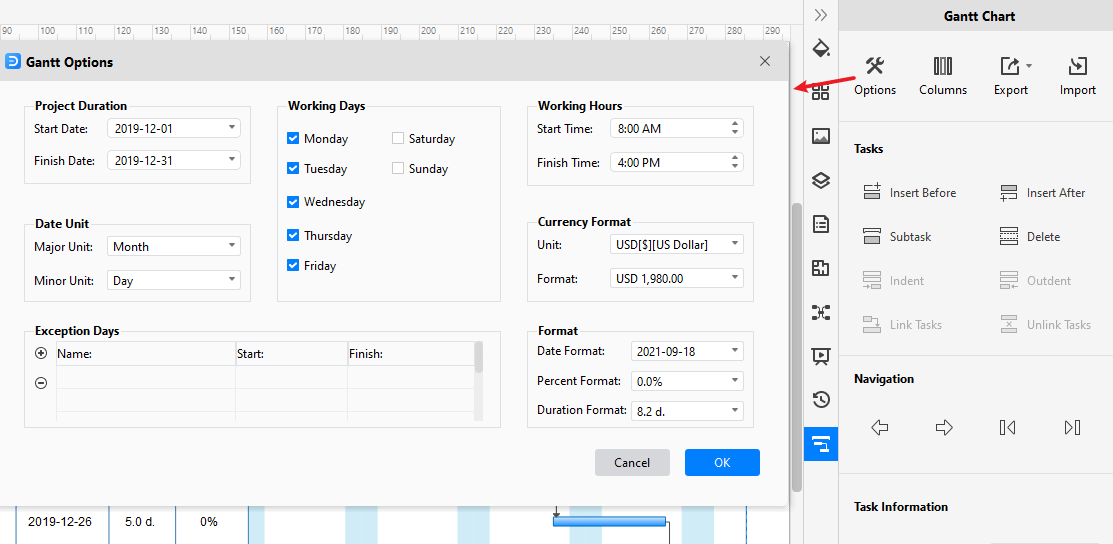
Step 3.1: Select the Gantt chart on the canvas, and the Gantt Options dialogue will pop up automatically. You can set the date unit, date format, start and finish date in the dialogue.
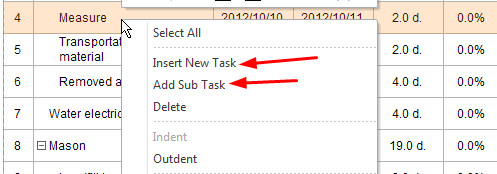
Step 3.2: Right-click on selected task and add a new task or a sub task. You can also use the quick buttons on the Gantt Chart pane to add a task, add a sub task, or delete a task.
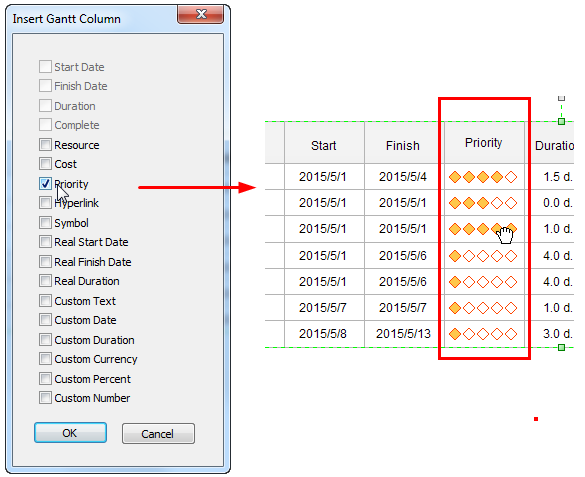
Step 3.3: Right-click on selected task and insert a new column after the selected column. Choose the title of column from the pop-up dialogue box. For example, we can add a priority column.
Note:
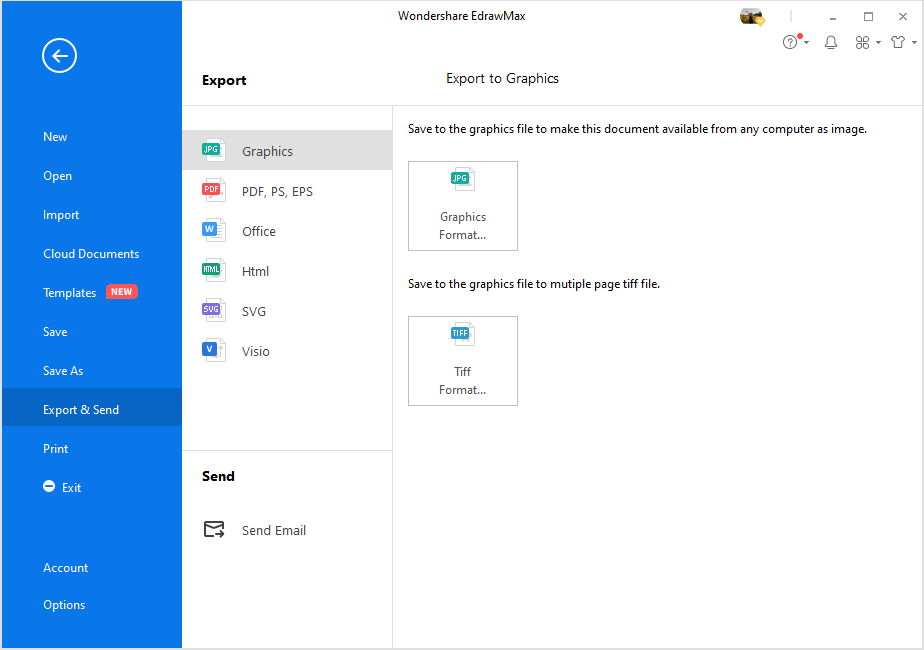
Step 4: You can export the file to Graphics, PDF, editable MS Office file, SVG and Visio vsdx file.
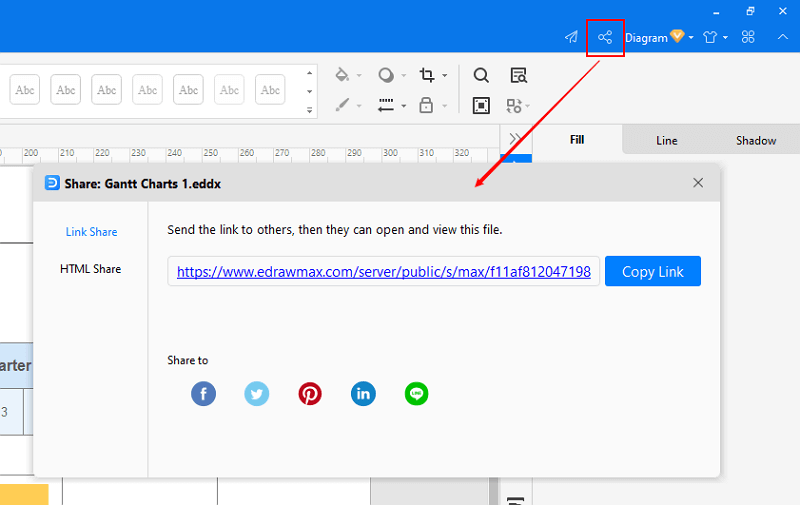
Step 5: And you can share your diagram with others via social media and online website page.
To get more detials about how to make a Gantt chart with Edraw Gantt chart maker, please watch the following video tutorial:
More Tips on Creating a Gantt Chart with Edraw
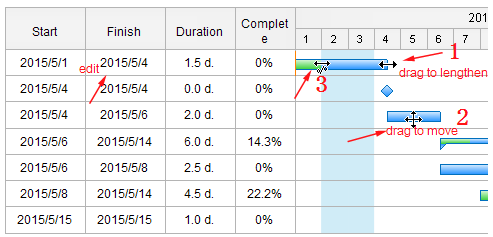
How to Change the Task Bar: When double clicking the text editing box to input task start date and finish date, the progress bar will be updated automatically according to the new date. Also, you can hover the cursor at the end of a bar, when the cursor changes as a two-way arrow (No.1), drag the bar to change the finish date. Hover the cursor above a bar, and when the cursor changes as a four-way arrow (No.2), you can move the whole task bar. When the bar is moved, the start and finish date will change accordingly. Input the task completed percentage, and the green progress bar will be upgraded automatically. Also, hover your cursor at the beginning of the bar, when the cursor turns as a two-way arrow and a percent symbol (No.3), drag the bar to change the complete percentage.
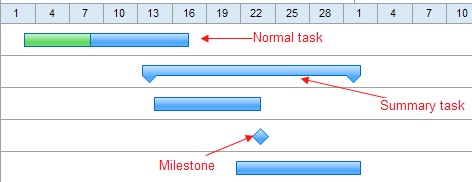
Different Task Type in Gantt Chart: There are three different task types in the Gantt chart: Normal, Summary and Milestone. You don't have to set the type explicitly. The Gantt chart software will process it automatically. The normal task has a completed percentage. You can set it as the above description. If a task has some sub tasks, the task will become a summary. A milestone task can be a diamond shape while you drag the two yellow control points together.
The Dos and Don’ts of Making an Effective Gantt Chart
This section will see the five do's and don'ts while making the Gantt chart. To make an effective Gantt chart read the below points carefully.
The Five Do’s:
- Know and share every detail of your project because the more you know then, the more you will easily track it.
- Arrange the tasks in the group form because it is how the Gantt chart is made, and this makes your work easy.
- Add all the essential information and detail with your tasks in the Gantt chart.
- Mark the tasks with the team, recourse, and tools required to complete them.
- Also, add the starting and ending time with each task with the time duration.
The Five Don’ts
- Don't forget to mention which task is dependent on what task, what task has to be done to complete the other task. Note everything regarding the task dependencies.
- Don't forget to consult the whole team before starting assigning the tasks. Always check the availability of the resources.
- Don't skip the weekends and national holidays. Make the time duration by measuring them also.
- Don't forget to make the Gantt chart visible to the whole team. It is necessary to get their feedback to correct and modify the chart.
- After publishing it, don't forget to use it to track the project progress. Please take it as an essential guide.
How to Use a Gantt Chart for Project Management?
In the following way, you can use the Gantt Chart for project management.
Collaborating with the Team
Use a Gantt chart to see and collaborate with the team. The collaboration would be for anything like discussing the progress of the project, correcting any task, modifying the chart, extending or trim the task or the project. This collaboration is the best tool to check the recourse and their availability.
The Time and Efforts
You can use the Gantt chart to track the time it is consuming to complete a particular task. You can check if the team is doing work by thinking about the time duration in mind. Compare the set time duration and the actual hours and then decide whether the project would be delivered before the deadline, or it would need more time, etc.
Check the overall project
You can track the overall progress of the task. Check if your project is going on the right path or the team is lacking something. You can take all the necessary measures to keep your project on the decided track.
Gantt Chart Examples
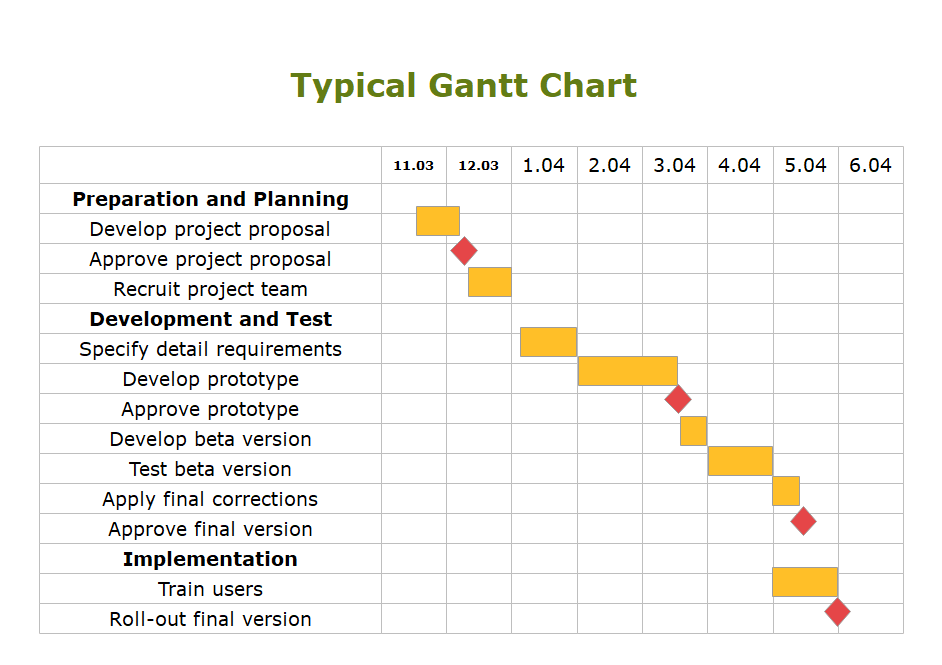
Example 1: Typical Gantt Chart
Gantt charts are a visual method of organising tasks over a period of time. The list of tasks are placed on the vertical axis, while the time is listed on the horizontal axis. Tasks are represented by bars on the axis; the longer the bar, the more time the task will take. For example, we can see developing a prototype will take longer than the other steps in the timeline. Gantt charts will include information such as the start and end date of a project, the persons responsible for the task, and whether there is any overlap between tasks.
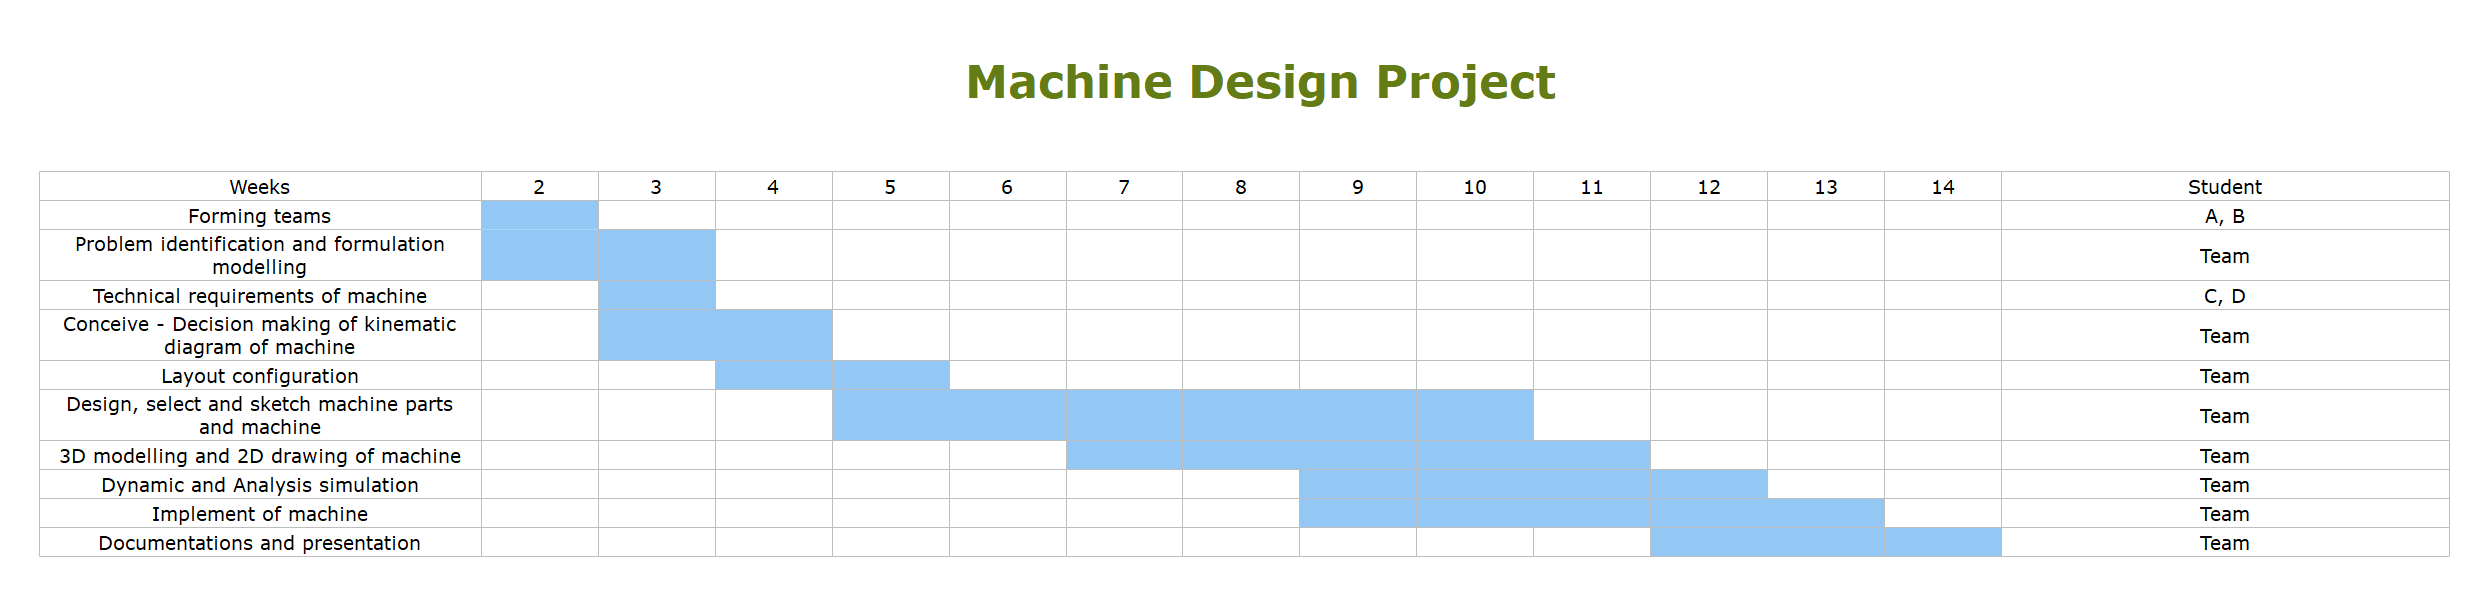
Example 2: Machine Design Project
In this gantt chart, the Faculty of Mechanical Engineering has created a Gantt chart to plan out how much time will need to be spent for each module of their course, and which group of students will be taking each course.
Related Articles
Creating Gantt Chart From Data
What Is a Dependency in the Gantt Chart?
Who Uses Gantt Charts - Explore the Most Popular Roles


