How to Make an ER Diagram
Contents
What is Entity Relationship Diagram (ERD)?
In the context of database design, an entity is an object or data component. To illustrate the structure of a database, you must first define the entities and show the relationships between them. An entity-relationship diagram (ER Diagram) is used for this very purpose. It allows you to create a new database or document an existing one to manage or maintain it.
ER diagrams offer a visual representation of a database structure, making it more digestable for non-technical stakeholders. Databases can become very complicated, very fast. By having a visual representation of the database on hand, IT professionals can better analyse a database and identify problems more quickly.
ER Diagram Symbols
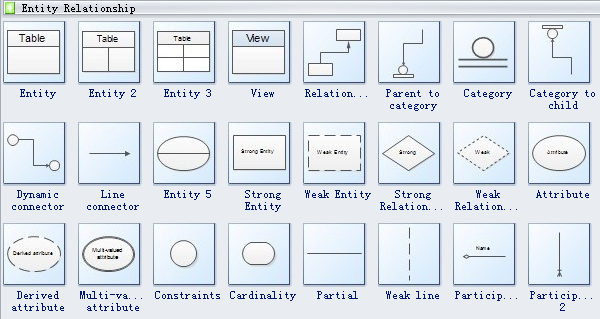
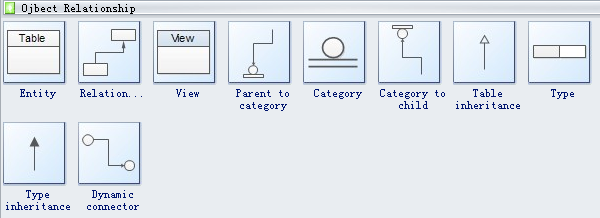
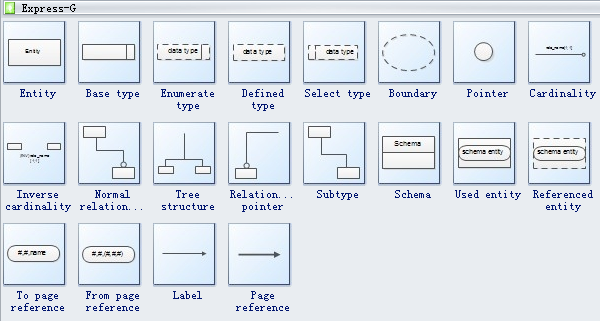
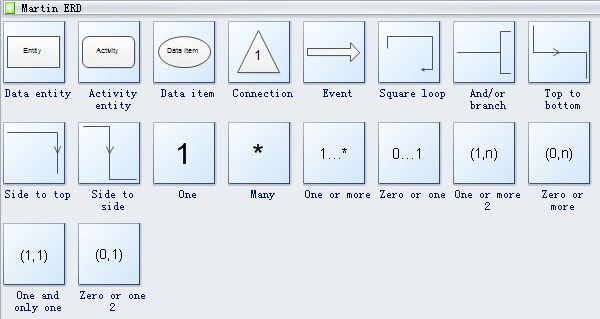
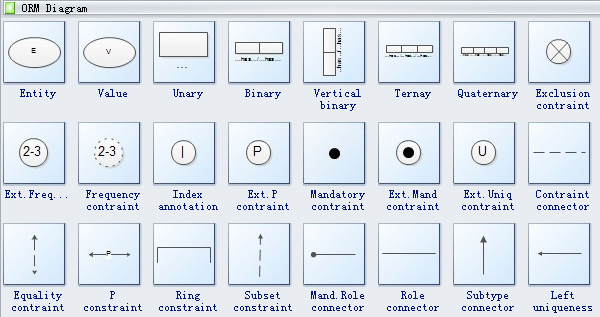
Below are pre-made and editable entity relationship symbols in EdrawMax , including entity, view, parent to category, category to child, dynamic connector, line connector, strong entity, weak entity, strong relationship, weak relationship, attribute, derived attribute, constraint, and participation, etc.
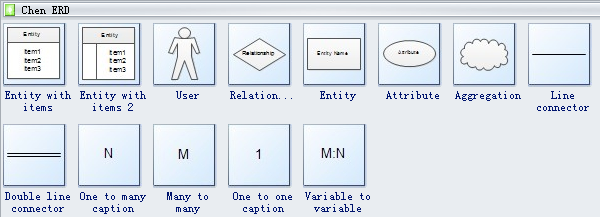
Chen ERD Symbols
Entity Relationship Symbols
Object Relationship Symbols
Express-G Symbols
Martin ERD Symbols
ORM Diagram Symbols
How to Identify ER Diagram Symbols?
Entity Relationship Diagrams are really helpful, but it is essential to know all their components, symbols, and meaning of these symbols before you can use them. So, here we will discuss the three main components of an ER diagram and their shapes and relationships. These three components form the basis of every Entity-Relationship diagram, and an ERD would be incomplete if any one of them is missing. We will discuss these components in terms of Chen’s notation as well as Crow’s Foot notation.
Entities
The most significant component of an ER diagram is its entities. Since an ERD represents the structure of a database, the entities are the tables that the database is composed of. Entities are nouns, such as concepts, locations, products, roles, events, and things.
Now, the critical thing is to understand that different notations have different symbols.
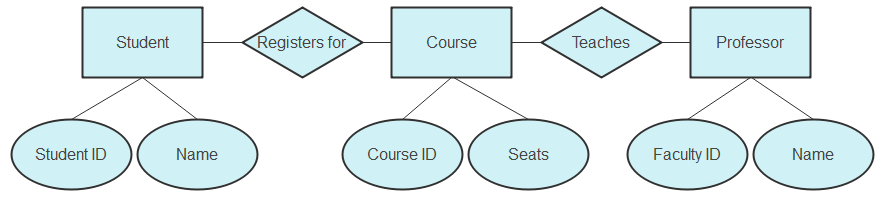
- Chen’s Notation: In this notation, the entity is represented by a rectangle. The entity is written inside a rectangular box.
- Crow’s Foot Notation: A table is formed with the entity as the title in this notation.
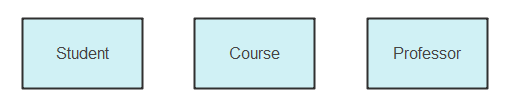
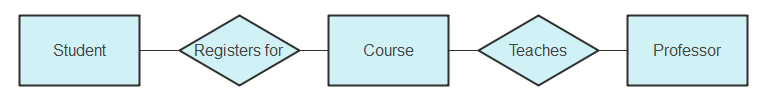
In this example, student, course, and professor are entities.
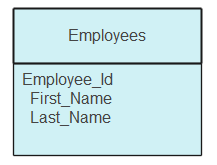
In this example, “Employees” is an entity.
Relationships
After entities, the second component is the relationships between the entities. These relationships show what the associations between the different entities are. Usually, these relationships are depicted by verbs.
The symbols used to show a relationship in an ERD are as follows:
- Chen’s Notation: In this notation, the relationships are represented by a diamond with descriptive text written inside it.
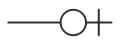
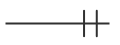
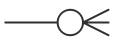
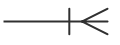
- Crow’s Foot Notation: In this notation, the relationships are represented by a line. On both ends of the line, symbols are present that describe the relationship’s cardinality.
| Description | Symbol |
|---|---|
| Ring and dash: Minimum zero, maximum one (optional) |
|
| Dash and dash: Minimum one, maximum one (mandatory) |
|
| Ring and crow's foot: Minimum zero, maximum many (optional) |
|
| Dash and crow's foot: Minimum one, maximum many (mandatory) |
|
Attributes
After relationships, the next part is the attributes of the entities. As an entity is the table of a database, its attributes are the facts that describe the table. Usually, the attributes are nouns and form the columns of the tables in the database.
Now, let’s take a look at the symbols.
- Chen’s Notation: In this notation, attributes are represented by a circular shape. They originate out of the entity.
- Crow’s Foot Notation: The attributes are listed under the table with the entity title in this notation.
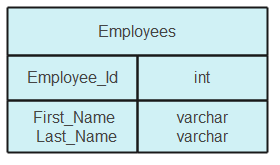
In this example, employee ID, first name, and last name are the attributes of “Employees.”

An all-in-one platform for 210+ diagrams.
・ Simple alternative to Visio
・ 26k+ symbols
・ 10K+ free templates
・ 10+ AI diagram generators


How to Make a ER Diagram?
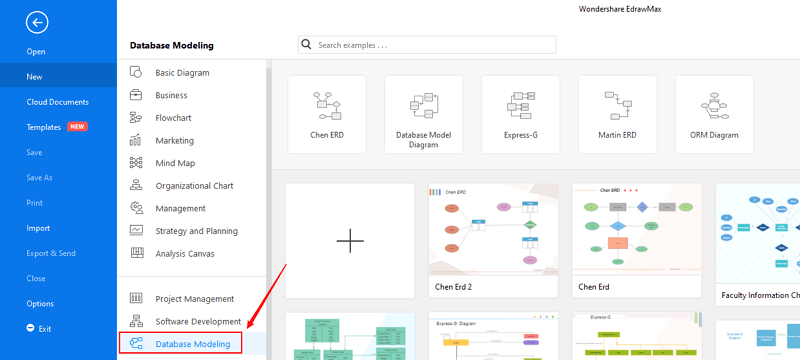
Step 1: Install and enable EdrawMax from your computer, and navigate to [New] > [Database Modeling]. You can see all the pre-made tempaltes of ER Diagrams.
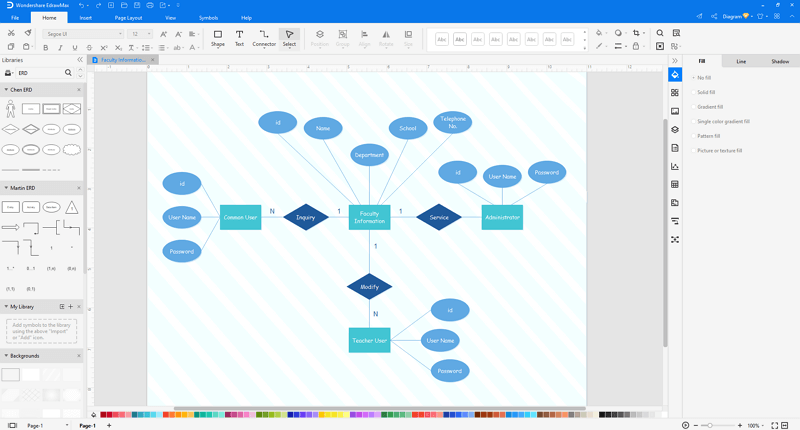
Step 2: Open and modify an ERD template selected from the gallery, or you can create a new one with ERD symbols provided by EdrawMax. The handy and powerful editing and formatting tools will also give you great help to create the diagram in minutes.
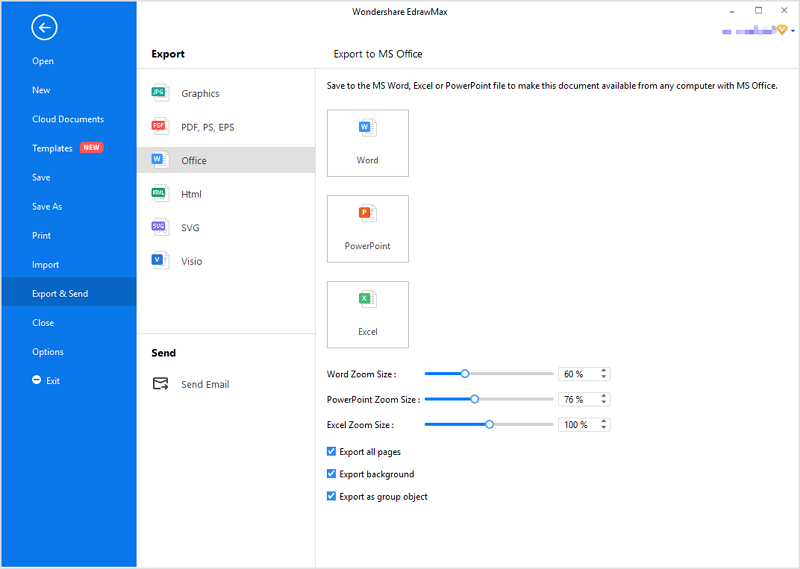
Step 3: When you have made your ERD in EdrawMax, you can save and export the drawing to graphics(JPG, PNG), PDF, SVG, Visio vsdx file format, editable MS Office file format, and HTML.
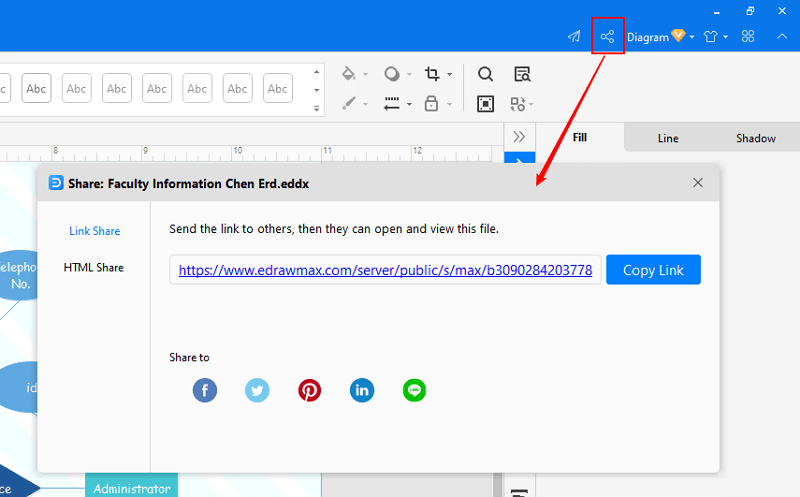
Step 4: Alternatively, you can share your ER diagram with your team via social media and sharing links. You can also publish your drawings into EdrawMax's template gallery and present it online.
You can watch the video tutorial below and learn more details about how to draw an ER diagram with EdrawMax!
Best Practices for Developing Effective ER Diagrams
Making an ER diagram is a relatively simple task but could be a little challenging for a beginner. So, here are some tips to remember.
- Note down all the entities separately to ensure that you don’t miss any out.
- Be precise when naming the entity, attribute, or relationship. It would help if you avoided extensive and vague names at all costs.
- Make sure that you have not repeated an entity or relationship more than once. Remove redundancy from your ER diagram.
- Do not connect a relationship with a relationship. Entities and attributes are connected, not relationships.
- Use colors to highlight different areas and visually enhance your ER diagram.
Part 6: ER Diagram Examples
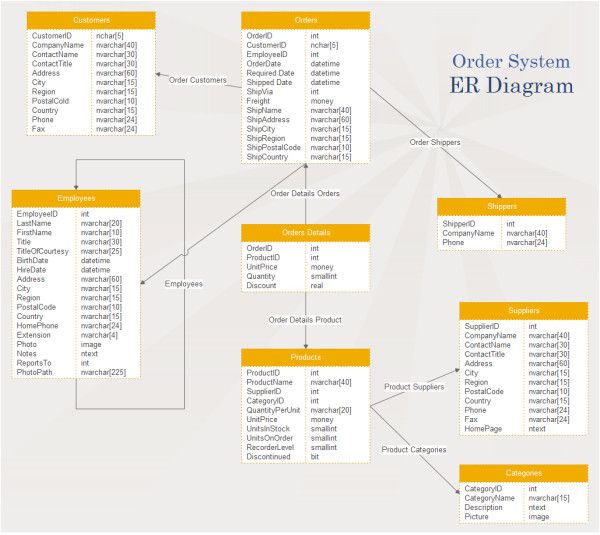
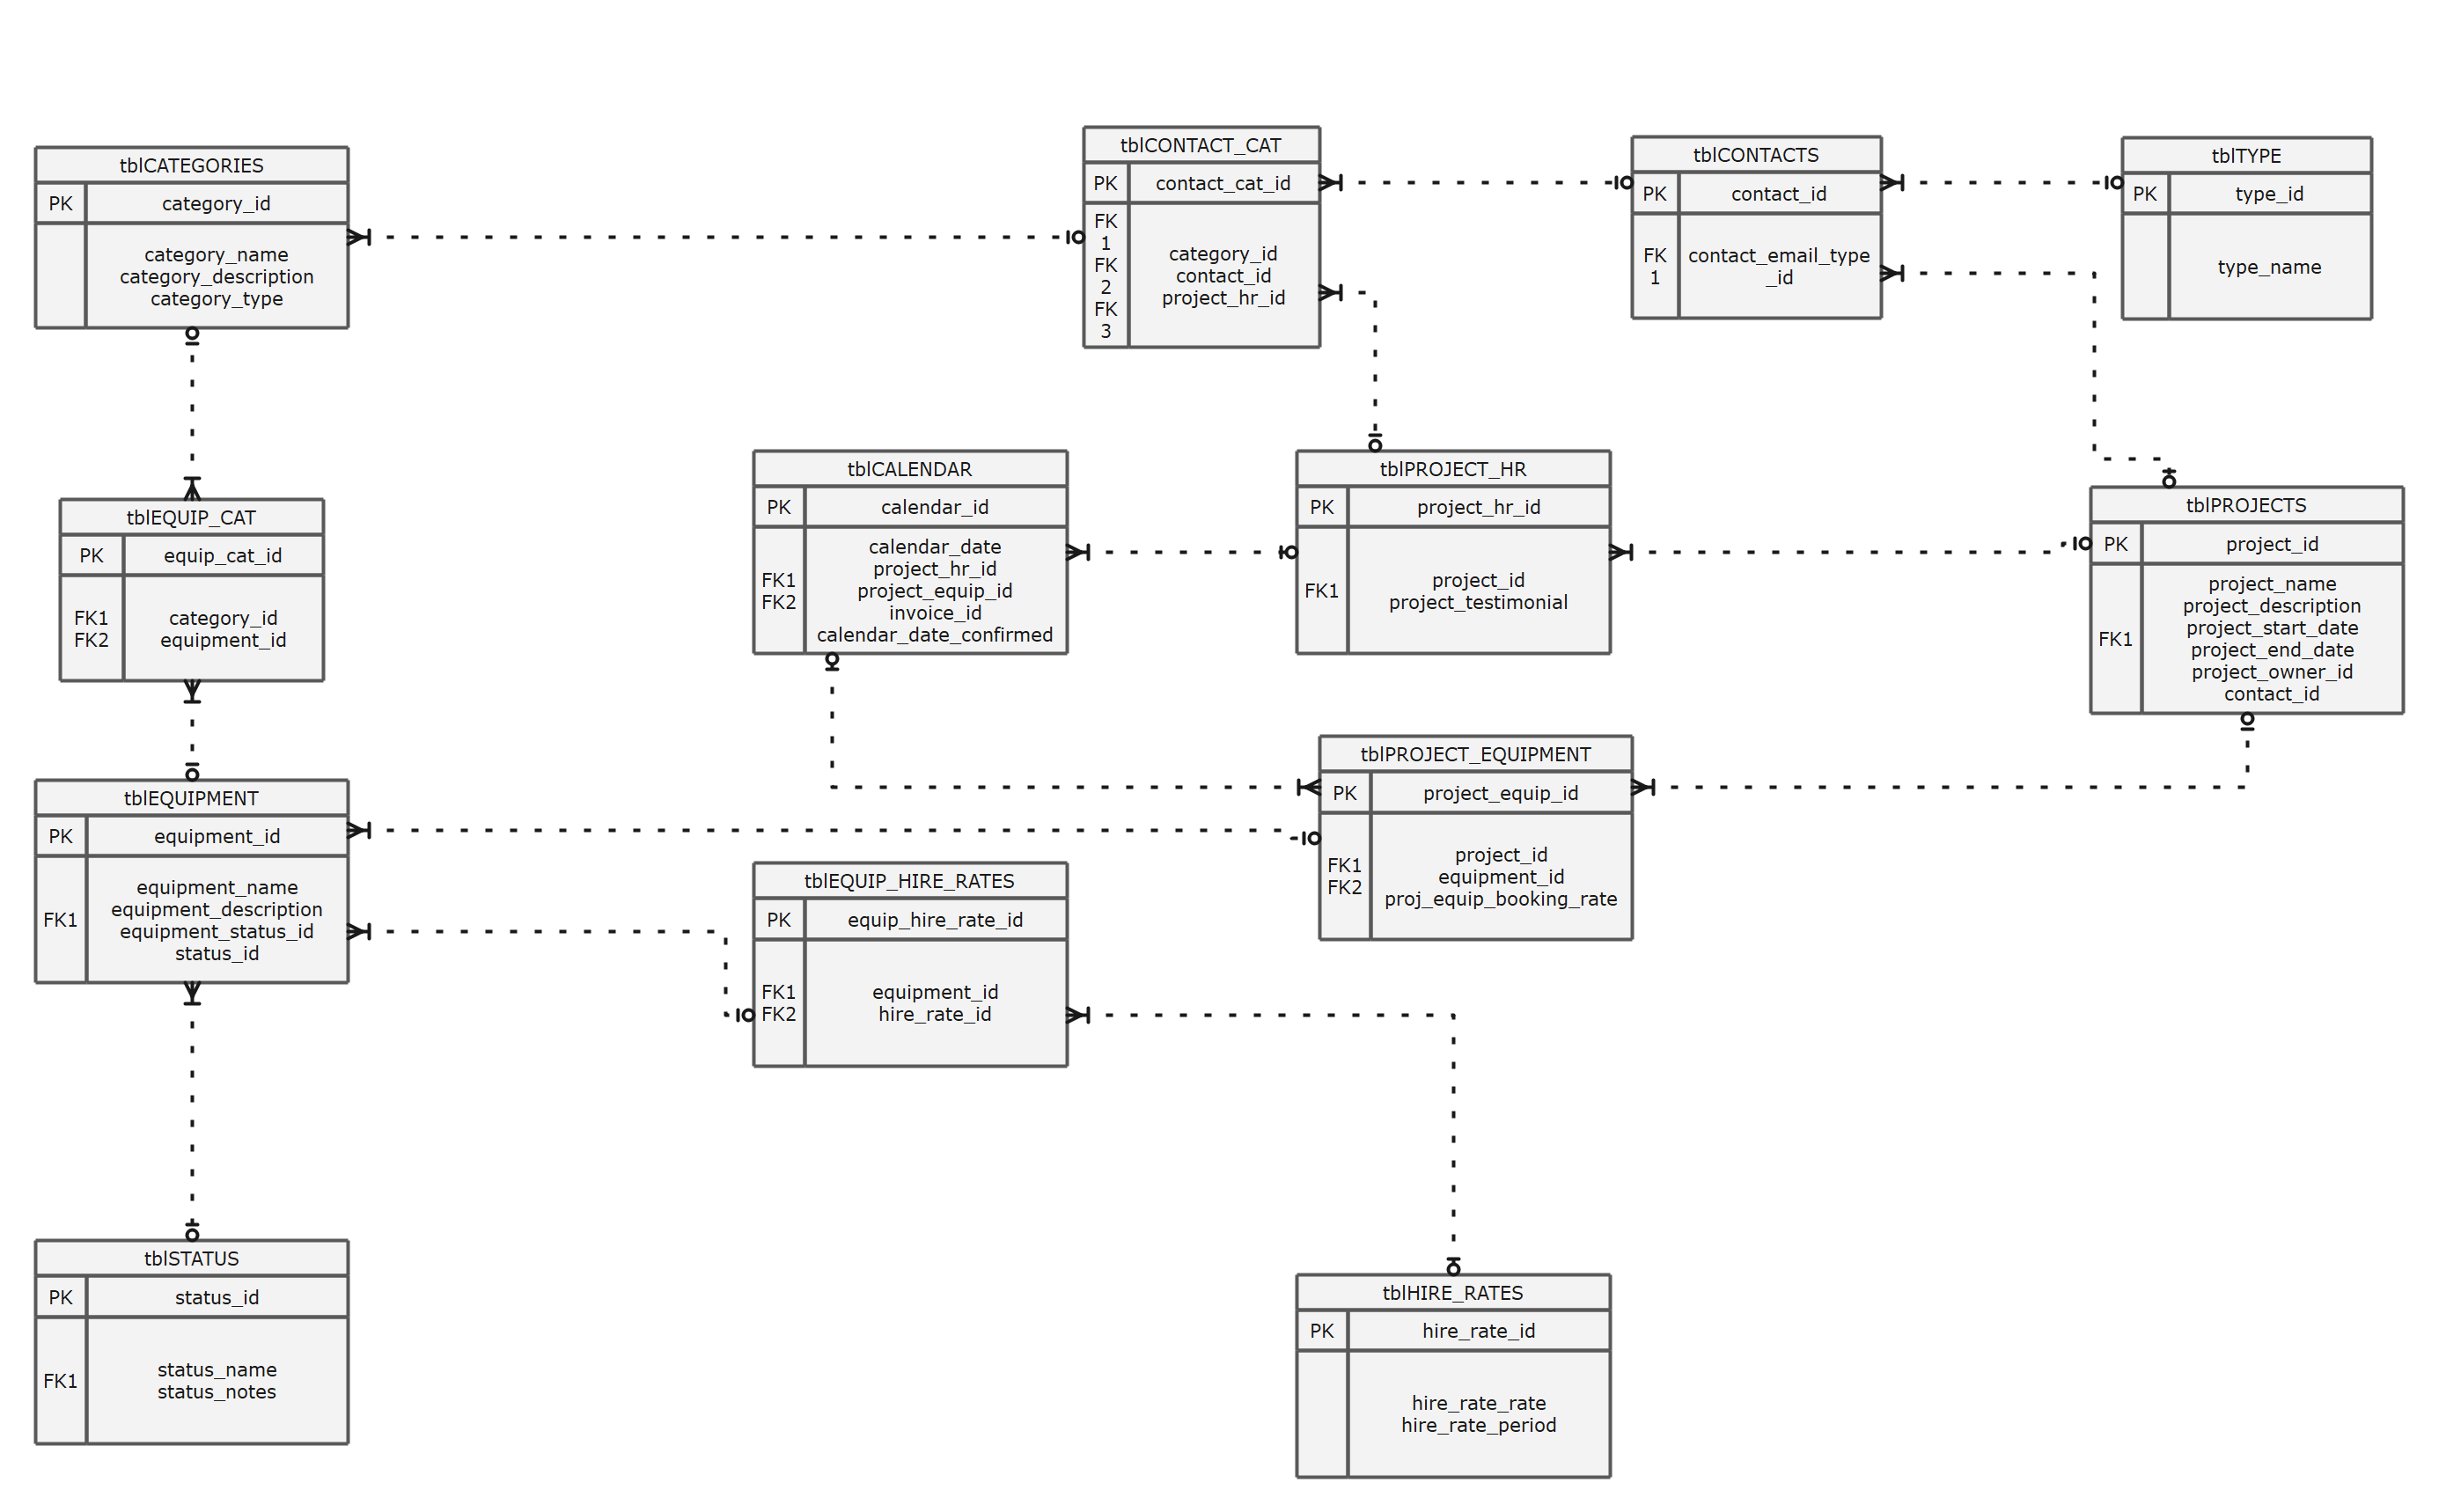
Example 1: Standard Entity Relationship Diagram
An Entity Relationship Diagram is a visual representation of how several entities exist in a system and their relationship with one another. A standard ER diagram shows department ids and their relationship with other service providers within the same industry.
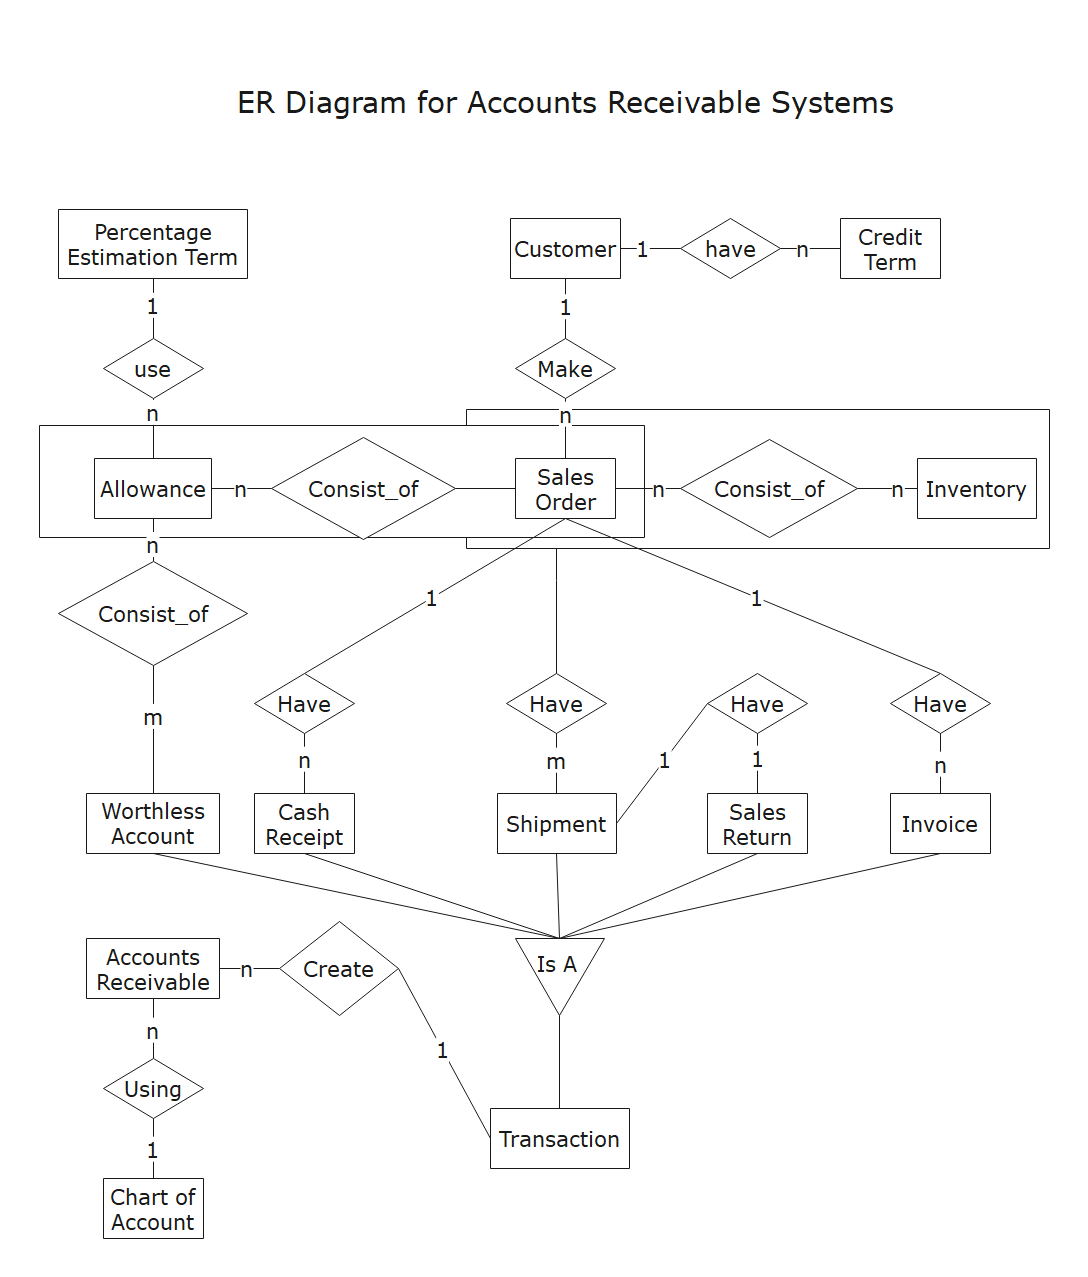
Example 2: ER Diagram for Accounts Receivable Systems
An ER Diagram for Accounts where a complete transaction flow happens can be visually illustrated using receivable systems’ mockup. An accounts receivable system shows who owes them money and how much they owe. It also reveals the ways to improve the cash flow that will directly impact a business’ workflow.
Here shows more editable ER Diagram examples created by EdrawMax. You can download and edit these ER diagrams in EdrawMax for free!