How to Create Effective and Beautiful Sales Dashboard
Sales dashboard involves with various charts and graphs that are used for particular data visualization. As an all-in-one diagramming tool, Edraw offers easy methods to create quality charts and graphs, including pie chart, bar chart, column chart, scatter plot, gauges chart, line chart, area chart, doughnut chart,etc. What's more, it offers good looking sales dashboard templates for free download.
Here are the basic steps and useful tips:
Start a New Sales Dashboard Drawing Page
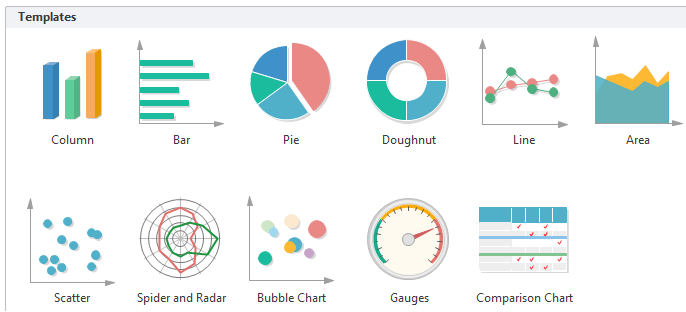
Start Edraw, from the Available Templates, choose Chart. You will see a series of chart drawing types included in this category. Double click any one of them to open a blank drawing page.
Download a free trial and see first-hand how quickly and easily you can create great-looking sales dashboard.
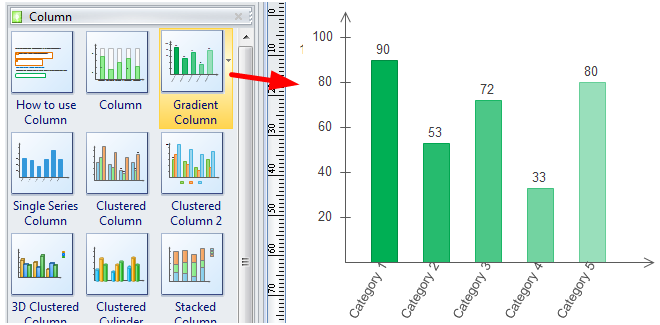
Drag and Drop Pre-drawn Symbols and Templates
When a drawing page is started, all corresponding symbols will be opened on the left of the canvas. Drag required symbols and drop onto the canvas to start drawing.
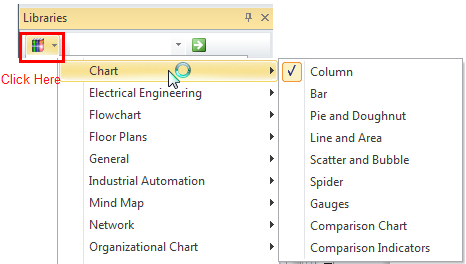
Open a New Symbol Library
If you need symbols and templates for other charts, it's not necessary to start a new drawing page. Simply click the Library button to open the drop-down menu and navigate for needed symbols. Multiple libraries could be opened simultaneously.
You can click the X button to close the libraries that you don't need.
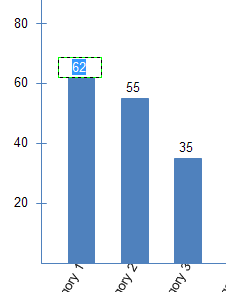
How to Set Data on Templates
Directly change data on the template.
You can double click on the data label to change the data. The chart shape will adjust automatically.
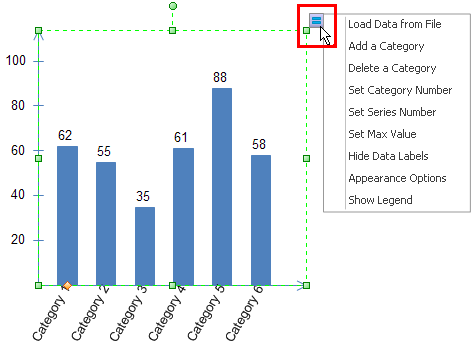
Use Floating Button to Customize the Chart
Every chart is designed with a floating button on the top right corner. Click the floating button you will see a drop-down context menu including the options of max value, category and series numbers, legend and appearance setting.
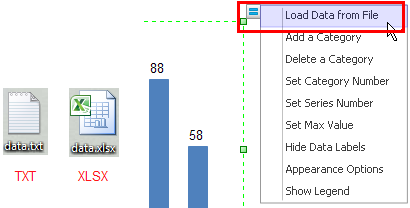
Import a Data File
This is the most straightforward and convenient method for quick start. What you need to do is to save all the data in a file (there is a sample format you can follow), and by importing this file you will instantly generate a chart, without setting data one by one.
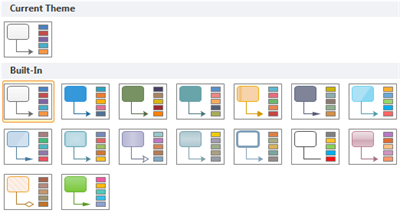
Customize Appearance and Apply a Theme
When you finish creating a dashboard or a chart, it's time to customize the appearance. You can apply quick styles for the chart first, and change themes from the theme gallery. There are 16 sets of themes available.
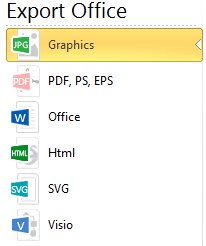
Print and Export the Data Dashboard
When it's done, you can print the drawing and export it to different formats. Edraw supports a wide range of export options, including PDF, PPT, Word, Html, SVG, JPG, and a lot more.
Sales Dashboard Templates
A list of sales dashboard templates are provide to download and use. These templates are fully customizable, available to edit data, change color and theme.
Sales Status Dashboard Template
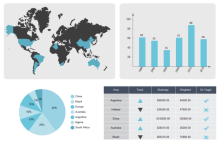
Here is a well-created sales status dashboard template provided for users to download and use. All charts and graphics you see on this dashboard are created by existing smart templates. Try this easy method to make your own sales dashboards.
Monthly Sales Dashboard Template
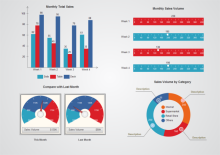
A free customizable monthly sales dashboard template is provided to download and print. In Edraw there are many tools and templates available to represent monthly sales report.
Sales Data Dashboard Template
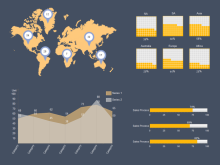
Edraw has included a sales data dashboard template for free download. Other than the charts you see on this sales data dashboard, their are more charts and graphs templates available in use, such as pie chart, doughnut chart, column chart, scatter plot, etc.
Sales Performance Dashboard Template
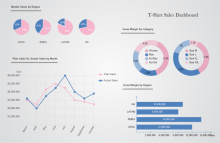
Sales performance dashboards are usually composed by a series of charts and graphs showing sales data. It's an essential tool for sales data presentation. Try a diversity of easily customizable templates in Edraw for creating sales performance dashboard effortlessly.
Video Tutorials


